HAL Id: hal-01122713
https://hal.archives-ouvertes.fr/hal-01122713
Submitted on 9 Jan 2019HAL is a multi-disciplinary open access archive for the deposit and dissemination of sci-entific research documents, whether they are pub-lished or not. The documents may come from teaching and research institutions in France or abroad, or from public or private research centers.
L’archive ouverte pluridisciplinaire HAL, est destinée au dépôt et à la diffusion de documents scientifiques de niveau recherche, publiés ou non, émanant des établissements d’enseignement et de recherche français ou étrangers, des laboratoires publics ou privés.
Distributed under a Creative Commons Attribution - NonCommercial - NoDerivatives| 4.0 International License
Microstructural design of new high conductivity – high
strength Cu-based alloy
Stéphane Gorsse, Blanche Ouvrard, Mohamed Gouné, Angeline
Poulon-Quintin
To cite this version:
Stéphane Gorsse, Blanche Ouvrard, Mohamed Gouné, Angeline Poulon-Quintin. Microstructural design of new high conductivity – high strength Cu-based alloy. Journal of Alloys and Compounds, Elsevier, 2015, 633, pp.42-47. �10.1016/j.jallcom.2015.01.234�. �hal-01122713�
Microstructural design of new high conductivity – high strength
Cu-based alloy
S. Gorsse*, B. Ouvrard, M. Gouné, A. Poulon-Quintin
CNRS, Université de Bordeaux, ICMCB,
87 avenue du Docteur Albert Schweitzer, 33608 Pessac Cedex, France
Abstract:
Some novel high conductivity-high strength materials were designed in the binary Cu-Mg.
They exhibit an excellent balance between strength and electrical properties. The properties
and the performance of the designed materials are compared with the main Cu-based alloys
and the analysis shows that they perform equally to the best one (Cu-Be). Furthermore, we
show that an increase of Mg content modifies the microstructure feature and leads to a strong
increase of strength without any significant deterioration of the electrical conductivity. This
behavior was attributed to the formation of eutectic islands in which high density of Cu2Mg
nanoparticles precipitate.
1. Introduction
Copper-based high strength conductive alloys are used in a myriad of applications in
automotive, aeronautic and electronic industries such as conductive springs,
interconnections, etc [1]. The demand of these materials is booming, partly driven by the
increase use of copper in existing applications but also by energy and environmental
considerations where their uses in emerging applications such as electrical propulsion and
[2] which has the disadvantage of toxicity and cost. There is a great demand for the
replacement of Cu-Be alloys by new toxic free and environmentally friendly high strength-high
conductivity materials.
Among the different approaches proposed to develop high strength and increase electrical
conductivity of Cu alloys, severe plastic deformation leading to ultrafine grained
microstructure and nanoscale precipitation of a secondary phase are the most investigated
for solute having a very limited solubility in Cu such as Cu-Cr [3,4,5] and Cu-Ag [6], for example.
In an attempt to find an alternative, we focused on the Cu-Mg system for two main reasons
(1) Mg affects only weakly the electrical conductivity of Cu [7] and (2) in contract with Cu-Cr
and Cu-Ag, it provides several degree of freedom to generate microstructures (eutectic
transformation, driving forces for precipitation). Studies of Cu-Mg alloys are not numerous
and mainly limited to the aging response of low alloyed compositions [8, 9, 10, 11] apart from
the work of Fehrenbach et al. [12] and Fidler et al. [13] on the eutectic transformation.
In order to obtain high strength – high conductivity materials, an alloy design was performed
in the Cu-Mg system from the thermodynamic properties of the studied system. Then,
different compositions of Mg (4.1at%, 8.1at%, 23.1at%) were selected and the evolution of
microstructural, electrical and mechanical properties were investigated. It was shown that the
obtained materials exhibit an excellent balance between strength and electrical conductivity
properties and an increase of Mg contents leads to a strong increase of strength without any
significant deterioration of the conductivity. The origin of such properties is discussed from a
metallurgical point of view.
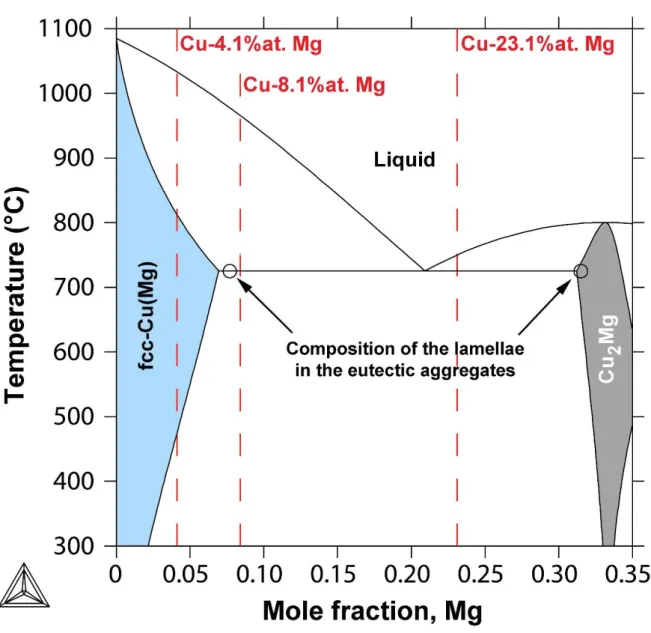
There are several experimental and thermodynamic descriptions of the Cu-Mg system in the
literature [14,15,16]. The most recent results agree that the Cu-Mg system consists of the
liquid, the terminal solid solutions: fcc (Cu solid solution), hcp (Mg solid solution), and the
intermetallic compounds Cu2Mg and CuMg2 (Fig.1). Both intermetallic phases melt
congruently and are involved in eutectic reactions with either fcc or hcp solid solutions. We
have used the thermodynamic parameters evaluated from the CALPHAD assessment of
Coughanowr et al. [14] in which Cu2Mg is described by the sublattive model (Cu,Mg)2(Cu,Mg)
and the compound energy formalism in order to reproduce the homogeneity range, whereas
CuMg2 is considered as a line compound.
Adding any solute to Cu leads to a decrease of its electrical conductivity because the local
perturbation of both the atomic and electronic structure of the perfect crystal around the
impurity atoms acts as scattering centers for electrons. The scattering effect increases with
the difference of size and valence between the solute and the host atoms, this is why the
residual resistivity arising from impurities increases as the position of the solute element
becomes distant from that of a host component in a given line of the periodic table [17]. More
precisely, the residual resistivity is a function of the scattering cross section of the impurity
which increases as the square of the valency difference between the impurity and the host
metal [18]. In the case of Mg, the excess valency is only of 1 which is enough to disrupt the
uniform charge of Cu and screens the conduction electron. The magnitude of the screening
radius is given by (6𝜋𝑒2𝜌0⁄ )𝐸𝐹 −1/2, where EF is the Fermy energy and 0 the density of
conduction electrons [19]. With the values of EF = 7eV and 0 = 8.5 1028/m3 for pure Cu, this
gives a magnitude of the screening radius of about 0.055 nm which is much shorter than the
interatomic distance of 0.255 of pure Cu and leads to an increase of the resistivity. According
However, the presence of the Cu2Mg compound provides a mean to decrease the amount of
the residual solute since an important fraction of Mg will leave the Cu lattice to form the
corresponding secondary phase. Secondary phase particles scatter electrons too with an
effect that depends on their size and spacing (compared to the electron mean free path),
though not as much as solute atoms.
In order to evaluate the effect of the microstructure (solute atoms, secondary phase, grain
boundaries) on properties, three alloy compositions were selected to cover the main features
of the Cu-Mg phase diagram (see Figure 1):
(1) Cu-4.1at%Mg, on cooling this alloy will not cross the eutectic line leading to the formation
of a single-phase fcc-Cu solid solution of composition identical to that of the alloy,
(2) Cu-8.1at%Mg, on cooling the liquid phase will reach the eutectic composition and the alloy
will end in the two-phase field fcc-Cu + Cu2Mg,
(3) Cu-23.1at%Mg that is close to the eutectic composition.
3. Experimental procedure
The Cu-Mg alloys were prepared by induction melting of Cu (99.99%) and Mg (99.9%) pieces
in a glassy carbon crucible under argon. This way, small ingots with 16 mm in diameter and 30
mm in height were obtained. Metallographic examination was performed by scanning
electron microscopy (SEM) on a polished sample. Phase identification was made using X-ray
diffraction (XRD) and electron probe microanalysis (EPMA).
The electrical conductivity was determined at room temperature by the linear four probe
a rate of 40 m/s and maintained during 20 seconds. Each measurement was taken 10 times. This hardness have been converted to yield strength from the Taylor Factor [22].
4. Experimental results and discussion
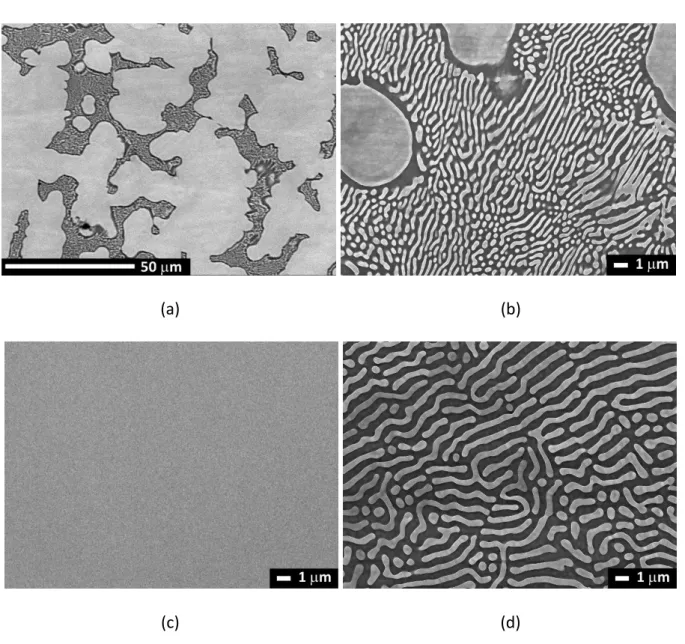
Figure 2 presents the SEM backscattered electron (BSE) images of the 4.1at%Mg,
Cu-8.1at%Mg and Cu-23.1at%Mg alloy compositions in the as-cast condition. The phase with the
lowest mean atomic number (Mg content) appears darkest in the image. The sample
8.1at%Mg consists of rich dendrites surrounded by a lamellar structure of alternating
Cu-rich (bright) and Mg-Cu-rich (dark) phases. The interlamellar spacing is about 0.8 m and the size of the dendrites is about 23 m. EPMA indicates that the mean composition of the dendrites is 4.3 at.% Mg, the bright lamella is 7.7 at.% Mg, and the dark lamella is 31.5 at.% Mg. The
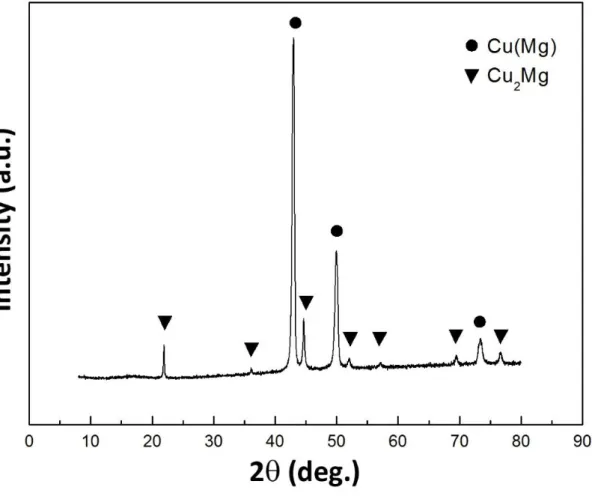
analysis of the XRD spectra shown in the Figure 3 indicates that the microstructure is
composed by a solid solution of fcc-Cu(Mg) and the intermetallic compound Cu2Mg.
The samples Cu-4.1at%Mg consists of the single-phase fcc-Cu(Mg) solid solution having the
nominal composition of the alloy. The microstructure of the Cu-23.1at%Mg is composed of a
fully lamellar aggregates of alternating fcc-Cu(Mg) with composition 7.7at% Mg and Cu2Mg
phases with a constant lamellar spacing of about 1 m. The measured compositions of the lamellae in the eutectic aggregates are reported in the Figure 1 (see black circle).
Both these latter and the formation of a lamellar pattern typical of an eutectic transformation
confirm the phase fields, the invariant reaction and the solubility limits of the calculated
Cu-Mg phase diagram in the Cu-rich side.
Two different morphologies can be distinguished for second phase (here Cu2Mg) particles at
boundary energy of grains in the matrix per unit area is smaller (two times at least) than the
energy per unit of the Cu/Cu2Mg interphase boundary. Otherwise, a layer of Cu2Mg phase
wets continuously the Cu/Cu grain boundary for the reason that the growing Cu2Mg phase
particle tends to increase its surface. Even if the grain boundary wetting has already been
observed in phase transformations such as both the eutectoid and eutectic transformations
[23,24], in our study, we did not observe any particular wetting of Cu2Mg at any grain
boundary (see Figure 2). This situation is radically different from that one observed in a fully
eutectic microstructure in the Zn-Al system [24]. A close examination of the Figure 2 shows
the complete coverage of primary Cu2Mg grain by copper. However, this is a minor and does
not accurately reflect the final microstructure feature. Furthermore, it is worth noting that the
morphology of the Cu2Mg shall be mainly determined by the morphology of Cu that is mainly
lenticular with a large range of aspect ratio. In other words, the resulting microstructure
feature is very similar to that one of pearlite in steels in which lamella of Fe3C is embedded in
-Fe matrix.
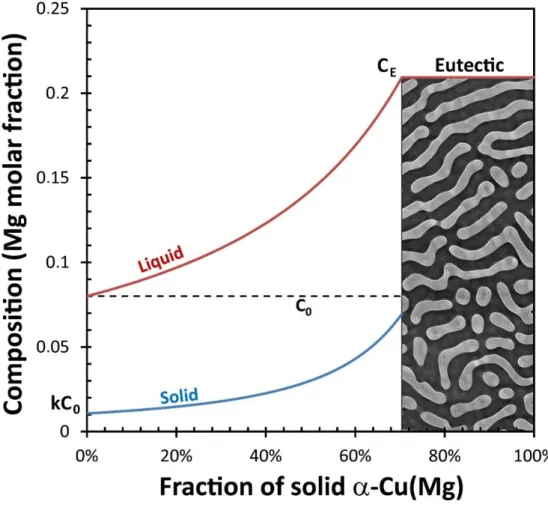
The proportion of the eutectic aggregates evaluated from image analysis of the Cu-8.1at%Mg
alloy is 25 vol.% that is 28 mol.%. which is above the 8 mol.% calculated under equilibrium
condition (lever rule). This difference may arise from a kinetics effect. Indeed, the composition
of the solid as a function of the fraction of the solid is given by the scheil-Gulliver equation :
𝐶𝑠 = 𝑘𝐶0(1 − 𝑓𝑠)𝑘−1, where 𝐶
𝑠 is the composition of the solid, C0 is the nominal composition,
𝑘 is the partition coefficient (𝑘 = 𝐶𝑠⁄ , with 𝐶𝐶𝑙 𝑙 the liquid composition) and 𝑓𝑠 is the fraction
of the solid.
Figure 4 shows the calculated composition changes as a function of the fraction of solid: as
the amount of solid increases during solidification, the Mg concentration of the liquid
The fraction of the eutectic aggregates can be obtained when the composition of the liquid is
equal to the eutectic composition (0.21 at fraction). The Figure 4 shows that this situation
happens when the fraction of the eutectic phase is about 30 mol.%. This latter is in very good
agreement with the experimentally determined one (28 mol.%).
The analysis performed by Electron Probe MicroAnalyser given in Figure 5 evidences a
gradient of Mg composition around the eutectic islands. The Mg content being much higher
close to the interface between eutectic islands and Cu than in the bulk (6.9 at% vs 3.1at %).
Since the amount of Mg in the alloy is above the maximum solubility of Mg in Cu, it can be
reasonably supposed that precipitation of a second phase occurs during cooling. In order to
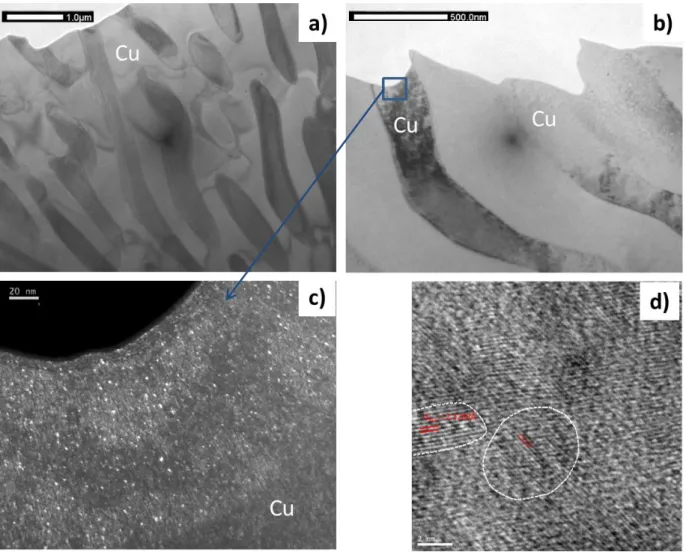
check this assumption, some analysis by TEM were performed on the Cu-23.1at%Mg alloy.
The results given in Figure 6 evidence the presence of nanoparticles in Cu. The TEM images
show a high density of particles having a very small mean size (around 5nm to 15nm). The
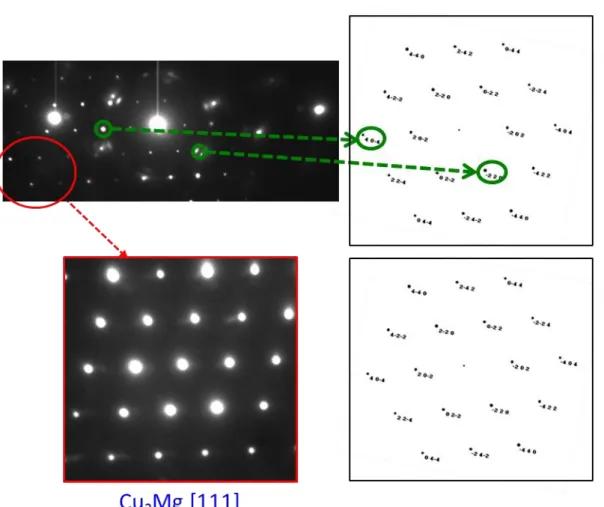
comparison between the obtained Selected Area Electron Diffraction pattern (Figure 7) of a
zone located in copper lamellar and some simulated diffraction pattern of Cu2Mg along
various zone axis, would indicate that precipitates correspond to Cu2Mg. This high density of
particles observed in our samples can be explained by the enhancement of the driving force
for Cu2Mg nucleation close to the interface resulting to a higher Mg content as observed in
Figure 5.
Figure 8 shows the bubble chart (Ashby’s diagram) of yield strength and electrical conductivity
for the alloys prepared in this study in comparison with the main Cu-based alloys. It is
observed that the addition of Mg to Cu leads to a decrease of its electrical conductivity and an
increase of its yield strength. The importance of this effect depends on the amount of Mg and
then on the resulting microstructure. One can see that the present Cu-Mg alloys occupy the
combination of properties. It is also noticeable that the Cu-23.1at%Mg alloy exhibit an
exceptionally high yield strength combined with a good electrical conductivity.
The decrease of the electrical conductivity of copper with the addition of Mg is due to the
scattering of electrons. Mg solute atoms act as scattering centers, when their number
increases the electron mean free path decreases. The effect is very significant between pure
copper and the Cu-4.1at%Mg alloy since all the Mg added goes into solid solution. For
compositions above the solubility limit, the additional amount of Mg is removed from the
liquid to form the Cu2Mg compound. This explains why there is only a slight decrease of the
electrical conductivity from 4.1 to 23.1 at% Mg.
In order to explain this high value of the yield strength, we have adapted a mechanical model
initially developed to describe the mechanical behavior of perlite, an eutectoid microstructure
composed by lamella of Fe3C [25]. Indeed, a parallel can be drawn between the microstructure
of the present copper alloy in which grains of fcc-Cu(Mg) and lamellar eutectic aggregates
replace the ferrite and the pearlite in low carbon steels. From this model it is possible to
account the hardening contribution that arise from:
the solid solution, it depends on the amount of Mg solute into the copper grains,
the grain boundaries, this is the so-called Hall-Petch hardening being inversely proportional to the square root of the grain size,
the eutectic aggregates leading to hardening by composite effect, it is related to the interlamellar spacing and the volume fraction of the eutectic structure.
For the Cu-4.1at%Mg alloy, which consists of a single-phase solid solution with grain size of 23
m, the evolution of the flow stress 𝜎𝐶𝑢 as a function of the strain 𝜀𝐶𝑢 is expressed as follows
𝜎𝐶𝑢(𝜀𝐶𝑢) = 𝜎0𝐶𝑢+𝛼µ𝑀√𝑏
√𝑑 √
1 − exp (−𝑓𝑀𝜀𝐶𝑢)
𝑓
with a constant equals to 0.4, M the Taylor factor (M = 3), the shear modulus of copper ( = 46 GPa), b the Burger’s vector (b = 0.255 nm) and d the mean copper grain size (d = 23 m).
f is an adjustable parameter taken from [25]. σ0Cu is the summation of the intrinsic lattice
resistance, a value of 40 MPa is used (pure copper) [2], and the solid solution strengthening
effect that arises from the addition of Mg atoms in the Cu lattice. This effect is proportional
to the amount of solute and can be evaluated as CXss, where Xss is the mole fraction of Mg in
solid solution and C = 49 MPa/X to reproduce the measured value of the yield strength for the
Cu-4.1at%Mg (Fig. 9). We can conclude from this result that the contribution arising from Mg
solute atoms is the dominant hardening mode in the single phase Cu-4.1at%Mg alloys.
The increase of the amount of Mg solutes leads to the formation of lamellar aggregates in the
Cu-8.1at%Mg alloy due to the eutectic transformation. The law to describe the strengthening
effect of the lamellar pattern is expressed as follows [25]:
𝜎𝑒𝑢𝑡(𝜀𝑒𝑢𝑡) = 𝜎0𝑒𝑢𝑡+ µ𝑀𝑏 𝑆 + 𝐾 𝑔(1 − exp (− 𝑔𝜀𝑒𝑢𝑡 2 ))
Where K and g are two empirical constants taken from Ref.19, and S is the interlamellar
spacing (S = 0.8 m), and 𝜎0𝑒𝑢𝑡 is the critical stress due to the lattice friction in the copper
lamellae of the eutectic aggregates. From the measured Mg concentration in the copper
lamella and the value of C (proportionality coefficient for the solid solution strengthening
effect) determined from the analysis of the Cu-4.1at%Mg alloy, the numerical value of 𝜎0𝑒𝑢𝑡 is
418 MPa.
As shown in Figure 9, the summation of the different strengthening contributions arising from
aggregates leads to a value of about 330 MPa which is below the measured yield strength (459
MPa) for the Cu-8.1at%Mg alloy. The same trend is observed for the Cu-23.1at%Mg alloy
which consists of 100% of eutectic aggregates. The gap between the calculated and measured
values, 524 and 1024 MPa respectively, is even higher, and can be attributed to the
distribution of precipitates as seen in the TEM dark field image in Figure 6. Indeed, it is well
known that particles can have an attractive interaction with dislocation and act to pin the
dislocation, giving rise to a strengthening effect. In order to evaluate the possible contribution
to the strengthening provided by precipitates, one can calculate the mean particle spacing in
the slip plane, , leading to a stress increment of 500 MPa by considering the bowing of dislocations between precipitates:
𝜆 ≈ 0.8𝑀 𝜇𝑏 𝜏𝑂𝑟𝑜𝑤𝑎𝑛
where M is the Taylor Factor (M=3), is the shear modulus of copper ( GPa) and b is the Burgers vector (b=0.25 nm). The determined mean particle spacing is about of 50nm. This value, qualitatively consistent with our TEM observations (Figure 6), requires a high density of
nanoparticles in Cu matrix.
5. Conclusion
Some novel high conductivity – high strength materials were designed in the binary Cu-Mg.
They exhibit an excellent balance between strength and electrical properties. An increase of
significant deterioration of the electrical conductivity. This unexpected behavior is attributed
to the formation of eutectic islands Cu2Mg/Cu in which high density of Cu2Mg nanoparticles
precipitate during cooling. The design material is a good alternative to the Cu-Be system which
has the disadvantage of toxicity.
The microstructure designed in the binary Cu-Mg exhibits both a high conductivity and high
strength. These properties were obtained from a classical process. The High Pressure Torsion
technic would opens up new opportunities. Indeed, as nicely shown by [26] it could be thus
possible to control the precipitation state including the size of particle and the composition of
the matrix by acting on the rotation angle. The latter control the properties of both strengthening
and electrical properties.
Acknowledgements
Figure 1: Binary phase diagram of the Cu-Mg system calculated using ThermoCalc and the
thermodynamic evaluation of Coughanowr et al. [14]. The open circles indicate the measured
(a) (b)
(c) (d)
Figure 2: SEM micrographs of (a) the as-cast Cu-8.1at%Mg alloy, (b) a zoom of the eutectic
aggregates, (c) the Cu-4.1at%Mg alloy, and (d) the Cu-23.1at% alloy. The -Cu(Mg) solid solution and Cu2Mg appear in light and dark gray, respectively.
Figure 3: XRD spectra corresponding to the microstructural state shown in Fig.2a for the
Figure 4: Solute profile according the Scheil-Gulliver equation. When the solid begins to form,
the solute (Mg) is rejected into the liquid phase ahead of the solid/liquid interface. Since it is
redistributed into the liquid only by diffusion, there is an accumulation of this solute in the
liquid until the eutectic composition CE is reached, leading to the formation of a lamellar
Figure 5: Analysis of the Mg content in the Cu-8.1 at%Mg by Electron Probe Micro Analyser.
The Mg content is heterogeneous in Copper. It is much more higher close to the interface
Figure 6: a) TEM images of the fully eutectic microstructure (Cu-23.1at%Mg), b) Bright field
and associated c) dark field inside the copper matrix. Both the dark field (c) and the HRTEM
image (d) show the presence of high density of nanoparticles in copper identified as Cu2Mg.
Figure 7: Comparison between the obtained Selected Area Electron Diffraction and the
microdiffraction pattern of Cu2Mg along different zone axis. These results would indicate that
Figure 8: Logarithmic plot of the yield strength vs. electrical conductivity for copper based
alloys according [2] and the casted Cu-4.1at%Mg, Cu-8.1at%Mg and Cu-23.1at%Mg alloys
from the present work. The best choices for high strength and high conductivity are Cu-Be
Figure 9: Calculated strengthening contributions for the casted Cu-Mg alloys: Cu-4.1at%Mg is
a single-phase fcc-Cu(Mg) solid solution, Cu-8.1at%Mg is composed of fcc-Cu(Mg) and eutectic
References
1 - Copper Applications Technology Roadmap, International Copper Association, March
2011.
2 - CES Edupack 2013 database (software), Granta Design Ltd, Cambridge, UK.
3 - N. Takata, Y. Ohtake, K. Kita, K. Kitagawab and N. Tsuji, Scripta Mater. 60 (2009) 590.
4 - R. K. Islamgaliev,1,a) K. M. Nesterov,1 J. Bourgon,2 Y. Champion,2 and R. Z. Valiev, J. Appl.
Phys. 115 (2014) 194301.
5 - A. Chbihi, X. Sauvage, D. Blavette, Acta Mater. 60 (2012) 4575.
6 - K. S. Raju, V. S. Sarma, A. Kauffmann, Z. Hegeduse, J. Gubicza, M. Peterlechner, J.
Freudenberger, G. Wilde, Acta Mater. 61 (2013) 228.
7 - Y. Zeng, S. Mu, P. Wu, K.P. Ong, and J. Zhang, J. Alloys Compd., 478 (2009) 345.
8 - O. Dahl, Siemens-Konzern 6 (1927) 222.
9 - H. Böhm, Z. Metallkd. 52 (1961) 564.
10 - H. Tsubakino and R. Nozato, J. Mater. Sci. 19 (1984) 3013.
11 - K.-I. Nishikawa, S. Semboshi, and T. J. Konno, Solid State Phenomena 127 (2007) 103.
12 - PJ Fehrenbach, HW Kerr, and P Niessen, J. Cryst. Growth, 18 (1973) 151.
13 - R.S Fidler, M.N Croker, and R.W Smith, J. Cryst. Growth, 13-14 (1972) 739.
14 - C. Coughanowr, I. Ansara, R. Luoma, M. Hämäläinen, H.L. Lukas, Z. Metallkd. 82
(1991) 574.
15 - T. Buhler, S.G. Fries, and P.J. Spencer, J. Phase Equilibria 19 (1998) 317.
16 - S. Gorsse and G.J. Shiflet, Calphad 26 (2002) 63.
17 - A.L. Norbury, Trans. Faraday Soc. 16 (1921) 570.
18 - G.T. Meaden, Electrical resistance of metals, Plenum Press, New York, 1965 (Chapter 5).
19 - F. Seitz, The Modern Theory of Solids (McGraw-Hill, New York, 1940).
20 - J.S. Galsin, Kluwer/Plenum Publishers, New York, 2002, 109.
21 - P. Dordor, E. Marquestaut, C. Salducci, P. Hagenmuller, Rev. Phys. Appl. 20 (1985) 795.
22 - Y. Champion and Y. Bréchet, Adv. Eng. Mater. 12 (2010) 798.
23 - J.W. Christian, The theory of transformations in metals and alloys, Oxford: Pergamon
Press, 1975, 452.
24 - G.A. Lopez, E. J. Mittemeijer, BB. Straumal, Acta Mater. 52 (2004) 4537.
25 - S. Allain and O. Bouaziz, Mater. Sci. Eng. A 496 (2008) 329.
26 - B.B. Straumal, A. R. Kilmametov, Y. Ivanisenko, L. Kurmanaeva, B. Baretzky, Y. O.

![Figure 8: Logarithmic plot of the yield strength vs. electrical conductivity for copper based alloys according [2] and the casted Cu-4.1at%Mg, Cu-8.1at%Mg and Cu-23.1at%Mg alloys from the present work](https://thumb-eu.123doks.com/thumbv2/123doknet/14257276.488884/20.892.120.781.114.670/figure-logarithmic-strength-electrical-conductivity-copper-according-present.webp)

