OATAO is an open access repository that collects the work of Toulouse
researchers and makes it freely available over the web where possible
Any correspondence concerning this service should be sent
to the repository administrator:
[email protected]
This is an author’s version published in:
http://oatao.univ-toulouse.fr/26624
To cite this version: Denand, B. and Esin, V.A. and Dehmas, M.
and Geandier, G. and Denis, S. and Sourmail, T. and Aeby-Gautier,
E. Carbon content evolution in austenite during austenitization
studied by in situ synchrotron X-ray diffraction of a hypoeutectoid
steel. (2020) Materialia, 10. 100664. ISSN 25891529
Carbon
content
evolution
in
austenite
during
austenitization
studied
by
in
situ
synchrotron
X-ray
diffraction
of
a
hypoeutectoid
steel
B.
Denand
a,c,∗,
V.A.
Esin
b,
M.
Dehmas
d,
G.
Geandier
a,c,
S.
Denis
a,c,
T.
Sourmail
e,
E. Aeby-Gautier
a,ca Institut Jean Lamour, UMR7198 CNRS, Université de Lorraine, Nancy, France
b MINES ParisTech, PSL University, Centre des Matériaux (CMAT), UMR 7633 CNRS, Evry, France
c Laboratory of Excellence for Design of Alloy Metals for Low-mass Structures (‘DAMAS’ Labex), Université de Lorraine, France d CIRIMAT, Université de Toulouse, CNRS, Toulouse, France
e Ascometal-CREAS (Research Centre), Hagondange, France
a r t i c l e
i n f o
Keywords:
Austenitization
In situ synchrotron X-ray diffraction Lattice parameter
Carbon content Thermo-Calc
a b s t r a c t
UsinginsituhighenergyX-raydiffractionstudyofausteniteformationinhypoeutectoidsteelwiththree differ-entinitialmicrostructures(ferrite-pearlite,temperedmartensiteandbainite),thelatticeparametersofferrite, cementiteandausteniteareexaminedonheatingat0.25,10and100°C/s.
Thelatticeparametersofferrite,cementiteandaustenitedonotvarylinearlywiththetemperature,especially, inthetemperaturerangewheretheaustenitizationtakesplace.Fortheaustenite,itissuggestedthatthedeviation fromthelinearityismainlyassociatedtothecarboncontentvariation.UsingDysonandHolmesequation,the carboncontentinausteniteisevaluatedforanymomentoftheausteniteformationforeachinitialmicrostructure andallheatingrates.
Fortheferrite-pearlitemicrostructureheatedat0.25°C/s,thecarboncontentinausteniteaftercomplete cementitedissolutioncorrespondstothatofpearlite.Moreover,arapiddecreaseincarboncontentintheaustenite isobservedduringthefirststageoftheaustenitization(simultaneousdissolutionofferriteandcementite)followed byaslowfurtherdecreaseduringthetransformationoftheremainingferrite.Theobtainedresultsarediscussed usingthermodynamiccalculations.
1. Introduction
The service life of crankshafts for automotive industry can be in- creased by surface hardening via an induction heat treatment [ 1, 2]. Such a local heat treatment leads to a formation of austenite close to the surface which further transforms into martensite upon subsequent quenching. Therefore, the resulting surface layer has a higher hardness in comparison with that of the bulk. In addition, retained compressive stresses are generated in the surface layer (mainly due to the martensitic transformation in that area), optimal for the properties of crankshafts use [3].
The required heat treatment should be fast enough to limit the vol- ume of the material transformed into austenite (close to the surface) on heating. Typical heating rates vary from 30 to over 100 °C/s. In these conditions, the initial microstructure of the steel may affect the austeni- tization kinetics due to differences in interface migration and interstitial and substitutional elements redistribution in different microstructures. Even for a fully austenitic layer, the chemical composition may present local heterogeneities due to initial microstructure features leading thus
to local differences in final microstructure with different local mechani- cal properties. It is worth noting, that most of investigations reported in literature have been carried out on the austenitization of steels with ini- tial ferrite-pearlite microstructure [4–14]. The analysis of austenite for- mation for the same steel having different initial microstructures and for different heating rates is of technological and fundamental importance. In this scope, our previous study reported on the kinetics of austen- ite formation considering three initial microstructures (ferrite-pearlite, tempered martensite and bainite) of the same hypoeutectoid steel and five heating rates (0.25, 1, 10, 60 and 100 °C/s) [15]. The use of High Energy synchrotron X-Ray Diffraction (HE-XRD) [16]allowed to char- acterize the phase fraction evolution of all phases and highlighted two steps in the austenite formation [15]: (i) the simultaneous transforma- tion of ferrite and cementite into austenite, and (ii) the transformation of the remaining ferrite into austenite. For a given heating rate, the kinetics of each step was shown to be dependent on the initial microstructure.
In addition to the nature and amount of phases formed, the Rietveld refinement of diffraction patterns gives also information about the lat- tice parameters and widths of diffractions peaks for different phases for
∗Correspondingauthorat:InstitutJeanLamour,Université deLorraine,CNRS,UMR7198,54011NancyCedex,France. https://doi.org/10.1016/j.mtla.2020.100664
Table1
Chemicalcomposition(wt.%)ofthe37MnCr4-3steelused.
Fe C Si Mn S Ni Cr V Mo Cu Al
Bal. 0.356 0.253 1.285 0.024 0.208 0.652 0.005 0.065 0.172 0.018
any moment during heating and the austenite formation. To get insight into the transformation features, the present paper focuses on the evo- lution of lattice parameters of austenite, ferrite and cementite to be able to estimate the carbon content evolutions in the phases.
It is worth noting that a recent study attempted to analyze the evolution of austenite lattice parameter during austenitization of the same 50CrMo4 steel having ferrite-pearlite and soft annealed initial mi- crostructures close to equilibrium state [14]. In situ HE-XRD was used on heating with the rates of 1, 10 and 100 °C/s. A decrease in austenite lattice parameter was observed at the beginning of the austenite for- mation until a minimum value followed by further linear increase with temperature. Such a change in austenite lattice parameter was quali- tatively attributed to the evolution of austenite chemical composition. However, any attempt was not done to quantify austenite carbon con- tent or lattice parameter evolution of ferrite cementite and austenite, and only possible explanations were given.
In the present work an accurate analysis of X-ray data is carried out using Rietveld refinement. Different assumptions concerning the evolu- tion of lattice parameters of ferrite, cementite and austenite are care- fully analyzed to be able to obtain the austenite carbon content at any moment of the transformation for different heating rates. Besides, non- equilibrium tempered martensite and bainite microstructures are inves- tigated together with ferrite-pearlite initial microstructure.
2. Material
The steel used in the present work is a 37MnCr4-3, which was man- ufactured by Ascometal CREAS. The chemical composition was charac- terized on forged bars using optical emission spectrometry and combus- tion (LECO) analysis for accurate measurements of carbon and sulphur contents ( Table1). The steel was made available as hot forged bars of approximate diameter 40 mm. Details of the fabrication process have already been reported in [15].
To produce different initial microstructures, the forged bars were austenitized at 850 °C for 1 h and further subjected to different heat treatments. These thermal treatments have already been detailed in
[15], but will nevertheless be summarized for ease of legibility. To ob- tain ferrite-pearlite initial microstructure, the steel was air cooled from austenitizing temperature down to 625 °C and held at this temperature for 1 h. The tempered martensite required oil quenching at room tem- perature from austenite domain followed by a tempering at 500 °C dur- ing 1 h. The bainite microstructure was obtained during an isothermal soaking in a salt bath at 450 °C during 30 min after austenitizing.
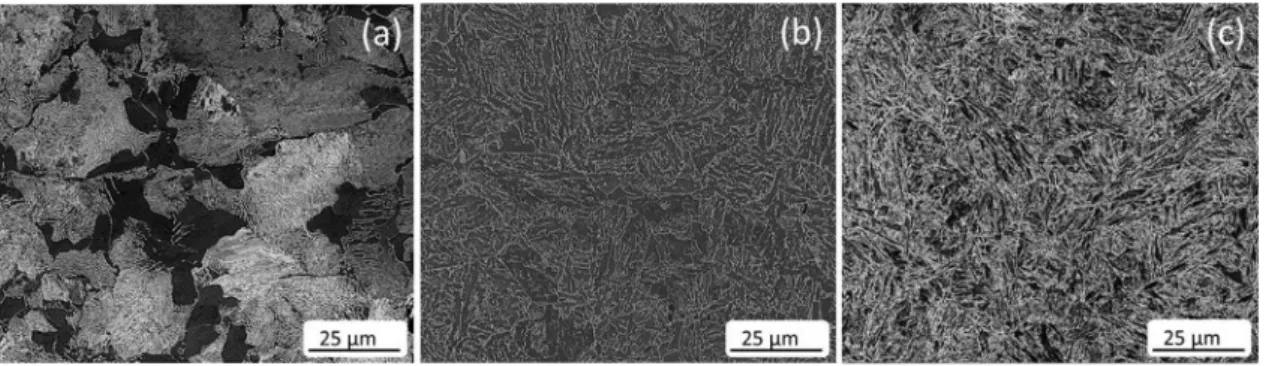
The samples used in this study were taken at the mid radius of the bars for each initial microstructure in order to avoid decarburization phenomenon at the surface of these bars. These initial microstructures obtained by Scanning Electron Microscopy (SEM) are presented in Fig.1.
Fig.1(a) shows the initial ferrite-pearlite microstructure where black regions are the free ferrite and grey regions are the pearlite. Volume frac- tion of ferrite and pearlite can be determined by image analysis based on contrast threshold. The mean phase fraction obtained for the free ferrite is 20% and that for the pearlite is 80%. The intercepts method allowed us to estimate the size of mean pro-eutectoid ferrite grains to be of 10 μm. For the initial tempered martensite and bainite microstruc- tures ( Fig.1(b) and (c)), it was not possible to distinguish the different phases by SEM.
HE-XRD analysis revealed the presence of about 2–3 wt.% of cemen- tite for the three initial microstructures and 3 wt.% of retained austenite in the bainitic microstructure.
3. Experimentaltechniques
Experiments were carried out at the Deutsches Elektronen- Synchrotron (DESY, Hamburg, Germany) on the beamline P07 of PE- TRAIII. A DIL805 A/D dilatometer from TA Instrument was used to ap- ply the thermal treatments. Three linear heating rates (0.25, 10 and 100 °C/s) were imposed until 900 °C followed by gas quenching.
The samples were hollow cylinders of 10 mm length whose the ex- ternal diameter was 4 mm and the thickness was 0.5 mm in order to reduce radial thermal gradient.
Induction heating was employed during the experiments and the temperature was controlled using S-type thermocouple centrally welded at the surface of the hollow cylinder. In order to have a good correla- tion between the temperature acquisition and the Debye-Sherrer rings recorded during the thermal treatment, the X-ray beam crossed the sam- ple in the area close to thermocouple. The Debye-Scherrer rings were ob- tained by using a monochromatic beam of 100 keV and 2D image plate detector situated at about 1.5 m away from the sample. A preliminary calibration with CeO 2powder was carried out to determine the values
required for further X-ray data analysis such as the distance between the sample and the detector or the wavelength which was 0.123984 Å in this case. The beam size of 1.0 ×1.0 mm 2allowed getting a reasonably good
resolution and fast acquisition time for the high heating rates. Indeed, two modes were employed to the diffraction pattern recording: a slow mode with an acquisition time of 3.5 s for the heating rate of 0.25 °C/s and a fast mode with an acquisition time of 0.1 s for the heating rates of 10 and 100 °C/s. For the slow mode, the acquisition time included the shutter opening and closing, the acquisition of external parameter as the temperature, and the data erasing from the detector. In the fast mode, the shutter opened at the beginning of the experiment and closed at the end; any external parameter was not recorded during the acquisition.
The fast mode led thus to an uncertainty in temperature value which can be calculated as Δ𝑇 = ± 0 .1 × 𝑉ℎ, where Vh(°C/s) is the heating rate and 0.1 (s) is the acquisition time in fast mode.
It is worth noting that for the present study three heating rates were selected: 0.25, 10 and 100 °C/s while 1 and 60 °C/s heating rates were used as well in the study on austenitization kinetics in the same steel in
[15].
The Debye-Scherrer rings give information on the sample crystal- lography at any moment during the thermal path. The complete inte- gration of these rings leading to conventional 1-D diffractograms were made using the Fit2D software. Then, the diffractograms were analyzed by Rietveld refinement [ 17, 18] with the FullProf software [19].
The starting structures for the Rietveld analysis consisted of ferrite and cementite for the initial ferrite-pearlite and tempered martensite microstructures, and of ferrite, cementite and austenite for the analysis of the bainitic microstructure. More details concerning the procedure of Retvield refinement can be found in [15]
For each XRD pattern, the following parameters were refined: scale factors, mass fractions, FWHM (full width at half maximum) and lattice parameters.
4. Results
The kinetics of austenite formation as function of initial microstruc- ture and heating rate was reported in details in [15]. We recall here the main results and conclusions required for the further analysis of the lattice parameters evolutions.
B. Denand, V.A. Esin and M. Dehmas et al.
Fig.1. Initial(a)ferrite-pearlite,(b)bainiteand(c)temperedmartensitemicrostructuresoftheinvestigatedsteelasobservedbySEM(standardmetallography preparationand2%Nitaletching).
Table2
Thetemperaturesofthestart(AC1)andend(AC3)ofausteniteformationonheatingaswellasthetemperatureoftheendofthefirststageofausteniteformation
(T1)accordingtothedataobtainedfromHE-XRDexperimentsin[15]fordifferentinitialmicrostructuresandheatingrates.
Heating rate ( °C/s) Ferrite-pearlite Tempered martensite Bainite
A C1 (°C) T 1 (°C) A C3 (°C) A C1 (°C) T 1 (°C) A C3 (°C) A C1 (°C) T 1 (°C) A C3 (°C)
0.25 740 753 790 736 758 774 736 763 770
10 761 792 822 743 763 779 741 769 790
100 781 843 854 753 788 810 743 789 810
Table3
Volumecoefficientofthermalexpansionofcementiteinthetemperaturerangefrom450to600°C,andlinearcoefficientofthermalexpansionofferriteandaustenite inthetemperaturerangewherenotransformationoccurs.
Coefficient of thermal expansion (10 − 6 K − 1 ) Initial microstructure Literature data Ferrite – pearlite Bainite Tempered martensite
Volume, cementite 54 56 54 46 [25] , 58 [26]
Linear, ferrite 16.4 16.2 16.1 14–16 [ 20 , 21 ], 16.3 [23] , 16.8 pure iron [23] , 16 [25] Linear, austenite 24.7 24.9 24.4 20–23 [20] , 24 [21]
The temperature range of austenite formation on heating for differ- ent conditions is given in Table2. In order to obtain a good confidence on these temperatures, the start of austenitization (A C1) is taken for a
mass fraction of 3% of austenite created and the ferrite dissolution is considered as completed (A C3) for 95% of austenite formation.
The data reported in Table2clearly evidence that the transforma- tion kinetics is depending on the initial microstructure, mainly the size of the different microstructure constituents [15]. The phase fraction evo- lutions show two stages in the kinetics of austenite formation. The first one corresponds to the simultaneous dissolution of ferrite and cemen- tite; the second one to the dissolution of the remaining ferrite. The tem- perature of the end of the first stage (T 1) is recalled in Table2. This
temperature is dependent on the initial microstructure and heating rate and its variation was attributed to different size of cementite particles in different initial microstructures [15].
Together with phase fractions, the results of Rietveld refinement in- form about evolution of the mean lattice parameters of ferrite, cementite and austenite. Those are further analyzed and discussed considering the different origins of lattice parameter evolution: the temperature varia- tion, the elastic strains and/or the variation of chemical composition of different phases during austenitization.
4.1. Meanlatticeparametersonheating
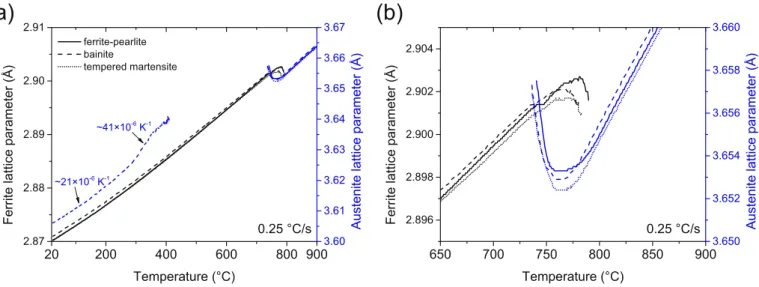
The variation of mean lattice parameters of ferrite and austenite dur- ing heating with a rate of 0.25 °C/s is given in Fig.2for the three initial microstructures. For cementite, the change in unit cell volume on heat- ing is reported in Fig.3for the same conditions. The values of apparent coefficients of thermal expansion, obtained in the temperature ranges
where no transformation occurred, are summarized in Table3for all phases. 1
For the ferrite-pearlite and tempered martensite initial microstruc- tures that contain a mixture of ferrite and cementite, the mean lattice parameter of ferrite increases linearly with temperature up to 735 °C. Between 735 °C and around 760 °C, in the first stage of the austenite formation, the mean lattice parameter of ferrite slightly deviates from the linear behavior, with a decrease in the apparent Coefficient of Ther- mal Expansion (CTE). Above 760 °C ( Fig.2(b)), in the second stage of the transformation, the lattice parameter of ferrite decreases with a neg- ative apparent CTE. For both ferrite-pearlite and tempered martensite microstructures, the unit cell volume of cementite increases with in- creasing temperature: a linear behavior is only observed between 450 and 735 °C ( Fig.3). Above 735 °C where cementite dissolution occurs, a decrease in the unit cell volume of cementite is observed. For the bai- nite microstructure, the initial state contains a mixture of three phases (ferrite, cementite and retained austenite). During the heating between 240 and 410 °C, the transformation of retained austenite into ferrite and cementite occurs. Between 410 and 735 °C, the amount of ferrite and cementite remains constant. Nevertheless, the mean lattice parameters of ferrite and cementite have almost a similar evolution than the one obtained for ferrite-pearlite and tempered martensite microstructures.
1Thevolumethermalexpansioncoefficientsofcementiteweremeasuredin
thetemperaturerange450–600°Cfortworeasons:(i)thesestemperaturesare higherthancementiteCurietemperature(Tc≈227°C)[20](magnetictransition
hasasignificanteffectonthethermalexpansioncoefficientinatemperature rangeofabout200°CaroundTc);(ii)fortheinitialbainitemicrostructuresome
transformationoftheretainedausteniteoccurredfortemperatureslowerthan 450°Candmayaffecttheapparentthermalcoefficientofcementite.
Fig.2. Meanlatticeparametersofferriteandausteniteonheatingwithaheatingrateof0.25°C/sforinitialmicrostructuresofferrite-perlite(solid),bainite(dashed) andtemperedmartensite(dotted):(a)before,duringandafteraustenitizationand(b)zoomtothetemperaturerangewheretheausteniteformationoccurs.
Fig.3. Unitcellvolumeofcementitebeforeandduringaustenitizationwitha heatingrateof0.25°C/sforinitialmicrostructuresofferrite-pearlite(blue), bai-nite(red)andtemperedmartensite(black).(Forinterpretationofthereferences tocolorinthisfigurelegend,thereaderisreferredtothewebversionofthis article.)
For the evolution of austenite lattice parameter, two temperature ranges should be distinguished: (i) above 730 °C where a mixture of ferrite and cementite transforms into austenite (ferrite-pearlite, tem- pered martensite and bainite microstructures), and (ii) between 240 and 410 °C where retained austenite transforms into ferrite and cementite (bainite microstructure only).
A complex non-linear evolution of austenite lattice parameter with temperature is observed during the ferrite + cementite →austenite trans- formation whatever the initial microstructure ( Fig.2(b)). A significant decrease in austenite lattice parameter is observed between 735 and 760 °C, during the first stage of the transformation. Above 760 °C, dur- ing the second stage of the transformation, the austenite lattice param- eter increases. The CTE of austenite increases until reaching a constant value of 25 ×10 −6K −1once the transformation is completed.
For initial bainitic microstructure, the CTE of retained austenite ob- tained between room temperature and 240 °C is equal to 21 ×10 −6K −1
which is lower than the CTE measured after complete austenitization, could indicate that the retained austenite is under a compressive stress
state [27]. Above 240 °C, the apparent CTE increases up to 41 ×10 −6K −1
where the retained austenite transforms into ferrite and cementite. In the temperature ranges where no transformation occurred, the coefficients of thermal expansion obtained for the ferrite, cementite and austenite are in good agreement with those found in literature ( Table3,
[20–26]).
A similar evolution of ferrite, cementite and austenite lattice parame- ters with temperature was observed for heating rates of 10 and 100 °C/s for the different initial microstructures as illustrated for ferrite-pearlite microstructure in Fig.4.
The complex variations of mean lattice parameters of each phase can be due to several factors: change in temperature (thermal expansion), elastic strain and change in chemical composition. As the temperature was measured all along the experiment and thermal gradients were neg- ligible, those variations can be further analyzed subtracting the thermal contribution using the data reported in Table3.
4.2. Ferriteandcementitelatticeparametersbeforethe ferrite + cementite→ austenitetransformation
First, the mean lattice parameter of ferrite obtained on heating for the three initial microstructures is compared with that of pure iron, heated on the same apparatus and in the same conditions ( Fig. 5). The absolute values of ferrite lattice parameter for the three initial mi- crostructures are slightly different and are slightly lower as compared to the lattice parameter of ferrite in pure iron. Those differences can be attributed to differences in chemical composition of the ferrite as well as to internal stresses.
The differences in CTE of ferrite in comparison with pure iron are within 3.6% above 450 °C (16.4 × 10 −6 K −1 in ferrite-pearlite
microstructure, 16.2 × 10 −6 K −1 in the tempered martensite and
16.1 ×10 −6K −1in the bainite, Fig.5).
Comparing cementite at room temperature in three initial mi- crostructures and a pure cementite powder [ 28, 29], the mean lattice parameters are quite similar (the differences are within 1%, Table4). Moreover, in the temperature range between 200 and 327 °C, the vol- ume CTE of cementite reported in [28]is close to 42 ×10 −6K −1, which
is in good agreement with the CTE of cementite obtained for the three initial microstructures in the same temperature range: 42 ×10 −6K −1for
tempered martensite and lower than 48 ×10 −6K −1for ferrite-pearlite
microstructure. For the temperature range from 450 to 600 °C, the ob- tained volume CTE of cementite ( Table3) is in good agreement with literature data.
B. Denand, V.A. Esin and M. Dehmas et al.
Fig.4. Ferrite(black)andaustenite(blue)latticeparametersand cementiteunitcellvolume(green)asfunctionoftemperaturein ini-tialferrite-pearlitemicrostructureonheatingwithdifferentheating rates.(Forinterpretationofthereferencestocolorinthisfigure leg-end,thereaderisreferredtothewebversionofthisarticle.)
Fig.5. Comparisonofferritemeanlatticeparameterbeforeausteniteformation forthethreeinitialmicrostructuresandforthepureironobtainedonheating witharateof0.25°C/s.InsettablegivesCTEobtainedfromtheexperimental curvesforthetemperaturesbetween450°CandAC1.
Table4
Meanlatticeparametersofcementiteatroomtemperaturefordifferentinitial microstructuresofa37MnCr4-3steelincomparisonwiththoseforpure cemen-titepowder[28,29]. Microstructure a (Å) b (Å) c (Å) Ferrite-pearlite 5.0858 6.7374 4.5292 Bainite 5.0860 6.7420 4.5301 Tempered martensite 5.0709 6.7295 4.5484 Cementite powder [28] 5.0809 6.7530 4.5150 Cementite powder [29] 5.0901 6.7456 4.5262
4.3. Meanlatticeparametersduringtheferrite+ cementite→ austenite
transformation
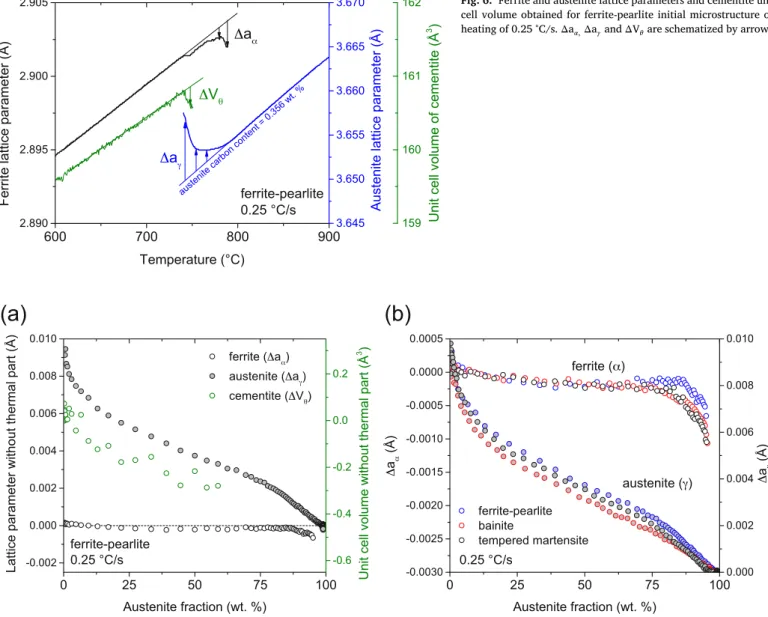
In order to analyze the lattice parameter evolutions in the transfor- mation temperature range without the thermal contribution, the param- eters Δa 𝛼,Δa 𝛾and ΔV 𝜃 were defined as follows: for each phase, the con- tribution due to thermal expansion alone was extrapolated from temper- ature regions where this phenomenon was sole active or predominant, the difference was then calculated between actual measurement and thermal contribution alone. This is schematically illustrated in Fig.6.
This was done assuming a constant linear CTE for ferrite and constant volume CTE for cementite given in Table3.
For austenite, the variations of lattice parameter were calculated tak- ing austenite in the single austenite domain as a reference. This is also illustrated in Fig.6, where the extrapolated changes in austenite pa- rameters are shown as a tangent line to the measurements for the high temperature, austenite domain.
The resulting variations of Δa 𝛾, Δa 𝛼 and ΔV 𝜃 are plotted versus austenite weight fraction in Fig.7(a) for ferrite-pearlite microstructure and in Fig.7(b) for all three initial microstructures ( Δa 𝛾and Δa 𝛼only). Δa 𝛼slightly decreases at the beginning of the austenite formation and remains nearly constant and equal to − 1.5 ×10 −4Å between 20
and 85 wt.% of austenite. A drop to -1 ×10 −3Å is observed between 85
and 100 wt.% of austenite, whatever the initial microstructure. The Δa 𝛾 variations are opposite in sign to those of ferrite, and ten times larger. Δa 𝛾presents the highest value at the beginning of the trans- formation (0.01 Å) and then decreases as austenite amount increases to reach 0 Å once the transformation is completed whatever the initial microstructure. The decrease is larger at the beginning of the trans- formation. ΔV 𝜃 decreases continuously with transformation progress. The maximal value is near − 0.28 Å3corresponding to a relative volume
change of 5.2 10 −3.
The decrease in the mean lattice parameter of ferrite and cementite during the transformation, which is small but significant can be associ- ated with the development of compressive stresses [30]or with a change in its chemical composition.
Since the austenite has a low yield stress in the temperature range where the transformation occurs, the changes in its lattice parameters should be mainly associated with chemical composition variation.
4.4. Austenitechemicalcompositionduringaustenitization
Considering only the solute elements in the studied steel, we used the relation proposed by Dyson and Holmes [31], as done in [32–34], for the lattice parameter of the austenite as a function of chemical composition (in wt.%) at room temperature:
𝑎𝛾 = 3 .5847 + 0 .0330 × [ C ] + 0 .00095 × [ Mn ] − 0 .0002 × [ Ni ]
+ 0 .0006 × [ Cr ] + 0 .0015 × [ Cu ] (1) where 3.5847 Å corresponds to the austenite lattice parameter in the pure iron at room temperature.
Using the composition provided in Table1, the austenite lattice pa- rameter can be calculated to 3.59789 Å. This is 0.01319 Å greater than for pure iron, with a contribution of 0.01175 ˚A due to carbon alone, and of 0.00144 ˚A due to the substitutional elements. Given that the carbon
Fig.6.Ferriteandaustenitelatticeparametersandcementiteunit cellvolumeobtainedforferrite-pearliteinitialmicrostructureon heatingof0.25°C/s.Δa𝛼,Δa𝛾andΔV𝜃areschematizedbyarrows.
Fig.7. Variationsofmeanlatticeparametersofferriteandaustenitewithoutthermalcontribution(Δa𝜶andΔa𝜸,respectively)andunitcellvolumeofcementite
(ΔV𝜽)asafunctionofausteniteweightfractiononheatingof0.25°C/sfor(a)ferrite-pearliteand(b)threeinitialmicrostructures.
influence is therefore 10 times larger than that of the substitutional el- ements, the variations of Δa 𝛾, may be assumed to be mainly related to changes in carbon concentration in austenite ( Δw c𝛾). This is explicited
in Eq.(2):
Δ𝑎𝛾= 𝐴× Δ𝑤𝑐𝛾 (2)
with 𝐴= 0 .033 ∀∕wt .% [31].
Using Eq.(2)and considering that the austenite has the nominal carbon content of the steel, wc0𝛾( Table1), once the austenitization is
completed, the mean carbon content in the austenite ( wc𝛾) can be esti-
mated at any moment of the transformation using the variation of lattice parameter after subtraction of thermal contribution Δa 𝛾:
𝑤𝛾 𝑐=
Δ𝑎𝛾
𝐴 + 𝑤𝑐0𝛾 (3)
The result of such estimation is given in Fig.8for ferrite-pearlite and tempered martensite initial microstructures and for different heat- ing rates.
Whatever the considered initial microstructure and heating rate, a continuous decrease in the mean carbon content in austenite is observed until the end of the austenitization, when the carbon content stabilizes and remains constant during further heating. The carbon content in the
first 3 wt.% of austenite ( “initial ” austenite mean carbon content) is equal to 0.59 wt.% for the initial ferrite-pearlite microstructure and the lowest heating rate of 0.25 °C/s. An increase in the heating rate leads to an increase in A C1temperature and to a decrease in “initial ” mean carbon content in fresh austenite (0.54 wt.% for 10 °C/s and 0.44 wt.% for 100 °C/s). A similar behavior is observed for the initial microstruc- ture of tempered martensite ( Fig.8(b)) with less difference between the “initial ” mean carbon content in austenite for the different heating rates.
Marking the end of cementite dissolution, different stages can be outlined ( Fig.8): a first one with a sharp decrease in carbon content in austenite between the beginning of the transformation and the complete dissolution of cementite and a second one with a smoother decrease cor- responding to the remaining ferrite dissolution. Once the austenitization is completed, the carbon content in austenite remains constant and equal to the mean carbon content of the studied steel.
When the heating rate increases, the cementite dissolution finishes at higher temperatures and the corresponding mean carbon content in austenite decreases since a higher ferrite amount transforms in austenite before complete cementite dissolution [15].
The mean carbon content evolution in austenite during the two stages of the austenitization in the ferrite-pearlite initial microstructure
B. Denand, V.A. Esin and M. Dehmas et al.
Fig.8.Meancarboncontentinausteniteandaustenitefractionversustemperatureduringaustenitizationfordifferentheatingratesandtwoinitialmicrostructures: (a) ferrite-pearliteand(b)temperedmartensite.
Fig.9.Meancarboncontentinausteniteandaustenitefractiononheating dur-ingaustenitizationofinitialbainiticmicrostructurefordifferentheatingrates.
heated at 0.25 °C/s can be further analyzed. From results shown in Fig.8, the carbon content in austenite at the end of pearlite (i.e., cementite) dis- solution is about 0.45 wt.% corresponding to the mean carbon content in the initial pearlite. Indeed, the pearlite fraction estimated by image analysis from images acquired on Scanning Electron Microscope (SEM,
Fig.1(a)) was found to be 80%. Considering that there is no carbon in ferrite, the mean carbon content in pearlite can be roughly estimated as
0.356
0.8 = 0 .445 wt.%, which agrees well with 0.45 wt.% estimated from in
situ experiment as discussed above.
From Fig.8, we conclude that for the lowest heating rate of 0.25 °C/s, the first formed austenite has a higher carbon content (0.59 wt.%) than the mean carbon content in the initial pearlite (0.44 wt.%). As tem- perature and austenite fraction increase, the mean carbon content in austenite decreases until reaching the mean carbon content of the ini- tial pearlite at the end of the first stage of the transformation. During the second stage of the transformation, the dissolution of the remaining 20% of free ferrite with negligible carbon content occurs and the mean carbon content in austenite decreases more smoothly.
In the case of bainitic microstructure, a decrease in mean carbon content in austenite is also observed during the transformation. How- ever, the initial carbon content in austenite increases with the heating rate ( Fig.9). Such a result, different from those obtained for the two
other initial microstructures should be explained using the microstruc- tural differences in different initial states of the studied steel. Indeed, a small amount of retained austenite was found in the initial bainitic microstructure unlike the ferrite-pearlite and the tempered martensite microstrutures. For the heating rate of 0.25 °C/s, the retained austen- ite completely transforms into ferrite and cementite between 240 and 410 °C. For the heating rates of 10 °C/s and 100 °C/s, the retained austen- ite (initial fraction of 3 wt.%) is not completely transformed when reach- ing A C1temperature and the transformed austenite fraction decreases
with increase in heating rate (about 0.7 wt.% at 745 °C for 10 °C/s and 2 wt.% for 100 °C/s). Keeping the assumption that the internal stresses are relaxed in austenite at those temperatures, the higher carbon content in the austenite when reaching A C1temperature for increased heating rate may be related to the carbon enrichment of the retained austenite during the bainitic transformation [35]. A partial transforma- tion of the retained austenite in ferrite and cementite (heating rate of 10 °C/s) could thus lead to a global increase in the carbon content in austenite at the first moment of austenitization (for 3 wt.% of austenite) ( Fig.9). Once the A C1temperature is reached and austenite fraction in-
creases, the mean carbon content in austenite starts to decrease due to ferrite + cementite →austenitetransformation as for the other microstruc- tures.
In addition to the mean carbon content in austenite, its chemical ho- mogeneity can be estimated using the FWHM (full-width height middle) of diffraction peaks recorded during in situ experiments. According to Caglioti’s equation, FWHM varies with the diffraction angle 𝜃[36]: FWHM =
√ (
𝑈 × tan 2( 𝜃)+ 𝑉 × tan ( 𝜃)+ 𝑊) (5)
where U,V,W are the half-width parameters that can be obtained by Rietveld refinement.
First, the diffraction diagrams with the (111) 𝛾and (200) 𝛾peaks are given in Fig.10for three austenite fractions and ferrite-pearlite initial microstructure heated at 0.25 °C/s. They illustrate the larger FWHM at the beginning of the transformation (6 wt.% of austenite).
The FWHM evolution for (111) 𝛾and (200) 𝛾peaks calculated using the Caglioti’s Eq.(5)are plotted versus temperature in Fig.11. 2 For
ease of comparison, the mean carbon content in austenite previously discussed is also reported. A strong continuous decrease in the FWHM of
2 AsthesameevolutionsofFWHMfordifferentmicrostructureswithincrease
inheatingrateswereobserved,Fig.11reportsthedataforthreemicrostructures andthreedifferentheatingrates.
Fig.10. Austenitediffractionpeaks(111)and(200)correspondingto differ-entstagesofausteniteformationonheatingwiththeheatingrateof0.25°C/s ininitialferrite-pearlitemicrostructure:6wt.%(beginning),66wt.%(endof cementitedissolution)andfullyaustenitic(endoftheaustenitization).
(111) 𝛾and (200) 𝛾peaks is observed during the first stage of the austen- ite formation followed by a plateau during the second stage (remaining free ferrite dissolution) and later once austenite formation is completed. An enlargement in diffraction peaks may be due to several factors: small size of diffracting domains, heterogeneities (chemical, internal
stresses, local temperature). The decrease in FWHM can be mainly as- sociated with a homogenization of carbon composition of the austenite because stress and thermal gradient during austenite formation as dis- cussed earlier can be considered negligible. Indeed, gradients in carbon content are present during the transformation. The chemical homoge- nization being controlled by diffusion, is accelerated with temperature. The FWHM of austenite diffraction peaks is thus maximal at the begin- ning of the transformation due to a maximum chemical heterogeneity. Moreover, it is worth noting that the maximum FWHM increases as the heating rates increase suggesting increase in chemical heterogeneities in austenite.
5. Discussion
Since any data for the chemical composition of different phases in different initial microstructures were not available, several assumptions are required for further discussion. Three initial microstructures were obtained at different temperatures and for different durations: 625 °C - 1 h for ferrite-pearlite, 425 °C - 30 min for bainite and 500 °C - 1 h for tempered martensite. These three temperatures and corresponding durations seem to be disadvantageous for a significant diffusion distance of the substitutional elements (Si, Mn, Ni, Cr, Mo and Cu). Indeed, the estimation of the bulk diffusion lengths in austenite for these elements at the highest temperature of 625 °C for 1 h annealing, indicate that it does not exceed 10 nm for the fast diffusing elements like Cr and Mn [37]. However, the cementite in pearlite can be significantly enriched in Mn even though the pearlite formation takes place at low temperatures due to accelerated Mn diffusion along the interfaces [ 38, 39]. Nevertheless,
Fig.11. FWHMof(111)𝛾and(200)𝛾diffractionpeaksofaustenitecomparedtothemeancarboncontentevolutionduringausteniteformationfordifferentinitial microstructuresandheatingrates:(a)ferrite-pearliteat0.25°C/s,(b)bainiteat10°C/s,(c)temperedmartensiteat100°C/s.
B. Denand, V.A. Esin and M. Dehmas et al.
Table5
Austenitestarttemperature(AC1)andmeancarboncontentinausteniteatthebeginningofaustenitization(C0𝛾)(3wt.%offormedaustenite)fordifferentheating
ratesandinitialmicrostructures.
Heating rate (°C/s) Ferrite -pearlite Tempered martensite Bainite
A C1 (°C) C 0 𝛾(wt . %) A C1 (°C) C 0 𝛾(wt . %) A C1 (°C) C 0 𝛾(wt . %)
0.25 740 0.594 736 0.593 736 0.585
10 761 0.543 742 0.586 – –
100 781 0.442 753 0.554 – –
Fig.12. Isoplethphasediagramforthe37MnCr4-3steelforfixedcontentof substitutionalelementsandvaryingcarboncontent(attheexpenseofiron) ob-tainedusingThermo-CalcsoftwareandTCFE9database.Mncontentwastaken 1.285wt.%(blacklines)andcorrespondingto5,10and20wt.%(dashed col-oredlines)ofMnincementiteinequilibriumwithaustenitetotakeintoaccount eventualMnenrichmentincementiteduringpearliteformation.Initialcarbon contentinausteniteobtainedexperimentally(points)iscomparedwiththemean carboncontentinaustenite,whichisinthermodynamicequilibriumwith fer-riteandcementitehavingthesamecontentofsubstitutionalelements(dotted greenline).(Forinterpretationofthereferencestocolorinthisfigurelegend, thereaderisreferredtothewebversionofthisarticle.)
diffusion of substitutional elements during the formation of tempered martensite and bainite should be sufficiently limited to be neglected.
Therefore, one can expect the same content of substitutional ele- ments (the same u-fraction) in ferrite in bainite and tempered marten- site microstructures while some Mn partitioning could take place during the pearlite formation leading to cementite enriched by Mn. During the austenitization, Mn partitioning can occur as well which depends on initial Mn content in ferrite and cementite [ 40, 41].
We now can analyze the formation of fresh austenite using an iso- pleth phase diagram obtained for the fixed content of the substitutional elements (according to Table1), except that of Mn, and varying carbon content (at the expense of iron) using Thermo-Calc software and TCFE9 database ( Fig.12). In order to take into account possible cementite en- richment by Mn during pearlite formation or during slow heating rate of the three initial microstructures, Mn content in cementite in ther- modynamic equilibrium with austenite was being varied when plotting isopleth diagram. However, one can observe that different Mn content in cementite (from 5 to 20 wt.%) in equilibrium with austenite does not change significantly austenite/cementite equilibrium as compared to global content of Mn of 1.285 wt.% ( Fig.12). Therefore, the discus- sion can be limited to the nominal Mn content in the studied steel of 1.285 wt.%.
The isopleth phase diagram for 1.285 wt.% of Mn (black lines) gives carbon content in the austenite in equilibrium with cementite c 𝛾/𝜃and ferrite c 𝛾/𝛼having the same content of substitutional elements as that in austenite.
Plotting the initial mean carbon content in austenite obtained from the in situ experiments (points in Fig.12), we observe that for the heat- ing rate of 0.25 °C/s (the lowest austenite start temperature), the austen- ite mean carbon content, at the start of austenitization, is close to the eutectoid composition, but nearer to the composition of the austenite at equilibrium with cementite. The carbon content of fresh austenite close to that of eutectoid composition were reported in [ 4, 40, 42] and sug- gested recently in [15]where austenite formation is starting controlled by carbon diffusion [ 40, 41, 43–47].
For different heating rates and ferrite-pearlite and tempered marten- site microstructures, a decrease of the mean initial carbon content in austenite is observed when heating rate (and thus the austenitization start temperature (A C1)) increases ( Table5).
When we report all experimental values of initial carbon content in austenite on the isopleth phase diagram, we observe that increasing the heating rate, the initial mean carbon content in austenite varies accord- ing to the average value (c 𝛾/𝛼+ c 𝛾/𝜃)/2 ( Fig.12). Such a result suggests a linear gradient for carbon content in the first austenite formed between ferrite and cementite [48].
In the case of the ferrite-pearlite initial microstructure and the rate of 100 °C/s, a deviation from the average value (c 𝛾/𝛼+ c 𝛾/𝜃)/2 is ob- served. Eventual partitioning of Mn during austenitization and when forming initial ferrite-pearlite microstructure should be carefully exam- ined for fast heating rate. The assumption of non-linear carbon profile in austenite can be supposed. Experimentally, it requires additional anal- ysis of chemical composition of phases in initial microstructures before austenitization.
6. Conclusion
The influence of heating rate and initial microstructure on the mean lattice parameters of ferrite, cementite and, especially, that of austenite during austenitization was investigated by in situ HE-XRD in a 0.36C- 1.3Mn-0.7Cr-0.07Mo wt.% steel. The main results are summarized be- low:
(1) Ferrite and cementite are under compression at the end of their transformation into austenite;
(2) During the austenitization, the mean lattice parameter of austen- ite decreases; this decrease is mainly associated to a change in the mean carbon content;
(3) Assuming that the elastic strains in austenite are negligible, the variations in mean carbon content in austenite are calculated us- ing mean austenite lattice parameter for each transformation con- dition. The first formed austenite has the highest mean carbon content; it decreases rapidly due to the simultaneous transfor- mation of ferrite and cementite into austenite. Once cementite is dissolved, during the ferrite transformation, the mean carbon content in austenite decreases more slowly;
(4) The initial mean carbon content in austenite at the beginning of the austenite formation is dependent on the heating rate: it decreases as heating rate increases (as clearly shown for ferrite- pearlite and tempered martensite initial microstructures). For the lowest heating rate, the carbon content in the first 3 wt.% formed austenite is near the calculated eutectoid composition obtained by Thermo-Calc and TCFE9 database;
(5) Values of initial carbon content in the first austenite formed are in good agreement with thermodynamic calculations with or with- out partitioning of Mn in initial cementite.
DeclarationofCompetingInterest
The authors declare that they have no known competing financial interests or personal relationships that could have appeared to influence the work reported in this paper.
Acknowledgements
Authors gratefully acknowledge the Deutsches Elektronen-Synchrotron (DESY, Hamburg, Germany) and staff of the P07 line at PETRA III, especially, Andreas Stark for the assistance with X-ray diffraction experiments. Financial support of the National Research Agency (ANR) (research grant No. ANR-2010-RMNP-011-06) is gratefully acknowledged.
References
[1] Y. Desalos , F. Le Strat , Traitements thermiques superficiels des aciers, Tech. Ing. M1205 (1996) 1–25 .
[2] J. Barglik, A. Smalcerz, Influence of the magnetic permeability on modeling of in- duction surface hardening, Int. J. Comput. Math. Electr. Electron. Eng. 36 (Issue: 2) (2017) 555–564, doi: 10.1108/COMPEL-05-2016-0240 .
[3] U. Kabasakaloglu, H. Saruhan, Effects of induction hardened surface depth on the dynamic behavior of rotating shaft systems, Mater. Test. 61 (Issue: 3) (2019) 277– 281, doi: 10.3139/120.111316 .
[4] G.R. Speich , V.A. Demarest , R.L. Miller , Formation of Austenite During Intercritical Annealing of Dual-Phase Steels, Metall. Trans. A 12 (1981) 1419 .
[5] A. Roósz , Z. Gácsi , E.G. Fuchs , Isothermal formation of austenite in eutectoid plain carbon steel, Acta Metall. 31 (1983) 509–517 .
[6] A.P. Surovtsev , V.V. Yarovoi , Features of polymorphic transformation kinectics dur- ing heating for low-carbon steels, Metalloved. Term. Obrab. Met. 9 (1984) 2–5 . [7] S. Denis , D. Farias , A. Simon , Mathematical model coupling phase transformations
and temperature evolutions in steels, ISIJ Int. 32 (1992) 316–325 .
[8] F.G. Caballero , C. Capdevila , C.G. De Andrés , Modelling of kinetics of austenite for- mation in steels with different initial microstructures, ISIJ Int. 41 (2001) 1093–1102 . [9] V.I. Savran, S.E. Offerman, J. Sietsma, Austenite nucleation and growth observed
on the level of individual grains by three-fimensional X-ray diffraction microscopy, Metall. Mater. Trans. A 41 (2010) 583–591, doi: 10.1007/s11661-009-0142-5 . [10] F.L.G. Oliveira, M.S. Andrade, A.B. Cota, Kinetics of austenite formation during
continuous heating in a low carbon steel, Mater. Character. 58 (2007) 256–261, doi: 10.1016/j.matchar.2006.04.027 .
[11] V.I. Savran, Y. Van Leeuwen, D.N. Hanlon, C. Kwakernaak, W.G. Sloof, J. Sietsma, Microstructural features of austenite formation in C35 and C45 alloys, Metall. Mater. Trans. A 38 (2007) 946–955, doi: 10.1007/s11661-007-9128-3 .
[12]E. Schmidt , Y. Wang , S. Sridhar , A study of nonisothermal austenite formation and decomposition in Fe-C-Mn alloys, Metall. Mater. Trans. A 37 (2006) 1799–1810 . [13] E.D. Schmidt, E.B. Damm, S. Sridhar, A study of diffusion- and interface-
controlled migration of the austenite/ferrite front during austenitization of a case-hardenable alloy steel, Metall. Mater. Trans. A 38 (2007) 244–260, doi: 10.1007/s11661-007-9208-4 .
[14] A. Eggbauer, M. Lukas, G. Ressel, P. Prevedel, F. Mendez-Martin, J. Keckes, A. Stark, R. Ebner, In situ analysis of the effect of high heating rates and initial microstructure on the formation and homogeneity of austenite, J. Mater. Sci. 54 (2019) 9197–9212, doi: 10.1007/s10853-019-03527-3 .
[15] V.A. Esin, B. Denand, Q. Le Bihan, M. Dehmas, J. Teixeira, G. Geandier, S. De- nis, T. Sourmail, E. Aeby-Gautier, In situ synchrotron X-ray diffraction and dilatometric study of austenite formation in a multi-component steel: Influence of initial microstructure and heating rate, Acta Mater. 80 (2014) 118–131, doi: 10.1016/j.actamat.2014.07.042 .
[16] G. Geandier, E. Aeby-Gautier, A. Settefrati, M. Dehmas, B. Appolaire, Study of dif- fusive transformations by high energy X-ray diffraction, C. R. Phys. 13 (2012) 257– 267, doi: 10.1016/j.crhy.2011.12.001 .
[17]H.M. Rietveld , A profile refinement method for nuclear and magnetic structures, J. Appl. Cryst. 2 (1969) 65–71 .
[18] H. Toby Brian, R factors in Rietveld analysis: How good is good enough? Powder Diffr. 21 (2006) 67–70, doi: 10.1154/1.2179804 .
[19]J. Rodriguez-Carvajal , Recent advances in magnetic structure determination by neu- tron powder diffraction, Physica B 192 (1993) 55–69 .
[20] S.M.C. Van Bohemen, Austenite in multiphase microstructures quanti- fied by analysis of thermal expansion, Scr. Mater. 75 (2014) 22–25, doi: 10.1016/j.scriptamat.2013.11.005 .
[21] G. Mohapatra, F. Sommer, E. Mittemeijer, Calibration of a quenching and deformation differential dilatometer upon heating and cooling: Thermal ex- pansion of Fe and Fe–Ni alloys, J. Thermochim. Acta 453 (2007) 31–41, doi: 10.1016/j.tca.2006.11.007 .
[22]Y.C. Liu , F. Sommer , E.J. Mittemeijer , Lattice parameters of iron-carbon and iron-ni- trogen martensites and austenites, Phil. Mag. 84 (2004) 1853–1876 .
[23]A. Kagawa , T. Okamoto , H. Matsumoto , Young’s modulus and thermal expansion of pure iron-cementite alloy castings, Acta Metall. 35 (4) (1987) 797–803 . [24]S. Hartmann , H. Ruppersberg , Thermal expansion of cementite and thermoelastic
stresses in white cast iron, Mater. Sci. Eng. A 190 (1995) 231–239 .
[25] K.D. Litasov, S.V. Rashchenko, A.N. Shmakov, Y.N. Palyanov, A.G. Sokol, Thermal expansion of iron carbides, Fe7C3 and Fe3C, at 297–911 K deter- mined by in situ X-ray diffraction, J Alloy. Compd. 628 (2015) 102–106, doi: 10.1016/j.jallcom.2014.12.138 .
[26]R.C. Reed , J.H. Root , Determination of the temperature dependence of the lattice parameters of cementite by neutron diffraction, Scr. Mater. 38 (1) (1998) 95–99 . [27] S.Y.P. Allain, S. Gaudez, G. Geandier, J.-.C. Hell, M. Gouné, F. Danoix, M. Soler,
S. Aoued, A. Poulon-Quintin, Internal stresses and carbon enrichment in austenite of Quenching and Partitioning steels from high energy X-ray diffraction experiments, Mater. Sci. Eng. A 710 (2018) 245–250, doi: 10.1016/j.msea.2017.10.105 . [28] I.G. Wood, L. Vocadlo, K.S. Knight, D.P. Dobson, W.G. Marshall, G.D. Price, J. Brod-
holt, Thermal expansion and crystal structure of cementite, Fe3C, between 4 and 600 K determined by time-of-flight neutron powder diffraction, J. Appl. Crystallogr. 37 (2004) 82–90, doi: 10.1107/S0021889803024695 .
[29] A.J. Leinewber, Anisotropic microstrain broadening in cementite, Fe3C, caused by thermal microstress: comparison between prediction and re- sults from diffraction-line profile analysis, Appl. Cryst. 45 (2012) 944–949, doi: 10.1107/S0021889812036862 .
[30] G. Geandier, L. Vautrot, B. Denand, D. Sabine, In situ stress tensor determination dur- ing phase transformation of a metal matrix composite by high-energy X-ray diffrac- tion, Materials 11 (2018) 1415, doi: 10.3390/ma11081415 .
[31]D.J. Dyson , B.J. Holmes , Effect of alloying additions on the lattice parameter of austenite, Iron Steel Inst. 208 (1970) 469 .
[32] N.H. Van Dijk, A.M. Butt, L. Zhao, J. Sietsma, S.E. Offerman, J.P. Wright, S. van der Zwaag, Thermal stability of retained austenite in TRIP steels studied by syn- chrotron X-ray diffraction during cooling, Acta Mater. 53 (2005) 5439–5447, doi: 10.1016/j.actamat.2005.08.017 .
[33] R. Blondé, E. Jimenez-Melero, L. Zhao, J.P. Wright, E. Brück, S. van der Zwaag, N.H. van Dijk, Mechanical stability of individual austenite grains in TRIP steel stud- ied by synchrotron X-ray diffraction during tensile loading, Mater. Sci. Eng. A 618 (2014) 280–287, doi: 10.1016/j.msea.2014.09.008 .
[34] L. Guo, H.K.D.H. Bhadeshia, H. Roelofs, M.I. Lembke, In situ synchrotron X-ray study of bainite transformation kinetics in a low-carbon Si-containing steel, Mater. Sci. Technol. 33 (17) (2017) 2147–2156, doi: 10.1080/02670836.2017.1353669 . [35] P. Huyghe, M. Caruso, J.-.L. Collet, S. Dépinoy, S. Godet, Into the quenching & par-
titioning of a 0.2C steel: An in-situ synchrotron study, Mater. Sci. Eng. A 743 (2019) 175–184, doi: 10.1016/j.msea.2018.11.065 .
[36]G. Caglioti , D. Toccheti , Resolution and luminosity of a triple axis crystal spectrome- ter in experiments of elastic neutron diffraction, Nuclear Instrum. Methods 32 (1965) 181–189 .
[37]Mehrer, Diffusion in solid metals and alloys, Landolt-Börnstein Handbook, 26, Springer, Berlin, 1990 .
[38] C.R. Hutchinson, R.E. Hackenberg, G.J. Shiflet, The growth of parti- tioned pearlite in Fe–C–Mn steels, Acta Mater. 52 (2004) 3565–3585, doi: 10.1016/j.actamat.2004.04.010 .
[39] W.W. Sun, Y.X. Wu, S.C. Yang, C.R. Hutchinson, Advanced high strength steel (AHSS) development through chemical patterning of austenite, Scr. Mater. 146 (2018) 60–63, doi: 10.1016/j.scriptamat.2017.11.007 .
[40] M. Enomoto, S. Li, Z.N. Yang, C. Zhang, Z.G. Yang, Partition and non- partition transition of austenite growth from a ferrite and cementite mix- ture in hypo- and hypereutectoid Fe-C-Mn alloys, Calphad 61 (2018) 116–125, doi: 10.1016/j.calphad.2018.03.002 .
[41] Y. Xia, M. Enomoto, Z. Yang, Z. Lic, C. Zhang, Effects of alloying elements on the kinetics of austenitization from pearlite in Fe–C–M alloys, Philos. Mag. 93 (9) (2013) 1095–1109, doi: 10.1080/14786435.2012.744484 .
[42]A. Jacot , M. Rappaz , A combined model for the description of austenitization, ho- mogenization and grain growth in hypoeutectoid Fe-C steels during heating, Acta Mater. 47 (5) (1999) 1645–1651 .
[43] Q. Lai, M. Gouné, A. Perlad, T. Pardoen, P. Jacques, O. Bouaziz, Y. Bréchet, Mechanism of austenite formation from spheroidized microstructure in a inter- mediate Fe-0.1C-3.5Mn steel, Metall. Mater. Trans. A 47A (2016) 3375–3386, doi: 10.1007/s11661-016-3547-y .
[44] G. Miyamoto, H. Usuki, Z.D. Li, T. Furuhara, Effects of Mn, Si and Cr addition on reverse transformation at 1073 K from spheroidized cemen- tite structure in Fe–0.6 mass% C alloy, Acta Mater. 58 (2010) 4492–4502, doi: 10.1016/j.actamat.2010.04.045 .
[45] Z.D. Li, G. Miyamoto, Z.G. Yang, T. Furuhara, Kinetics of reverse transformation from pearlite to austenite in an Fe-0.6 mass pct C alloy and the effects of alloying elements, Metall. Mater. Trans. A 42A (2011) 1586–1596, doi: 10.1007/s11661-010-0560-4 . [46] D. Shtansky , K. Nakai , Y. Ohmori , Pearlite to austenite transformation in an
Fe-2.6Cr-1C alloy, Acta Mater. 47 (9) (1999) 2619–2632 .
[47] H. Kamoutsi, E. Gioti, G.N. Haidemenopoulos, Z. Cai, H. Ding, Kinetics of solute partinioning during intercritical annealing of a medium-Mn steel, Metall. Mater. Trans. A 46A (2015) 4841–4846, doi: 10.1007/s11661-015-3118-7 .
[48] D. Gaude-Fugarolase, H.K.D.H. Bhadeshia, A model for austenitisation of hypoeu- tectoid steels, J. Mater. Sci. 38 (2003) 1195–1201, doi: 10.1023/A:1022805719924 .