Publisher’s version / Version de l'éditeur:
ASHRAE Transactions, 105, Pt. 2, pp. 400-413, 1998-11-01
READ THESE TERMS AND CONDITIONS CAREFULLY BEFORE USING THIS WEBSITE. https://nrc-publications.canada.ca/eng/copyright
Vous avez des questions? Nous pouvons vous aider. Pour communiquer directement avec un auteur, consultez la
première page de la revue dans laquelle son article a été publié afin de trouver ses coordonnées. Si vous n’arrivez pas à les repérer, communiquez avec nous à PublicationsArchive-ArchivesPublications@nrc-cnrc.gc.ca.
Questions? Contact the NRC Publications Archive team at
PublicationsArchive-ArchivesPublications@nrc-cnrc.gc.ca. If you wish to email the authors directly, please see the first page of the publication for their contact information.
NRC Publications Archive
Archives des publications du CNRC
This publication could be one of several versions: author’s original, accepted manuscript or the publisher’s version. / La version de cette publication peut être l’une des suivantes : la version prépublication de l’auteur, la version acceptée du manuscrit ou la version de l’éditeur.
Access and use of this website and the material on it are subject to the Terms and Conditions set forth at
Sink characteristics of a full-scale environmental chamber and their
impact on material emission testing
Zhang, J. S.; Nong, G.; Shaw, C. Y.
https://publications-cnrc.canada.ca/fra/droits
L’accès à ce site Web et l’utilisation de son contenu sont assujettis aux conditions présentées dans le site LISEZ CES CONDITIONS ATTENTIVEMENT AVANT D’UTILISER CE SITE WEB.
NRC Publications Record / Notice d'Archives des publications de CNRC:
https://nrc-publications.canada.ca/eng/view/object/?id=381693b7-11eb-4a57-a92a-8eee5a01faa5
https://publications-cnrc.canada.ca/fra/voir/objet/?id=381693b7-11eb-4a57-a92a-8eee5a01faa5
http://www.nrc-cnrc.gc.ca/irc
Sink c ha ra c t e rist ic s of a full-sc a le e nvironm e nt a l c ha m be r a nd t he ir
im pa c t on m a t e ria l e m ission t e st ing
N R C C - 4 2 7 9 9
Z h a n g , J . S . ; N o n g , G . ; S h a w , C . Y .
N o v e m b e r 1 9 9 8
A version of this document is published in / Une version de ce document se trouve dans:
ASHRAE Transactions, 105, (Pt. 2), pp. 400-413, November 01, 1998
The material in this document is covered by the provisions of the Copyright Act, by Canadian laws, policies, regulations and international agreements. Such provisions serve to identify the information source and, in specific instances, to prohibit reproduction of materials without written permission. For more information visit http://laws.justice.gc.ca/en/showtdm/cs/C-42
Les renseignements dans ce document sont protégés par la Loi sur le droit d'auteur, par les lois, les politiques et les règlements du Canada et des accords internationaux. Ces dispositions permettent d'identifier la source de l'information et, dans certains cas, d'interdire la copie de documents sans permission écrite. Pour obtenir de plus amples renseignements : http://lois.justice.gc.ca/fr/showtdm/cs/C-42
- - _..._ _._ _..•...= .
4311
J.S.
Zhang is a research officer,G.Nang is a technical officer, and C.Y. Shaw is a senior rt>..search officer at the Institute for Research in Construction, National Research Council Canada, Ottawa. Ontario.Sink Characteristics of a
Full..Scale Environmental
Chamber and Their Impact on
Material Emission Testing
ASHAAE Transactions: Research EXPERIMENTAL METHOD,
PROCEDURE, AND FACILITY
C.Y. Shaw, Ph.D., P.Eng.
Member ASHRAE
indoor environmental conditions (i.e., Howard et al. 1995;
Zhang et at 1996a).
In order to obtain reliable emission results, the ー」イヲッイセ
mance of a ヲオャャrセ」。ャ・ chamber should be evaluated. Factors
affecting a chamber's performance include the level of back·
ground contamination, effectiveness of the air cleaning system, accuracy of the environmental control system, airtightness of the chamber, mixing level in thechambe,r,and thesinkeffectofthe chamber'sinteriorsurface (Howardet al. 1997; Mason et at 1997; Brown 1997; Zhang et al. 1996b).
The objective of this study was to assess the sink characteris-tics of a full-scale chamber in detail and demonstrate their potential impact on emission testing results.
General Method and Procedure
For each sink test conducted in this study, the full-scale chamber was first preconditioned at 23'C and 50% RH (preconditioning period). A small mixing fan was located at
the center of the chamber and operated at all times during
test-ing to
ensuregoodairmixing in thechamber.A mixtureaftestvoe:;
wasintroduced into thechamber(injection period).Fol'tests that include the recirculation loop. the chamber was oper-ating in full recirculation mode duting the injection period. After the injection period. the supply and teturn fans (Figure I) were shut down and the chamber was maintained under the
static condition for a period of 18 hours to allow the adsorption
of VOCs in the chamber walls (referred to as the adsorption
period). Following the adsorption period, the chamber was
ventilated with a specified air change rate (referred to as the
desorption period)while the
voe
concentrations inthecham-Go
Nang
J.S. Zhang, Ph.D.
Member ASHRAE
ABSTRACT
400
'" this study, a method was developed and used to measure
the ad.'WJption/desorption characteristics (i,e., the so-called
sink effect) ofa/ull-scale environmental chamber(5m x4m
x2.75mhigh). Unrecovered and reverslble sink parameters H/erc measuredfor five volatile organic compounds (VOCsj:
ethyibenzene, decant, 1,2-·dichlorobenzene. oClanol. and
dodecane.
it
wasfOlllld that/or the five compounds tested, thefull·scale chamber had noticeable reversible sink effect but
negligible unrecovered sink effect. The reversible sink strength
increased in the order of ethylbenzene. decane, QNRᄋ、ゥ」ャHスセ
robenzene, dodecane, alld oetanol. A first-order reversible sink model appeared to be adequate/or describing the
adsorp-tion/desorption characteristicsof the chamber. It was also
found that when lhe return air wasrecirculatedthrough
heat-ing and coolheat-ing coils and HEPA filter, the sink strength
increased significantly. The reversible sink effectl1111S more
noticeableinte.lting "wet" coating materials rather tlu:m dry
materials.The results of this studywouldbe useful for
devel-oping standard test methods and proceduresjorevaluating the perforrmmce offull-scale environmental chambers and for using such chambers to test and investigate VOC emissions from building materials andjurnishings.
In order to predict and maintain the indoor air quality in buildings, it
is necessary
to know the contaminant emission characteristics of interior huilding materials and furnishings. Full-scale environmental chambers are very useful for measuring the VOC・ュゥウNセLゥッョ rates of building materials and furnishings because of their capability in simulating realistic INTRODUCTIONTABLE 1
Operating Conditions of the Chamber System in this Study
(2)
M"t セ total
VOC
mass adsorhed by the chamber surfaces (sink) at the end of the adsorption period, mg; Malr ::::VOC mass in the chamber air atequilihrium(Mai ,セ C,qV),mg;
M"ak
=VOC mass loss due to air leakage during the 18-hom' adsorplion period, mg;Mo =VOC mass injected, mg;
M, =total VOC mass in the chamber(M"
+
Mai,)at the end of adsorption period, mg;'.It ==totalsink ratio;
V セ volume of the chamber system (including the air volume of the recirculation loop if the loop is included inthetest), m3.
2. Unrecoveredsink ratio,'.fl'defined as theratio betweenthe nonrecoverable VOC mass and the total VOC mass in the chamber at equilihrium:
ASH RAE TransactIons: Research
where
C :;,;concentration of exhausted air, mglm3
(.tt=O, C=C,q);
M,xit
=
VOC mass exhausted from the chamber during the desorption period, mg;Msi ::VOC mass that is not recmitted from the sink
(i.e.,unrecovered), mg;
Q
=
clean airflow rate (which is equal 10 the exhaust airflowrate), m31h;rsi :::;.unrecovered sinkratio;
=
elapsed time since the star! of the desorption petiod (i.e" tセ 0), h.(1)
Test No. PrccondUion JHijedionPeriod Adllorption Period fャオセセゥョァ Period Mo-M'liak(Mo)mg
23 ± 0.5 'C, Static] Static] Mode1:0.5±0.015ACH 2250,9 (2305) 50±2% RH 23±1.0 'C, 23 ± 1.0 'C, total supply and exhaust airflow rate,
50±5%RH 50±5% RH 23±0.5 'C, and 50 ± 2% RH
2a 23 ±0,5 'C, Mode 2 with 100% StaticI Mode 2: 5±0,15ACHlolal supply and 2070.3 (2110) and and 50±2%RH full recirculation 23±LO'C, 0.5±0.015 ACH exhaust airflow rate, 2286,6 (2316)
2b 50±5% RH 23 ± 0.5 'C, and 50 ± 2% RH
3 23±0.5 QC. Mode 3 with 100% Static] Mode 3: 5 ± 0,ISACH ,o,al supply and 2175.1 (2236) 50±2%RH full recirculation 23 ± 1.0 'C, 0.5:;t0.015ACH exhaust airflow rate.
50±5%RH 23-24.5'C,and 40·60% RH'
Total. Unrecovered. and Fleversibie Sink Ratios The sink strength of the chamber may he descrihed by the following three parameters:
L Total sink ratio,r"IS'is defined asthe ralio be1wcen the mass adsorbed during thc 18-hour adsorplion period and the total VOC mass inthe chamber at the end of the petiod: CALCULATION
Of
SINK PARAMETERSAir sampling and Analysis for Tracer Gas
(Sf
s) During each sink test, a small amount of SF6was injected into the chamber and its concentrations were measured every six minutes byusing a portable gas monitor at several Ioea· tions including the return air duct, center, and the corner oftbefull-,cale chamber, Polytetrafluorethyleneエオ「・セ were used to
transport the air·SF6mixture from the sampling locations to the gas monitor. The measured SF6concentrations were used to determine the air leakage rate of the chamber. which was.
in turn, used to estimate the lossofVOCs duringthe
adsorp-tion period,
than 0.35 m, Limitation on the length of the sampling porI/line
was found to be necessary to minimize the sink effect of the sampling portllinc itself. The air samples collected by the
sorbent tubes were analyzed hy a thermal desorber-GCIFID
system, whichwas precalibrated against liquid standards for each individual compound tested in this study.
I The chamber was seall:!d and HVAC system was olf. Conditions were maintained by the air conditions inthe labセー。」・ which had211independent system fol'temperl;l.IUre:.'Ind humidity controls. AウュセQi computer cooling fan was located in the centerQf the chamber to ensure complete air mi:ll:ing inthechamber duringtheenlire fest period_
2 Temperature and relativehUlIUdilywiffedbecause lhe HV AC wmponents were「ケー。セウ・、 intbis I{'.SI
where
Ceq ::concentration at the end of theadsorption period
(I.e:, the star! of the desorption period), which is assumed tobe the equilibriumconcentration.mglm3;
:EE 10 <5
I
1£
'Jlt
EI"
<Sセ
I
セ
•
ASHAAE Transactions: Resaarcl1
•
•
•
-••
" 1204. Fit Equation 9 to the measuredC(t)data using least square regression analysis to dctcnnineka (Le" on.ly onepardmeter
was determined by the regression).
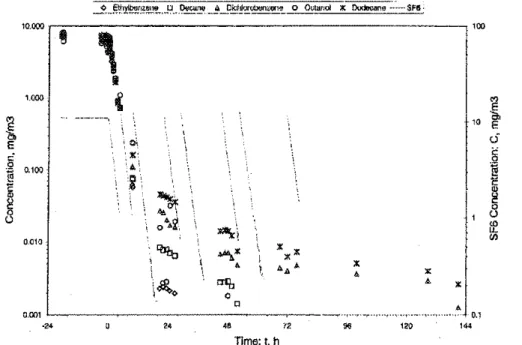
Figures 2 through 4 show the measured VOC concentra· tions for the four tests conducted. Values of the sink parame-ters are listed in Tables 2 through 4,
RESULTS AND DISCUSSION
i ; JGAヲNセ I
,
....
•
11< "•
o • 'lI,
,
0•
"'''c
4Il 72 Time: l, h 24 I II I i,O\ ,.'
: . i !2""
セ
oBaセGL""1:\
'll1t,
,
...
I•.'
,
-
-.
-I ! I, Ii
<lll,.
"'b0 0 24..
"
o,
Iセ
-=---_._---- '"
,
0.001 ' - ' - - - _ , ·24 10.000· - . . 0,001 ' - _ - - - . - ..,...,.-,. ..., ..,'.-,.. _... ·24 10-1100 , , : - - - , 1 "@
'"
1.000<1
E <Sc
a.lOO,g
セ§
セ
() 0,010 1cooセ
ENセ
0.100 セセ
0.010Figure2 Measured concentrations of VOCs and SF6for Test1(t ::::;0 at Ihe start of desorption period; also note the multiple injections/or SF6).
To summadze, the foHowing procedure was used in this study to cakulate the adsorption, desorption, and equilibrium constants:
I. Calculater,liand
'Sf
by Equations 2 and 3, respectively, 2, Calculatek,by Equation 7.3. Express kdas k" Ike in Equation 9.
Tlme:t,h
Figure 3a l\1ea.mred concentrations of VOCs and SF6jor Test 2a (t
=
0 at the start oj desorption period; also note themultiple i/(;ections for SF
6)'TABLE 2
Calculated Sink Paremeters lor Teet 11, 2
BLMMMNLNZMセMBNG
-_
..
r sf(%) r sr (%)
----Compound
r,t
(%) Iv = 48 h Iv=96h IN =142h IN= 48 h IN=
96 h IN=142h k.=std3('!"h) kd(l/h) k,(m)Ethylbenzene 1. 2. 2. 2. -1. -1. -1. N/A4 N/A4 -0.006
Decane 2. I. O. O. 1. 2. 2. 0.00039±0.00001 0.033 0.012
-1, 2·dicJorobenzene 12. 4. 2. 2. 8. 9. 10. 0.0055 ± 0.00035 O.OSI 0.068
.---._-
--Oelanol IS. O. 0.0 0.0 IS. IS. IS. 0.0171 ±0.00103 0.127 0.135
Dodecane 17. 3. O. -1. 15. IS. IS. 0.0051 ±0.00029 O.QJS 0.135
-
....I rJI'ka. kif'andAt:werec,llJculared using 0-142 h data,
1 V"'55mJ,As"'JS9.5m!.
3 sエセョ、。イ、 deviation of the・NセエゥュN。エ・L ka'
4 The regression analysis was nOI successfuldue [0 l,'lxperirnentaJ ullcenainty and small sink effecl.
TABLE3a
Calculated Sink Parameters for Test 2a1. 2
'sj(%)
.f--.- '5'(%)
Compound ys/(%) tN==48h I N=96h IN= 142 h I N=48h IN=%h l,v=142h k•.±sld3(mIh) kd(llh) k,(m)
--Ethylbenzenc 3.0 I. 1. I. 2. 2. 2.
N/A
4N/A"
0.001Decane S. 3.
..
3. 3. 4. 5. 5. 0.0024±O.OOOOS 0.092 0.026"..
1, 2·dicJorobenzene 15. 4. 2. 1. 12. 13. 14. 0.0057±0.00060 0.065 O.osS
Octanol 31. 3. 3. 3. 28. 28. 28. 0.06968 ±0.OI22 0.329 0.212
Dodecane 23. 4. 1. O. 19. 22. 23. O.OOSS±O.OOOSO 0.05S 0.155
----
-r", ka' kd, and ktwere calculated using 0-142 h data.
V., 56.11113, At '" 108.7 m'.
Standard deviation of the estimate, kit
Then::grcssioll analysiswasnotsu..::ceSllfuJdue to eKperimentll.1 uncenainty andsmall sink effect.
TABLE 3b
Calculated Sink Parameters for Test 2b1,2
Tsi(%) ' " (%)
-Coml!0und rft(%) IN=48h IN=%h IN =142h IN =48 h IN =96 h IN= 142 h k.±sId3 (mIh) kd(llh) k,(m)
_..
-Ethylbcnzcne 11, 6. 6. 6. 5. 5. 5.
N/A'
N/A"
0.001Decane 10. I. I. 1. 9. 9. 9. 0.0109±0.00051
-,_.
0.210 0.0521,2-dicJorobenzene 20. 6. 5. 4. 15. 16. 16, 0.0119 ± 0.00121 0.116 0.103
Octanol 33. I. I. I. 32. 32. 32. 0.131 ± 0.023 0539 0.243
-Dodecane .27. 4. 2. 2. 23. 25. 25. 0.0189±0.0023 O.IOS 0.175
I 'fl'ォセL ォセL and ォセ werecal.;:ulatedusing0-142 h dala.
v]UVNャャエ_La[BQPXNWエョセN
Standard deviatiun of the estimate,k".
Theregressionanalysh was not successfuldue toexperimentaluncenainty andsmallsinkeffect.
stronger sink effect than octaool (which has the strongest sink effect among the five VOCs tested in this study).
Adsorption, Desorption. and Equilibrium Constants
Tahles 2 through 4 list the adsorption, desorption, and equilibrium constants calculated using
the
procedurE described earlier in this paper. The equilibrium constant,ke,increased in the order of ethyl benzene, decane, 1LRセ、ゥ」ャッr
robenzene, dodecanc. and octanol for allfOUTtests in the same way as the values of the reversible sink ratio,ror
Inthe detenninationof the adsorptionratel:onstant, ka•all
the curve fitting, except for ethylhenzene, resulted in coeffi-cients of determination larger than 0.83 (Tahle 5), indicating
thatthe first-order reversible model is a good approximation of the reversihle sink effect. The data for ethylhenzene did not result in satisfactory estimation of the adsorption coefficients in the mgression analysis, prohably hecause the effect of desorption on the measured concentrations was within・クー・イセ
lmental error and was therefore insignificant.
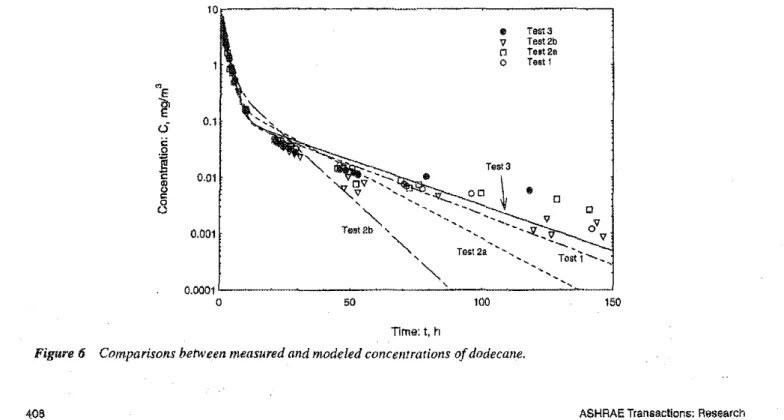
As anexample,Figure 6showsthecurvefitting resultsfor dodecane. It indicates that for Tests 2a and 2h, the model could not account well for the very slow reemission of VOCs after about 50 hours.It is possible that there were some additional adsorption/desorption characteristics (other than the ヲゥイウエセ
order reversihle sink effect) when the HVAC conditioning loop was included in the tests. Further studies are needed to
better understand this phenomenon. However, it should be noted that VOC mass reemitted after 50 hours is negligible compared to the total mass reemitted (note that the vertical axis of the plot is in log scale). Therefore. the first-order reversible sink model may still he-considered as an appropriate
10
TABLE 5
Coefflc:lents of Determination of Regression Analysis
t・セエ No. Denne 1,2Rdiclo..ッ「・ュZセョ・ Octanol Dooecane
."
..
.._--._.
0.996 0.938 0.973 0.986
2a 0978 0.850 0.979 0.885
2b 0.983 0.893 0.953 0.836
:l 0.998 0.962 0.987 0.988
description of the primary セゥョォ characteristics of a chamber
system.
The maximum standard deviation of aU the adsorption constants(k,)estimated is 12.0% of the corresponding value
of
the adsorption constant. Figure 7 shows the adsorption rate constant,ku'against the equilibrium constant,ke,for decane.1LRセ、ゥ」ャッイッ「・ョコ・ョ」L and dodecane as obtained in this study
and results for octane, nonane, decane, undecane, and dode-caoe obtained hy Mason et al. (1997), which were obtained under the same temperature, relativeィオュゥ、ゥエケセ and air change rate conditions. The data for oetanol are excluded from this graph because it helongs to a different chemical group (i.e., alcohol as oppose to hydrocarbons). It was also found that more uncertainties might be involved in the thermal desorp-tion-GClFlD analysis for octanol than the other four hydro-carbon compounds because of its relatively high polarity.
As shown inFigure 7, there appearsto be a relatively strong correlation between ka and kefor the hydrocarbons
tested as indicated hy the relatively high coefficient of deler-mination (CODセ 0.807). The exponential equation in Figure 7 is used here as an empirical
fit
to the experimental data, Thee Test 3 V Test2b r.J Test 2e o Test 1
l
<5
I
8
Time:t,hFigure
6Comparisons between measured and modeled concentrarions ofdodecane.
Nt!>.' 10-3to102 (low to high) 104 to10-' (low to highl
NtA'
l(r' to10° (low to high)E'!2
(mg/m'h) l(y2 to 100 (low to high)' 10-1to 100 (low to high) 10-'to10° (low to high) 10-3to10-2 (low to high) 101to103 (low to high) 100to10' (low to high) 10·'to100 (low to high)ofF:.o1,E02andkit k2,there is a small underestimation of the
emission rate initially because of the adsorption of VOCs by thesink,followed by a period ofoverestimation becauseofthe
VOCs desorbed from the sink. A higher initial emission rate would lead to a largerinitial underestimation oftheemission rate during the initial period and a larger overestimation
immediately following the initial period (Cases a and h vs. c and d), as expected. TheamountofoverestimationinCasesc and d increases with time because of the faster decay of the
emission ratefrom the source than thereemission rate fromthe sink. These results suggest that for "wet" coating material, even a relatively low reversible sink effect(k,=0.05 m) can result in a large error in the determination ofemission rate
when both the initial emission rates and decay constants are
bigh (i.e.• Case a).
A higher sink strength (i.e., a larger k, value), if not account.ed for, would result in a higher relative error, as shown in Figures 9, 10, and 11 for "wet" coating. "wet" "Wet" coating materials (such as wood stains, varnishes, paints. and wax)
Material Type
Dry materials (such as carpels, gypsum wallboards, particleboard. oriented strand board. vinyl flooring, ceiling tiles. fabrics, etc.) "Wet" installation materials (such as adhesives, caulk and sealant, and varieties of joint, patching, and texture compounds)
r - - - , - - - , - - - - , - - - , - - - ,
E,u- E AJ
S
=
-'-E
x100%=
AE(--kaC+k,fn)x100%-3.966kf
0.0256(I -.
lA.,
= k AE
,
--(-k,C+m)x 100%1 Emission faclors(E)Illl;l repre:o:enll:dby: E'(t).E(lJf/·k]1+eッ[iGAᄋセャャN Values ill this table IepreS.,nt the ordl',f of ma.gnitude ofE(\l."I'11'02' aDdォセ and includeclarafol' indi\'idual VOCs only.
2 Original dara were only rc:pre:lentoo by the single e"pllllential model, which only applies 10 the fir5t24hours. A secondexponenlial term is assumed here for"wet"installation materials 10 represent II more reulistic, ]ongcNclID emission faclor.
factor can bedirectly derived from the mass balance equation
(Equation 8) with and without the sink terms as follows:
TABLE 6
Order of Magnllude of
voe
Emission Factors of Various Building Materials1where
En,v ;;;emission factor calculated from the measured
concentration at chamber exhaust when the sink
effect is not compensaled, mg/(m'·h);
o
::;:;
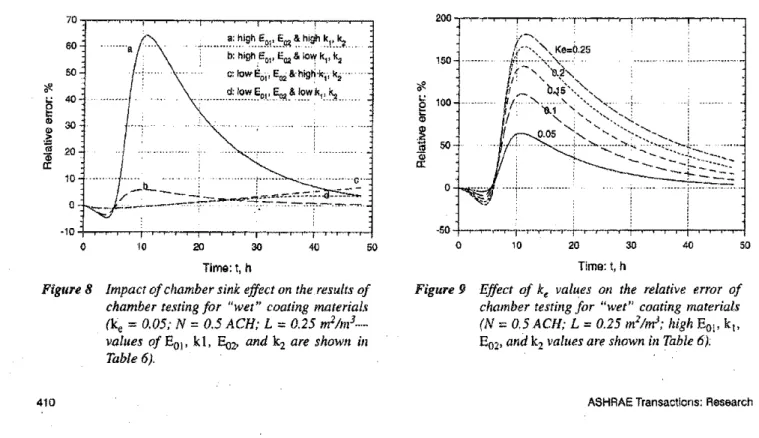
relative error,%.For "wet" coating materials, Figure 8 shows the
calcu-lated relative error fork,
=
0.05.Itcan be seen that the relativeerror is highest when both the initial emission factors and
decay constants are. high (curve a). For all fourcombinations
'"
40 30 10 20 -50o
200 150 ?fl.セ
100 Nセ j'"
"
a: 0 50 40 30""
セZNセ⦅ェセセ..
セ⦅qャセNセNセ セセAァィ セエNセN⦅. b: high;6"01'E02&ォQセ k1, k2
c:lowEol ' E0.2&-higry-k"1-,k2-"
___..セZNセセセNセッNエG⦅Beセ⦅F⦅セ_セNォQZ⦅セ .. 20 10 70 60
'"
?I'セ
40 m 30"
>"
"
20£
10a
·10 0 Tima: t, hFigure
8
Impact ofchamber sink effect on the results ofchamber testing for "wet" coating material.s;
(k, :
0.05; N = 0.5 ACH; L=
0.25m
2Im3_._ values ofE01 'k1,Ev"
andk2are shown inTab/e 6).
Tima:t,h
Figure 9 Effect of ke values on the relative error of chamber testing for ljwet" coating materials (N
=
0.5 ACH; L=
0.25 m%,J;highE
OI 'k"
E
02 ,andk,
vailles are shown in Table 6):which usually have high initial emission rates and high initial decay rate constants. The impact of reversible sink
effect on emission test results should be estimated for
specific conditions (chamber volume, air change rate, spec-imen loading ratio, compounds to be measured. and emis-sion rate profile) under which emisemis-sion tests are conducted.
The first-order reversible sink model may be u....,cd to
accountforthe reversible sink effect
if
it is considered tobesignificant.
ACKNOWLEDGMENT
This study was sponsored by National Research Council
ofCanada and members of the Consortium for Material
EmIs-sions and Indnor Air Quality Modeling (CMEIAQ). The authors would also like to acknowledge the helpful discus-sions with Mr. Mark Mason of NRMRLfUSEPA and Dr. Stephen Brown of CSIRO/Australia.
REFERENCES
An,
Y.,
J,S, Zhang, and C'y' Shaw. 1997. Review of volatile organics emission data for building materials and fur-nishings. InternalReport.Institute for Researchin Con-struction. National Research Council Canada, 40 pp. IRC·IR-750.Brown, S. 1997. VOC sink performance of CSIRO room dynamic environmental chamber. DBCE Doc 97/168 (MJ, Division of Building, Construction and Engineer-ing, CSIRO, Australia.
Dunn, I.E.. and B.A, Tichenor. 1988. Compensating for sink effects in emissions test chambers by tnathematical
modejing./ltmospheric Environment, 22:885.
Howard, E.M., M.A. Mason, 1.S. Zhang, and S. Brown. 1995. A comparison of design specifications for three
large environmental chambers. In
Engineering
Solutions to Indoor Air Quality Problems, VIP-S J. Sewickley, Pa.: Air&Waste Management Association.Howard, E.M., MA Mason, R, Fortman, and Z. Guo. 1997.
Large indoor air test chamber characterization. In Engi-neering Solutions to Indoor Air Quality Problems, VIP-75. Sewickley, Pa.: Air& Waste Management Associa-tion.
Mason, M,A .. E.M. Howard, Z. Guo, and M. Bero. 1997. Characterizing sink effects in large environmental chambers. In Engineering Solutions to Indoor Air
Qual-ity Problems, VIP-75. Sewickley, Pa.: Air & Waste Management Association.
Tichenor, B.A., Z. Guo, I.E. Sparks,
L.B.
and M.A. Mason.199 L The interaction of vapor phase organic
com-pounds with indoor sinks. Indoor Air, 1:23.
Zbang, I,S., J.M. Kanabus-Kaminska, and
c.y.
Shaw. I996a. A full-scale lest chamber for material emissionstudies arid indoor air quality modelling. In
Characteriz-ing Sources qllndoor Air Pollution and Related Sink
412
Effects. ASTM STP i287, Bruce A. Tichenor, ed.,
pp.58-66. American Sociely for Testing and Materials. Zhang, I.S., J.M, Kanabus-Kaminska, C.Y. Shaw, J.H.
Weichert, E. Lusztyk, R.I. Magee, and M.A. Brouzes. )996b. Performance evaluation of a full-scale chamber
for material emission tests and studies. Indoor Air '96, The 7th Imemational COllference on Illdoor Ai,. Qualif)' and Climare (Nagoya, Japall, 1996), vol. 3., pp.
373-378. (NRCC-38437) APPENDIX A
DETAILED STEp·ElY·STEP TEST PROCEDURE While the general test method and procedure was the same among the three tests conducted, the detailed test step· bY-SloP procedure (operational procedure) varied slightly
from tcst to test due to the different operationai modes involved.
Step-by-Step Procedure for Test 1
1, Pre-condition the chamber at 23'C, 50% RH, and 0.5 ACH under the full-exhaust mode with the mixing fan on. 2. Check the background VOC concentration level,
3. Turn off the chamber HVAC system, close the supply and
return air dampers. and start the tracer gas monitor.
4. Inject the VOCュゥクエオャセ and U'acel' gas (SF6).
5. Take duplicate airsamples for VOC ュ・。セオイ・ュ・ョエ light
after the injection.
6. Leave chamber under the static condition for
approxi-mately 18 hours (i.e., the adsorption period) following the
completion of the injection.
7. Take duplicate air samples for VOC measurement right after the 18-hour adsorption period.
8. Operate dlechamber system at23'c' 50% RH, and 0.5 ACH under the full-exhaust mode.
9. Take air samples at appropriate sampling intervals (it was
not necessary to follow exact sampling intervals as long as sufficient air samples were taken to describe the decay of
the VOC concentrationsl1l the chamber) until the VOC
concentrations in the chamber are considered negligible
(see "Results and Discussion" section), During tbe flushing
period, SF6wa,;; injected approximately every six hours to
check the air change rates. 10. Turn off the chamber system.
Step·by-Step Procedure for Tests 2a and 2b 1. Same as in test I.
2. Same as in tcst1.
3. Operate the chamber under mode 2 with full recirculation (i.e" zero exhaust airflow rate), and start the tracer gas monitor.