Space filling by nucleation and growth in chemical vapor
deposition of diamond
J. Stiegler, Y. von Kaenel, M. Cans, and E. Blank
D´epartement de Mat´eriaux, Ecole Polytechnique F´ed´erale de Lausanne, CH-1015 Lausanne, Switzerland (Received 18 November 1994; accepted 6 November 1995)
Phase transformations, including chemical vapor deposition (CVD) of diamond, taking place by nucleation and growth are commonly described by Avrami or Johnson-Mehl type models. In order to avoid the restrictions of such models with respect to assumptions concerning nucleation rates and growth velocities, the variation with time of nucleation and growth of diamond particles during the deposition of microwave plasma-assisted CVD was studied. The size distributions obtained from image analysis enabled us to trace back details of the nucleation and growth history. Three sources of particle formation were operating during deposition. A general growth law suitable for all particles did not exist. These observations limited the applicability of Avrami-type models to describe space filling. Computer simulation of surface coverage and particle growth was successful because one particular mode of particle formation and growth dominated surface coverage. Based on image analysis and the determination of the film growth rate, the evolution of the diamond volume fraction with time, starting from three-dimensional particle growth followed by a continuous transition to one-dimensional film growth, was described.
I. INTRODUCTION
In chemical vapor deposition (CVD) of diamond films on non-diamond substrates, surface coverage occurs by island growth; i.e., nucleation is followed by grain growth and coalescence. The most common method to enhance the nucleation density is to abrade the surface with diamond powders, either by manual scratching or ultrasonic treatment.1–6 The effect of
substrate pretreatment is still a matter of debate. Iijima
et al. have shown that seeds of less than a few tens
of nanometers are implanted in the substrate surface during sonicating with diamond powders,2 providing
local seed densities as high as 1011 cm22. Similarly,
geometric features protruding from the substrate surface like sharp edges or apexes, as opposed to sharp valleys or flat regions, and carbonaceous phases in scratches have been reported to favor nucleation.4,5 During deposition
nucleation centers can also disappear as a result of thermal annealing and erosion by atomic hydrogen.6
Recently, Molinari and co-workers, investigating nucleation and growth of hot filament CVD of dia-mond, have proposed a very detailed model descri-bing the kinetics of heterogeneous nucleation on foreign substrates.7–10 The model, which is an extension of
Avrami’s11 statistical treatment of the kinetics of phase
change applied to diamond CVD, involves the time evolution of active sites, germs, and nuclei.7By applying
a uniform growth law for all particles, which has not
been verified experimentally, the nucleation history is back-calculated from the size distribution obtained by a single deposition experiment with low surface coverage
sS ! 1d. The characteristic quantities of the nucleation
process, such as concentrations of the above species and transition probabilities between them, are then cal-culated for various deposition temperatures, methane concentrations, and pretreatments.8,9 In a modified
for-mulation, where allowance is made for impingement between growing particles, the diamond surface fraction is determined as a function of time.10
To the authors’ knowledge, the problem of space filling by random nucleation and grain growth in dia-mond CVD has not been investigated so far. In studying different types of phase transformations, such as solidi-fication and recrystallization of metals, it has frequently been observed that the nucleation rate does not de-cay exponentially with time as supposed by Avrami,11
neither is constant as in the Johnson-Mehl equation.12
Correspondingly, the present paper studies particle for-mation and growth during microwave plasma-assisted CVD (MWCVD) of diamond in order to describe the evolution of surface coverage, grain growth, and crys-tallized volume. Automatic image analysis is used for statistically relevant data acquisition after various depo-sition times, and 2D computer simulation is applied to investigate separately the effects of particle formation and growth.
II. EXPERIMENTAL A. Deposition
k100l oriented silicon wafers were manually
polished for 10 min using a suspension of 1 mm diamond crystals in ethanol, followed by cleaning in pure ethanol. Since this kind of pretreatment can lead to varying nucleation densities when applied to different wafers, for the present study a sufficient number of square substrates (,1 cm2) was taken from the center
of a single wafer of 2 in. diameter.
Diamond was deposited by MWCVD (2.45 GHz;
1% CH4 in 100 sccm H2 at 60 Torr). The
sub-strate temperature, measured by an infrared pyrometer operating at 950 nm, was held at 820±C, varying less than 63 K from one deposition experiment to the next.
In situ interferometry was carried out in order to control
reproducibility of the deposition process. In agreement with Ref. 13, the optical signal exhibited an extremum for a surface coverage of about 0.48. The duration of the deposition experiments ranged from 5 to 60 min. Moreover, continuous films were grown with deposition times up to 16 h. The experimental conditions including the turn on and off procedures were exactly repeated for each run. At the beginning of a deposition, the plasma was ignited in pure hydrogen and the carbon carrier was added once the substrate temperature reached 800±C, about 5 min after ignition. Thus, thermal equilibrium was not fully established at the nominal starting point of the experiment. At the end of a deposition, methane was turned off and the plasma continued to burn for 3 min. All samples were investigated by Raman spectroscopy in order to guarantee uniform diamond quality. Results are reported elsewhere.14
B. Automatic image analysis and simulation of nucleation and growth
A Kontron-IBAS 2000 system was used for automatic image analysis. For this purpose, at least six SEM photographs with identical magnification
s310, 000d were taken, covering a continuous area
of ,500 mm2 in the center of deposition of each
sample. Total particle numbers were ,400, ,750,
,950, ,1100, and ,1250 for deposition times of
10, 20, 30, 41, and 50 min, respectively. Surface coverage (S) and total number of particles (N), as well as particle-related quantities like equivalent diameter [dcircle s4Aypd1/2, A being the projected particle area],
maximum diameter sdmaxd, perimeter, and form factor sdminydmaxd were measured. There is no crystallographic
information from these measurements. Morphological units identified by image analysis, therefore, are named particles rather than grains. In order to avoid artifacts related to the detection of dust particles, features smaller
than 50 nm diameter were eliminated from the data obtained by image analysis.
With increasing surface coverage, particle impinge-ment became important. Clusters consisting of two or more particles had to be cut along visible grain bounda-ries. The criterion applied for particle cutting was that the angles enclosed by the two surfaces of adjacent particles had to be ,180±, corresponding to a re-entrant corner. The result of such a cutting process may be seen by comparing Figs. 1(c) and 1(d). Cutting would introduce an error in measuring particle-related quantities owing to the finite thickness of the separation line. In order to circumvent this problem, the separation line was reduced to zero thickness while maintaining the identities of individual particles by using an erosion operation. The measurement of surface coverage did not involve cutting and, therefore, is not affected by this procedure. Since free re-entrant corners cannot be identified anymore when surface coverage approaches 1, no particle size distribution and density is given for the sample with 60 min deposition time.
The IBAS 2000 system also was used for 2D simu-lation of surface coverage and particle growth. Particle formation is simulated by implanting randomly dis-tributed points (Poisson-Random Process) on a matrix of
512 3 512 pixels (video screen) at the beginning of each
growth step. The number of new particles per growth step conforms to particle formation rates that have been determined from the deposition experiments. If the site of a new particle coincides with pixels occupied by already existing particles, equivalent to the creation of phantom nuclei in Refs. 7 and 11, the attempt of implantation is repeated until the new particle falls in an area not covered yet. Growth is simulated by matrix erosion along the circumference of the particles having a hexagonal shape originally. This operation accounts for impingement; i.e., interpenetration of growing particles does not occur. The smallest linear size increase per growth step is one or two pixels, according to whether a particle grows on just one or two opposite sides. Growth velocity in simulation is varied by using different length scales of the matrix. At the end of each growth step, the same parameters as those used for the deposition experiments are measured by image analysis, i.e., par-ticle sizes, surface coverage, etc. From the comparison with the experiment, insight into particle formation and growth is gained. Typically, six simulations per numer-ical growth experiment were carried out in order to produce particle sets significant in a statistical sense and similar in size to the experimentally determined ones. A detailed description of the simulation procedure and the modeling of particle formation and growth is given elsewhere.15
It was observed empirically that all curve fits for particle sizes, growth rate, and surface coverage could
be optimized by introducing a common time shift of 1.5 min.
III. RESULTS A. Image analysis
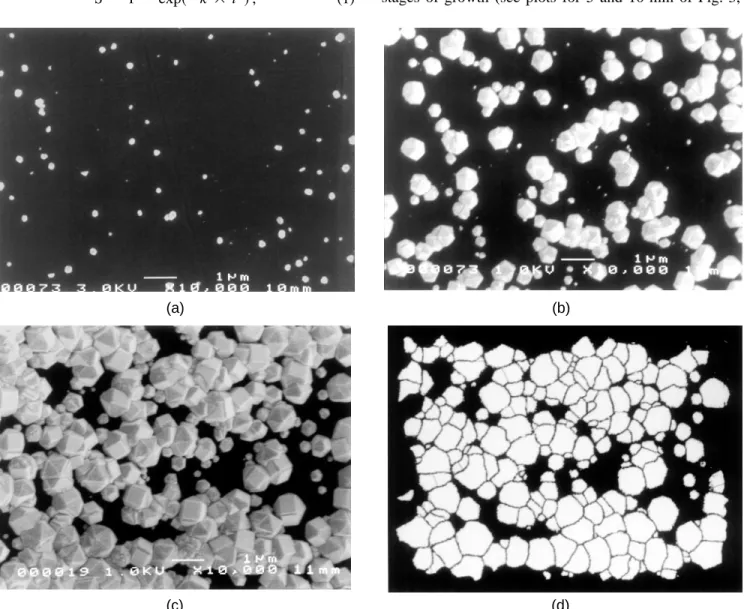
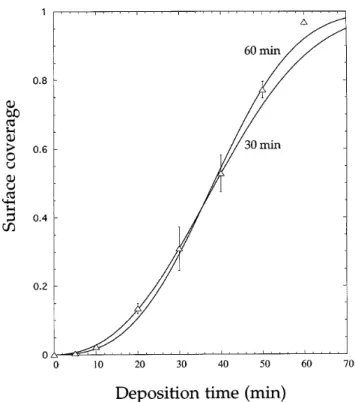
The morphological evolution of the diamond deposit is shown by Fig. 1. Prior to coalescence, particles com-monly exhibit equiaxed icosahedral or cubo-octahedral shapes. Particle impingement becomes important begin-ning from 30 min deposition time sS , 0.3d, requiring manual separation of the clusters for particle coun-ting, as explained before. After 60 min, the substrate is almost entirely coveredsS 0.97d. Surface coverage as measured from image analysis is shown by Fig. 2. Superimposed to the experimental data are two fits of the Avrami equation adapted to isokinetic phase changes11:
S 1 2 exps2k 3 tnd , (1)
where S is the surface coverage, t the duration of the phase change, and k and n are constants related to nu-cleation, growth, and particle shape. Equation (1) holds for constant or exponentially decaying nucleation rates. It becomes apparent from Fig. 2 that the experimental change of surface coverage cannot be described by a singular choice of constants. In fitting the data points up to 30 min, the range of shorter times is well reproduced whereas no agreement is achieved beyond. Including deposition times up to 60 min in the fitting procedure, agreement becomes unsatisfying both at short and long deposition durations. Both fits predict a much smoother approach to S 1 than shown by experiment. Besides, the power coefficient n of these fits varies between 2.5 and 3, indicating that particle formation is taking place until the substrate is fully covered.
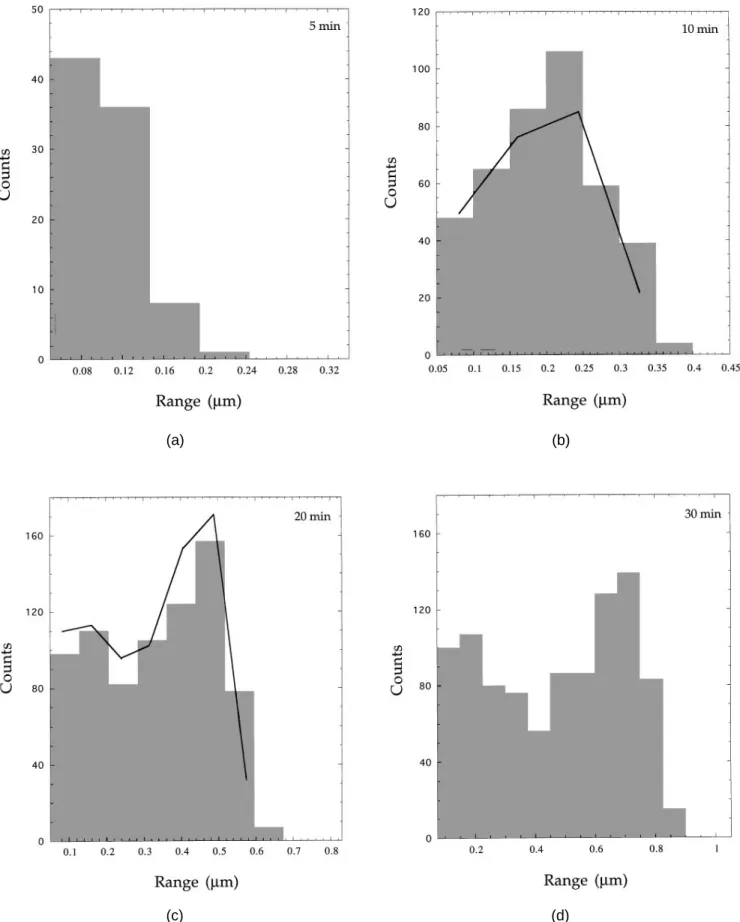
Concerning particle sizes in the substrate plane, a Gaussian-type distribution develops during the early stages of growth (see plots for 5 and 10 min of Fig. 3,
(a) (b)
(c) (d)
FIG. 1. SEM photographs for different deposition times: (a) 10 min, ( b) 30 min, and (c) 50 min; (d ) print of (c) after processing by the IBAS 2000 system.
FIG. 2. Surface coverage versus deposition time. (n) Experimental values; ( — ) Avrami equation fitted to surface coverage up to 30 min and 60 min. The error bars indicate the standard deviation of the measurements related to fluctuations in adjacent areas.
providing the maximum particle diameters). With in-creasing deposition time, this group of particles is shifted toward larger diameters without significant broadening or change of population, as can be seen by comparing the front group of particles in Figs. 3(c) – 3(f). The average sizes, dmax and dcircle, of the eight largest
particles have been plotted in Fig. 4, indicating that growth velocity in the plane of the substrate decreases gradually from 1.75 mmyh right at the beginning of growth to an almost constant value of about 1.36 mmyh in the range between 20 and 41 min. Identification of the largest particles on SEM photographs has shown that growth beyond 41 min sS . 0.5d is increasingly hampered by impingement. This explains why the lateral growth velocity gradually approaches zero. Prior to impingement, maximum particle size closely follows a
d, t0.87relationship. The particle size measurements of
Fig. 3 can be considered as accurate (error , 2%) as the surface fraction calculated by adding up the projected surface areas of the individual particles is in excellent agreement with the measurement of the overall surface fraction, S, given by Fig. 2.
After 20 min, a second group of particles appears at the low end of the size scale [Fig. 3(c)]. As observed by SEM, these particles seem to have been nucleated preferentially along scratches, contrary to the first group for which no such preferential sites can be identified. It is
concluded from computer simulation of particle growth, see below, that, by contrast with the first group, a large fraction of the second group grows very slowly. This effect creates a bimodal distribution of particle sizes [Figs. 3(d) – 3(f)].
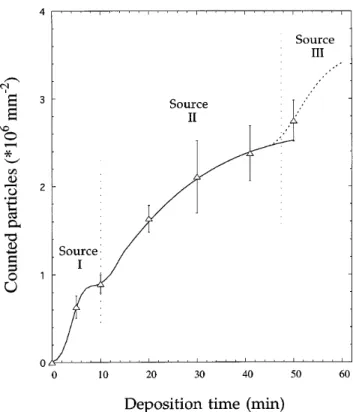
The overall particle density smoothly increases up to about 2.5 3 108 cm22, as shown by Fig. 5. It should
be noticed that the data points probably underestimate the real particle densities because clustering particles are able to create interfaces that are not necessarily detected by the cutting criterion. The spacing between subsequent data points seems too large to develop the details of this curve related to the three sources of particle formation (the next paragraph deals with the third particle source). Information about the early stages of deposition (<10 min), however, can be obtained if the particle formation rate between 0 and 10 min is back-calculated from the distribution given by Fig. 3(b), assuming that all particles of group 1 grow with the same velocity of 1.75 mmyh.7 In this case, a curve
similar to the continuous line in Fig. 5 is obtained, indicating that the source of group 1 particles is different from group 2 which is activated more slowly and which operates during a longer time interval. A treatment of size distributions .10 min is not feasible because the growth law is far from being uniform when group 2 particles appear.
No value for the particle density has been assigned to the sample with 60 min deposition time because particles begin to grow on top of each other and particle cutting no longer provides realistic results when surface coverage approaches 1. There is, however, strong experimental evidence for an avalanche of particle formation, desig-nated source 3, in the late stage of substrate coverage (close to 60 min deposition time): (i) After chemical dissolution of the silicon substrate, the bottom surface of continuous films of the present series (4 h deposition time) exhibits a very large number of small grains, in-compatible with an extrapolation of the size distribution at 50 min. (ii) On a second set of samples deposited under identical conditions, the same effect of avalanche particle formation has been observed. Figure 6(a) shows the microstructure at 91% coverage (intermediate be-tween the 50 and 60 min samples), which is charac-terized by an unexpected high number of small particles. The size distribution of Fig. 6(b), which cannot be accu-rate due to the problem of particle cutting at high surface coverage, substantiates this significant accumulation of newly formed particles.
B. Simulation
Particle formation frequencies used as input data for 2D simulation of diamond growth are determined according to the increments of particle densities, i.e.,
(a) (b)
(c) (d)
FIG. 3. Particle size distributions (maximum diameter, dmax) for different deposition times: (a) 5 min, ( b) 10 min, (c) 20 min, (d ) 30 min, (e)
41 min, and (f) 50 min. Full lines are simulated size distributions based on a growth velocity of 1.5 mmyh. Simulated and experimental distributions contain the same total number of particles.
(e) (f)
FIG. 3 (continued from previous page)
following the continuous line in Fig. 5 discussed earlier. In simulation, growth step intervals are equivalent to 3 min of experimental growth, i.e., about three times shorter than the time intervals for experimental structure sampling.
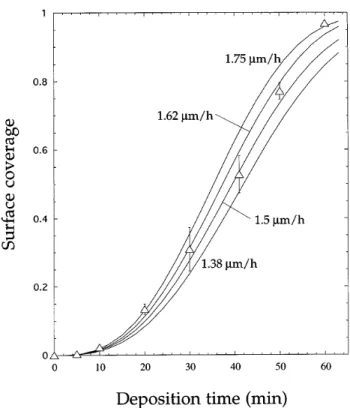
A linear growth law has been chosen; i.e., all par-ticles grow with the same velocity during the whole simulation procedure. Particle growth in the plane of the substrate has been simulated for velocities 1.38, 1.5, 1.62, and 1.75 mmyh (Fig. 7), corresponding to the range of experimentally determined values. For one growth velocity (1.5 mmyh), the sizes of the eight largest particles have been extracted from the simulated size distributions after successive growth steps and plot-ted in Fig. 4. In simulation, particles grow with constant velocity until the onset of impingement, a moment that accurately reproduces the experimental situation. The range of constant growth velocity compares well to the approximately linear range of experimental particle sizes. Once impingement has begun, growth velocity de-creases, but much less than in experiment because simu-lated growth continues into regions which in reality are occupied by new particles (avalanche). The avalanche effect has not been considered by simulation because particle formation rates were not available.
Simulated particle size distributions compare reason-ably well to their experimental counterparts as far as
front group particles (group 1) are concerned (Fig. 3). In the small and medium size range, simulation produces more large size particles than observed by experiment and does not reproduce the bimodal size distribution. The simulated populations are too low in the range of small particles. This discrepancy can be rationalized by assuming that, in reality, many small particles of group 2 lag behind the fast growing ones. Under these conditions, the previous assumption of a general growth law applicable to all particles turns out to be incorrect. However, this effect has been found to apply to group 2 only and not to group 1 particles.
As shown by Fig. 7, the evolution of surface coverage calculated with a growth velocity of 1.5 mmyh compares satisfyingly well with experiment up to
S 0.75. In the early stage of growth, i.e., prior to the
formation of group 2 particles (,20 min), agreement even is excellent if a growth velocity of 1.75 mmyh is chosen, which is more typical for this range. Later on, between 20 and 41 min, the experimental data points rise even more slowly than predicted by the curve with the smallest realistic growth velocity of 1.38 mmyh. Overestimation by simulation is to be expected because no distinction is made between group 1 and group 2 particles; i.e., all particles are supposed to grow with the same velocity. Nevertheless, the absolute error with respect to surface coverage is small because coverage is
FIG. 4. Detection of the largest particles: maximum diameter
sdmax, Dd and equivalent diameter (dcircle, 3). ( — ) Particle size
determined from simulated structures assuming a growth velocity of 1.5 mmyh: (1) dmax and (2) dcircle. The simulated curves do not
account for the experimentally observed time shift of 1.5 min.
dominated by the first group of particles having already developed a large amount of interface when group 2 particles just appear. At longer deposition times than 41 min, film closure (corresponding to 100% coverage) is accomplished much faster than in simulation which predicts the coverage rate to slow down significantly as a result of impingement. This discrepancy between simulation and experiment provides further evidence for the avalanche effect dominating film closure.
IV. DISCUSSION
It becomes obvious from the present study that substrate coverage in the case of MWCVD of di-amond is accomplished by a series of particle for-mation events and growth behaviors which cannot simply be modeled by classical nucleation and growth theories. This important observation has been recently confirmed by high resolution TEM investigations, indicating that different types of particle formation may occur simultaneously.16There is a first regime of particle
formation operating without any perceptible incubation time, which reaches maximum intensity after about 5 min of deposition or earlier, and which gives way to the second source after 10 min. The second source which is clearly distinguishable after approximately 20 min
is providing particles until it becomes superseded by the avalanche of new particles preceding film closure (source 3).
For experimental reasons, only particle sizes
.50 nm have been taken into account in this paper.
There is no direct evidence for any of the three particle sources being sources of nucleation as the critical size of a nucleus will be in the order of a single or a few carbon atoms only, disregarding the chemistry involved. Even if it is assumed that source 1 and source 2 produce Gaussian-shaped size distributions, these particles must not necessarily originate from nucleation processes, but may as well be interpreted by seed growth. Using high resolution SEM, Maeda et al.3 have studied the growth of an ensemble of seeds exhibiting a wide distribution of sizes. Their photographs clearly demonstrate that seeds do not begin to grow simultaneously or without incubation time. Only large-sized seeds develop into fast growing particles right from the beginning of deposition, while many of the smaller particles do not grow at all or are overgrown. Concerning larger seeds, one can see that these irregular-shaped diamond fragments first change into regular faceted crystals. By then, they have probably built up a sufficient number of growth sites like surface steps and re-entrant corners to continue growth. According to these observations, one should not rule out
FIG. 5. Total particle density versus deposition time as observed by image analysis. The hatched line for times .45 min designates avalanche particle formation. The data point at 0 min indicates that no particles .50 nm are detected after pretreatment.
(a)
(b)
FIG. 6. Particle avalanche prior to closure of a diamond film; (a) SEM image; ( b) Size distributionsdmaxd for about 700 particles, referring
to (a).
the possibility that both source 1 and 2 particles grow on predeposited seeds.
Concerning source 1 with incubation periods of about 2 min or less which also have been reported elsewhere,17 we suggest that diamond debris left from
the substrate pretreatment has seeded these particles. This argument is substantiated further by the time shift of about 1.5 min necessary to optimize all curve fits in this paper, which can be interpreted as reflecting the
FIG. 7. Surface coverage versus deposition time. (n) Experimental values; ( — ) simulated curves for linear growth rates of 1.38, 1.5, 1.62, and 1.75 mmyh. The simulated curves do not account for the experimentally observed time shift of 1.5 min.
existence of particles of finite size before deposition in the order of 40 nm in correspondence with our experimental growth velocity. Seeds of similar size have been observed by Maeda et al.3 Moreover, if source 1
were controlled by nucleation, it also would be difficult to understand why source 1 ceases its activity after only 10 min when surface coverage is still very low and particles are far apart. There is no such evidence for source 2, and one might be attempted to compare formation of these particles to the case of heterogeneous nucleation discussed recently by Tomellini et al.7 and
Ascarelli and Fontana.18 There, the number of nuclei
as a function of time describes a sigmoidal curve. In the present case, at best parts of such a curve can be observed as, eventually, source 2 is overrun by source 3. On the other hand, it is intriguing that the average growth velocity of group 2 is a few times lower compared to group 1. Since both kinds of particles grow in the same gaseous environment, the density of growth sites will presumably be different. One might argue that relatively large seeds obtained by fragmentation offer more growth sites than nuclei or tiny seeds lacking re-entrant corners and other kinds of growth-stimulating defects. In such a scenario, it wouldn’t be necessary to invoke heterogeneous nucleation in order to explain the preferential formation of source 2 particles along scratches. Under the concurring conditions of very
slow growth and attack by the plasma atmosphere, the role of scratches may be to protect very small seeds against etching rather than to provide sites for nucleation.
Particle formation during the avalanche period (source 3) occurs in front of and close to larger particles approaching each other, without being related to visible features on the substrate. Further evidence for the distinct nature of source 3 is gained by modeling: (i) In the case where the Avrami equation is used as before [Eq. (1)], i.e., assuming isokinetic conditions with one singular source of nucleation either constant or decaying with time and identical growth rate for all particles, film closure is not accomplished after about 60 min; see Fig. 2. (ii) Computer simulation of film coverage would require extensive nucleation for deposition times .50 min to reproduce the experimental data. Extrapolation of a hypothetical “nucleation rate” derived from the increase of source 2 particle density (Fig. 5) and the reduction of unoccupied substrate area,
s1 2 Sd, is insufficient, even if excessively high growth
velocities are used and all particles are allowed to grow equally fast. (iii) Once impingement has begun, the experimental growth velocity of the fastest particles is subject to a much stronger decrease than required by simulation; see Fig. 4. This can be explained only by avalanche particles barricading growth of larger ones.
Increased nucleation in the vicinity of diamond particles has been reported in the past, after pressing diamond crystals into refractory metal substrates,19 and along the circumference of diamond particles separated spontaneously from refractory metal substrates.20 In the latter case, minute diamond residues are supposed to act as nuclei for new growth, whereas the former case is explained by a much faster carbon diffusion rate from the diamond deposit as compared to the CH4 source,
increasing the local carbon concentration. Surprisingly, avalanche particles seem to grow with a similar velocity as group 1, suggesting that modified thermochemical conditions, which also might be responsible for inten-sified nucleation, prevail at the root of the interstices between approaching diamond islands where the free circulation of reactive gases might be altered. On the other hand, formation of group 3 particles seems to be common in MWCVD, as nearly continuous films produced by the hot filament technique generally exhibit more uniform particle distributions and more porosity at the interface between film and substrate.21 It would be
premature to infer an electronic effect from this observa-tion as simply the supersaturaobserva-tion with reactive species might be different. At present, more experimental data are required in order to gain insight into the avalanche effect.
The appearance of numerous small particles in touch with large ones commonly is interpreted as secondary
nucleation at the surface of existing particles. According to this investigation, it is very unlikely that secondary nucleation becomes important before the substrate is fully covered. Until ,90% surface coverage, particle formation on top of each other virtually does not exist; i.e., empty spaces on the substrate are filled prior to over-growth. Secondary nucleation only would be successful if the new particles grow much faster than their parents, owing to a preferential crystallographic orientation, for example (which would concern a very limited number of particles only), or the unlikely situation of a higher concentration of surface defects. In all other cases, they would be trapped by the advancing interface of the parent particle. Even particles forming during the avalanche period seem to nucleate on free substrate areas. Differen-tiation between the sites of particle formation, however, is limited in this late stage of growth by the small size of uncovered area.
So far, the slight deviation of source 1 particles toward lower lateral growth velocities with increasing deposition time, indicating that growth might not be con-trolled by the particle surface, has not been considered. From an investigation of particle growth up to a surface coverage of 0.9, Molinari et al.8 conclude that, as a
result of a high catalytic activity of the growing diamond surface for heterogeneous recombination of gaseous hy-drogen atoms, growth velocity gradually is reduced with increasing surface coverage. Decreasing growth velocity has not been confirmed by Ref. 17 however. Concerning the present paper, it is unlikely that the model pro-posed by Molinari et al.8 provides an explanation for the velocity changes observed. The variation of particle growth velocity with time evaluated according to this model in the surface coverage range S < 0.5, i.e., as long as impingement effects do not become dominant, does not describe the experimental situation whatever recombination rate for hydrogen is chosen.
Between 10 and 40 min, growth of the largest par-ticles can be considered approximately linear, and the assumption of a general linear growth law for simulation of surface coverage seems to be justified by the satisfying agreement with experimental data up to 50% coverage. Experiment and simulation fail to agree as far as particle size distributions in an advanced state of growth are con-cerned; see Figs. 3(e) and 3(f). The population minimum in the medium size range is not reproduced because no distinction is made between source 1 and 2 particles. The way size distributions alter with time suggests that the velocities of source 2 particles are widespread, a situation which is not covered by Molinari’s model.
Another topic of interest concerns the transition from particle growth, as related to two-dimensional substrate coverage to macroscopically unidirectional film growth. Contrary to lateral growth, the growth velocity in normal direction to the substrate appears to be constant. The
height of the largest particles after 60 min is 0.77 6
0.03 mm, according to SEM, and film thickness after
film closure increases with about 0.75 mmyh. Both
values correspond rather closely to the half of the diameter velocity in the substrate plane at the beginning of deposition; see Fig. 4.
For the purpose of comparison of particle and film growth, the evolution of the deposited volume as a function of time has been considered. As long as growth is not affected by impingement, the diamond particles are supposed to exhibit hemi-ellipsoidal shapes, the plane of sectioning being the interface with the substrate. The par-ticle volume is Vp 2y3 3 s 3 h, where s represents the base section and h the particle height which equals half the maximum particle diameter measured in the substrate plane, as explained before. For each particle,
s and h have been extracted from image analysis. The
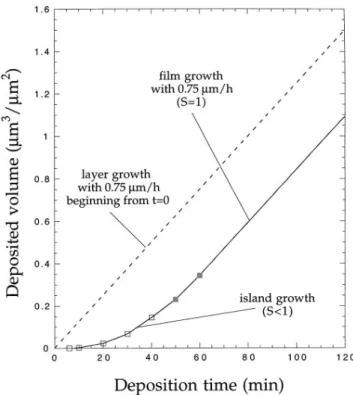
deposited volume obtained by adding the volumes of all particles within the reference area has been plotted in Fig. 8 (h) up to 47 min deposition time. With continuing closure of the substrate, i.e., when particles become adjacent to each other, thus sharing more and more interfaces, growth of the ellipsoids gradually is replaced by columnar growth and the particle diameter in the
FIG. 8. Volume growth as a function of deposition time. The straight line designated by layer growth is hypothetical (assuming no incu-bation time for nucleation) and describes film growth by successive deposition of atomic layers covering the whole substrate. (h) Cu-mulated particle volumes assuming hemi-ellipsoidal particle shapes and particle heights equivalent to dmax. (j) Volume increase obtained
by considering height and later growth of covered areas, including formation of new particles.
substrate plane is no longer representative of the par-ticle height. Therefore, a different approach of volume determination, consisting of calculating the volume in-crease for the time intervals between 41 and 50 min and between 50 and 60 min, has been chosen (full squares in Fig. 8). There are two contributions. On the one hand, substrate areas already covered at the beginning of the time interval (identical with substrate coverage,
S; see Fig. 2) grow in height by DH 0.125 mm per
time interval of 10 min (0.75 mmyh) and provide a
volume increase by S 3 DH. On the other hand, there are new particles forming, and covered areas extend in the substrate plane. Surface coverage thereby rises by DS, the difference of S at the beginning of two successive growth intervals, and the volume increases by a 3 DS 3 DH, where a is a geometrical factor accounting for the rounded shape of the shoulderssa
2y3d. This latter approach includes all particles, also
those from the avalanche effect, as no distinction is made between individual particles during the measurement of S.
The specific volume given by Fig. 8 can be in-terpreted as an effective film thickness, even if this notion only applies once the film has become continuous
sS 1d. It follows from the comparison between the two
curves for hypothetical layer growth and film growth via nucleation processes that the film growth rate is not given by the ratio between film thickness and deposition time simply, in particular when the total deposition time does not exceed largely the time needed for completion of substrate coverage. Obviously, the extent of this effect depends strongly on the course of nucleation.
V. CONCLUSIONS
This investigation has identified three different sources of particle formation in microwave plasma-assisted CVD: one source, which is exhausted after about 10 min, most likely consisting of seeds; a second one, operating over most of the deposition time, which might be interpreted as heterogeneous nucleation conforming to former reports7,18; and, finally, avalanche particle
formation in the late stage of surface covering. It is not unlikely that all three particle sources are controlled by growth rather than by nucleation. Secondary nucleation is insignificant for surface coverage.
There is no general growth law. Particles of the first group continue growing at an almost constant rate until impingement occurs. Comparison between experi-mentally determined and simulated size distributions has shown that a large fraction of particles appearing during deposition grow at a much smaller rate. The reduction of lateral growth velocity with increasing particle size, which has been reported earlier,8has been confirmed, but
the model. In this study, growth velocities are reduced mainly as a result of particle impingement.
Surface coverage is dominated by the first group of particles for which the assumption of a general linear growth law has been justified by computer simulation. The Avrami-type model used for simulation provides satisfying agreement with the experiment up to a sur-face coverage value of .0.5. Further refinement of modeling should include the change in growth velocities during the course of deposition. Avalanche nucleation, not accounted for by simulation due to the difficulty of quantifying nucleation rates, leads to more rapid film closure than predicted. By transforming the experimen-tal results of the two-dimensional analysis of surface coverage into three dimensions, the transition from three-dimensional particle growth into linear growth of film thickness can be described continuously.
ACKNOWLEDGMENTS
The authors would like to thank Mr. B. Senior for his care in doing the SEM work. Financial support by the “Kommission f¨ur die wissenschaftliche Forschung”, Bern (Switzerland), is gratefully acknowledged.
REFERENCES
1. S. S. Eskildsen, in 2nd Int. Conf. on the Applic. of Diamond
Films and Relat. Mater., edited by M. Yoshikawa, M. Murakawa,
Y. Tzeng, and W. A. Yarbrough (Tokyo, 1993), p. 297. 2. S. Iijima, Y. Aikawa, and K. Baba, J. Mater. Res. 6, 1491 (1991).
3. H. Maeda, S. Ikari, T. Okubo, K. Kusakabe, and S. Morooka, J. Mater. Sci. 28, 129 (1993).
4. P. A. Denning and D. A. Stevenson, Appl. Phys. Lett. 59, 1562 (1991).
5. Y. Avigal, Diamond Relat. Mater. 1, 216 (1992).
6. J. W. Kim, Y-J. Baik, and K. Y. Eun, Diamond Relat. Mater. 1, 200 (1992).
7. M. Tomellini, R. Polini, and V. Sessa, J. Appl. Phys. 70, 7573 (1991).
8. E. Molinari, R. Polini, M. L. Terranova, P. Ascarelli, and S. Fontana, J. Mater. Res. 7, 1778 (1992).
9. E. Molinari, R. Polini, V. Sessa, M. L. Terranova, and M. Tomellini, J. Mater. Res. 8, 785 (1993).
10. M. Tomellini, J. Appl. Phys. 72, 1589 (1992).
11. M. Avrami, J. Chem. Phys. 7, 1103 (1939); J. Chem. Phys. 8, 212 (1940).
12. W. Johnson and R. Mehl, Trans AIME 135, 416 (1939). 13. B. S. Mathis and A. M. Bonnot, Diamond Relat. Mater. 2, 718
(1993).
14. Y. von Kaenel, J. Stiegler, and E. Blank, Diamond Relat. Mater.
4, 972 (1995).
15. M. Cans, J. Stiegler, and E. Blank, unpublished.
16. N. Jiang, B. W. Sun, Z. Zhang, and Z. Lin, J. Mater. Res. 9, 2695 (1994).
17. R. A. Bauer, N. M. Sbrockey, and W. E. Brower, Jr., J. Mater. Res. 8, 2858 (1993).
18. P. Ascarelli and S. Fontana, Diamond Relat. Mater. 2, 990 (1993). 19. P. O. Joffreau, R. Haubner, and B. Lux, in Extended Abstracts No. 15, Diamond and Diamond-Like Materials Synthesis, edited by G. H. Johnson, A. R. Badzian, and M. W. Geis (Materials Research Society, Pittsburgh, PA, 1988), p. 15.
20. R. Haubner, A. Lindlbauer, and B. Lux, Diamond Relat. Mater.
2, 1505 (1993).