1
The complex nonstoichiometry of wüstite Fe
1-zO:
review and comments
Jean-Raymond Gavarri
1*and Claude Carel
21
University of Toulon, Aix Marseille Univ., CNRS 7334, IM2NP, Toulon, France. BP 20132, 83957 La Garde Cedex, France
* to whom correspondence must be addressed - e-mail = [email protected]
2 Honorary Professor, University of Rennes1, 2 rue du Thabor CS 46510, 35065 Rennes Cedex, France e-mail = [email protected]
Abstract
Thermodynamic properties and structural aspects of the nonstoichiometric wüstite Fe1-zO, and its modifications -
the so-called pseudo-phases - as functions of departure z from stoichiometry and of equilibrium temperature are reviewed from 1960 to present. The complexity of the equilibrium phase diagram is described in some details. The first order transition W W’ is specified on the iron / wüstite boundary near 1185 K. Transitions correlated to the modifications Wi at T(W)>1185 K and W’j at T(W’) <1185 K (i and j =1,2,3) are re-examined. Structural determinations based on the characterization of point defects stabilization and of their clustering are reviewed. Additionally, the pseudo-phases are examined based on the transformation of defect clusters or of their mode of distribution (i.e., percolation or superstructure) with the inclusion of changes in electronic charge carriers.
Keywords: wüstite, alpha-gamma transition, point defects, defect clusters, pseudo-phases, percolation
1. Introduction
The nonstoichiometric iron monoxide Fe1-zO is the main constituent of traditional blast furnace
slags. Historically, this oxide was the subject of numerous studies in the general context of iron metallurgy improvement, and for its role in the fields of recycling of industrial waste, catalysis and nanoparticles. Fe1-zO, also written equivalently as FeyO or FeOx, is named after the German mineralogical appellation “wüstit”1. The wüstite is considered of particular interest by the geophysicists because it is a constituent of the lower mantel of earth. This oxide is in a steady state, between an invariant point near 600 °C and its melting temperature around 1400 °C, under an equilibrium oxygen pressure p
’
in the range 10-25 to 10-6 bar. Its large iron deficiency is expressed by the departure of stoichiometry z [0.04 - 0.18] around 1400 °C and z 0.065 near 600 °C.Because of so many papers published before, numerous reviews about the nonstoichiometric wüstite are available in the literature. So, the present authors make choices of some of them or equivalent works:
Goodenough [1], Kofstad [2], Vallet [3], Burgmann [4], Gokcen [5], Men’ et al. [6], Spencer, Kubaschewski [7], Bauer, Pianelli [8], Sorensen [9], Hazen, Jeanloz [10], Gleitzer, Goodenough[11], Gokcen [12], Lykasov et al. [13], Mrowec, Podgorecka [14], Long, Grandjean [15], Sundman [16], Wriedt [17], Collongues [18], Gleitzer [19], Smyth [20], Desré, Hodaj [21], Worral, Coley [22].
2 Multiple studies have addressed the nature of the point defects (iron vacancies and interstitials) in wüstite, and the concept of defect clustering was systematically developed with a large variety of structural models. The NaCl face centered cubic structure of wüstite is characterized by a high rate of iron vacancies, and the existence of a certain proportion of iron ions occupying interstitial sites. Crystallographic determinations showed that these defects are not disordered in the lattice. Diverse models of clusters of iron vacancies and interstitials have been proposed.
Because it simplifies the structural description of defects, the oxygen site is assumed to be fully occupied (i.e., there is no significant amount of oxygen vacancies). Adopting the notation of Kröger and Vink [23], the formula of this monoxide can be developed as
Fe1-zO = (FeFe)(1-3z)(FeFe
°
)(2z-t)(Fei°°°)t(VFe q(
’
))( z+t)OO (1)
The ionic species Fe2+ and Fe3+, in octahedral sites, are noted FeFe and FeFe°.The Fe3+ cations in tetrahedral (interstitial) sites are noted Fei°°°. Iron vacancies noted
V
Feq (’
) can be charged negatively corresponding to q=2 or q=1, or neutral corresponding to q=0. Electric neutrality would result from electrons jumping in the conduction band or interacting with holes in the valence band. It can be recalled that the band gap of wüstite was recently evaluated at about 1.0 eV at 25 °C, which means that a large population of electrons in the conduction band and/or holes in the valence band can be expected at high temperature, depending on the oxygen partial pressure [24].In this paper, we review historical (1960-2014) observations and concepts for wüstite at equilibrium and in quenched samples. Then, we show how the complex nonstoichiometry of wüstite can be better described using mixtures of point defects and their associations in clusters which fall into order progressively at increasing z.
2. The complex behavior of wüstite
2.1. Early work (1921-1961)
In 1921, G. Chaudron worked in H. Le Chatelier’s lab. when he determined experimentally the external boundaries of the stable domain of ferrous oxide considered to be the daltonide ‘FeO’ [25]. Point C is at the intersection of the two boundaries, where three solid phases (Fe, Fe3O4 and ‘FeO’) coexist at equilibrium at 570°C, temperature that has been revised particularly by Raccah, Vallet, Carel [26-29], and that is named Chaudron’s point.
Jette and Foote demonstrated -measurements of the cell parameter and density- that wüstite was an iron deficient solid solution. They deducted that for the ionic compound, a missing Fe2+ was necessarily compensated by the oxidation of two other Fe2+ giving rise to electron holes Fe3+ [30].
Darken and Gurry studied in detail the phase diagram when determining the composition of wüstite chemically after slow quenching from °C= 1100, 1200, 1300 and 1400. The boundaries with iron and magnetite were determined down to Chaudron’s point. Additionally, the authors determined exhaustively the molar partial and integral thermodynamic properties of wüstite [31].
By comparison of calculated and experimental entropy values, Todd and Bonnickson, and Humphrey, King and Kelley deducted that the lacunary iron lattice envisaged by Jette and Foote was ordered [30] [32] [33].
Brynestad and Flood observed that some (electron holes) Fe3+ are necessarily located in tetrahedral sites written as [FeIIIO4] [34].
Using neutron diffraction analyses, Roth determined the proportion of Fe3+ occupying the tetrahedral sites of the fcc structure and concluded to the formation of clusters (2:1) constituted of two iron vacancies and one tetrahedral site occupied by a cation Fe3+ [35]. Tarte et al. also showed directly by I.R. spectroscopy the existence of these Fei°°°ions [36].
3 Using the formalism of the mass action law initially proposed by Carl Wagner et al. [37] [38], Brynestad and Flood [34], and subsequently Smyth [39] established a simplified expression linking the composition z to the equilibrium oxygen pressure as:
z
p’
1/s(2)
In a first attempt, Smyth characterized the defect structure of both Mn1-zO and Fe1-zO based on the
experimental compositional data from Darken and Gurry [31]. His work often referenced has been continued by many authors in different areas of the defect chemistry, particularly the study of the clustering.
2.2. Modifications or pseudo-phases W1, W2, W3
2.2.1. Raccah-Vallet’s team
During years 1962-65, three supposed « allotropic varieties » or « modifications » noted Wi (i=1,2,3) named later « subphases » and then « pseudo-phases » by other authors are discovered by Raccah (doctoral thesis [40]), Vallet, and Kléman additionally [41-45] from their experimental measurements. An initial layout of the corresponding phase diagram is proposed, based on coordinates (Θ °C, x) [26].
During their studies from 1961 to 1989, Vallet et al. establish correlations between mass variation, i.e., departure from stoichiometry expressed by x in FeOx, temperature T and oxygen partial pressure p
’
under equilibrium (see also [3]). They describe the phase diagram of wüstite FeOx above911°C through the following three equations connecting log p
’
noted l’
with the composition x and temperature T, and expressing the three thermodynamic behaviors or pseudo-phases W1, W2 and W3, successively [29]:W1 : l
’
= (46753.4T-1 - 7.3781).x + (-78825.3T-1 + 16.0613) (3a) W2: l’
= (- 9568.9T-1 + 31.1728).x + (- 18413.3T-1 - 25.2569) (3b) W3: l’
= (- 33238.9T-1 + 48.3669).x + (6883.9T-1 - 43.5669) (3c) To better relate the nonstoichiometry and equilibrium pressure p’
to the presence of defects (mainly cation vacancies and interstitials), we have expressed l’
as a function of z instead of x and we have reported l’
as a function of log z values. It can be recalled that these relationships derive from the general expression of equilibrium constants K(T) linking the composition z to the oxygen partial pressure p’
, following the basic setup:½ O2 OO + VFe q(
’
) + q h° (4a) with [h°] = q.[VFeq (’
)] = q.z, K(T) = {[OO].[VFeq(’
) ].[h°]q} / (p’
)½ = C .( zs / p’
)½ (4b) log z = (1/s).log(K(T)/C)2 + (1/s) l’
(4c)where C depends on q [39]. For iron vacancies expressed VFe, exponent q(
’
) indicates a charge q times minus; h° correspond to an electron hole. In the expression of K(T),
we have neglected the activity coefficients, considering that they are slowly varying with z in a limited composition range. The activity [OO] of oxygen on its site f cc is considered equal to 1 because no significant amount ofvacancies can be present in the oxygen lattice. Finally, we have taken into account the relationship -q.[VFeq(
’
)] +[h°] = 0 (electroneutrality condition) with [VFeq(
’
)] = z.
The equilibrium constants depend on the values 2, 1, and 0 of q. The three hypothetical corresponding values of exponent
s
should be 6 (q=2), 4 (q=1), and 2 (q=0) (more likely close to these values, taking into account the various approximations made). In the remainder of this review,4 exponent
s
is taken as characteristic of the specific equilibrium equation connecting the fractions of point defects between them.Let us note that the relationships between activities and compositions z are not strictly linear. They assume the existence of three domains and allow a comparison with classical models of defect equilibria. In each domain, a unique model of defect equilibrium is supposed to be valid, which is not strictly exact because of the continuous evolution of interactions between defects, as composition and temperature vary in the phase diagram.
2.2.2. Fixed temperature and variable composition
To illustrate the different behaviors or transitions between one and another in Fig. 1 below, we detail the relation log z vs l
’
(see relationship 4c) in the specific case of the Vallet et al. data, as obtained at 1000 °C (T=1273 K), using the relationships (3a, b, c) above, and transforming them into the following relationships:W1: log z = 0.2036 l
’
+ 1.7511
s
= 4.9 (±0.10) (5a) W2: log z = 0.1369l’
+ 0.8352 s
= 6.7 (±0.12) (5b) W3: log z = 0.1124 l’
+ 0.5246
s
= 8.9 (± 0.15) (5c)From the three segments observable on the curve l
’
vs log z in Fig. 1, we can derive threedifferent values:
s
(W1) = 4.9,s
(W2) = 6.7,and s
(W3) = 8.9. These values are similar to the ones found by Toft Sørensen and El Sayed Ali, and Rekas and Mrowec [46] [47]. In reality, there is no reason for assuming linear relationships given the probable existence of mixtures of defects, and of their continuous evolution conditioned by the changes in charge of VFeq(‘) (q=0,1,2).Fig. 1. The logarithm l’ of oxygen partial pressure p’ vs the logarithm of composition z
derived from the data [29] at 1273 K.
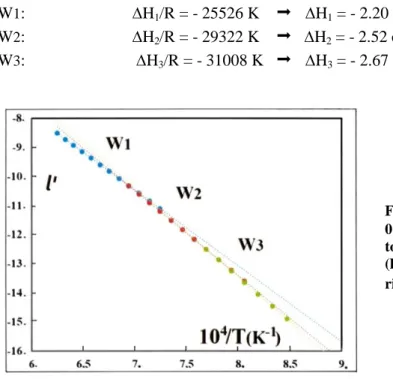
2.2.3. Fixed composition and variable temperature
For a fixed value x = 1.130 (z = 0.115), we report in Fig. 2 the experimental values of l
’
versus 1/T using the data of Vallet and Carel [29]. Three quasi linear domains can be distinguished suggesting the existence of three Gibbs free energies of reaction in relation with the equilibrium constant K(T), with the classical relationship G(reaction) = H – TS = - RT l nK . The linear correlations are:W1: l
’
= -2.5994(104.T-1) + 7.724 (6a) W2: l’
= -2.9226(104.T-1) + 9.9684 (6b)5 Using the simplified relationship (4b) without activity coefficients, we can derive the following relations for the fixed value z= 0.115 following:
log K(T) = (
s
/2).log z – ½ l’
+ logC = - (2/2.3026) G/RT (7a) dl’
/ d(1/T) = (2/2.3026) H/R (7b) From relation (7b), three values of enthalpies can be determined, linked to the changes in slopes and attributable to the pseudo-phases:W1: H1/R = - 25526 K
H1 = - 2.20 eV W2: H2/R = - 29322 K
H2 = - 2.52 eVW3: H3/R = - 31008 K
H3 = - 2.67 eVFig. 2. Variation of l’ vs 1/T for a fixed value z = 0.115: three quasi linear correlations corresponding to the initial determinations in the three domains W1
(high T), W2 (intermediate T) and W3 (low T) give rise to three activation energies Hi.
At the same time, a qualitative dilatometric study under CO2/CO indicates weak changes of slopes in curves
l
(T) with intersections located on the boundary W2/W3 [48]. In addition, several correlations between the cubic cell parameter obtained after quenching or in situ and the composition x in FeOxled correspond to the separation in three pseudo phases or subdomains of the equilibrium phase diagram [49] [50].In the equations above, we have neglected the activity coefficients, assuming that the ionic interactions remained constant as z varies. Another point of view would be to consider that a significant evolution of the activity coefficients can be observed and that the variation is associated with molar fractions [i] of point defects at equilibrium (the activity ai being proportional to the molar fraction: ai = i
.
[i]). In the case of ionic solids, these activity coefficients i are generally used to express deviations from ideal models of isolated defects at equilibrium.2.3. Abnormal behavior near 1184/1185 K
2.3.1. A splitting of the phase diagram
Vallet proposes a separation of an upper subdomain W of the phase diagram from the lower subdomain W’ on each part of the first order transformation -Fe -Fe [51]. Each subdomain is constituted of three pseudo-phases W’j below and Wi above 1184 K. Because the properties of W’ and W are distinct, the boundaries with - or -iron of the stability domains are also distinct. That is the reason for the existence of points B and A, at the upper and lower end respectively of the corresponding curves in the phase diagram (see [28], lines at 1184.15 K in Tables IV and V p. 723 and 724). The limit compositions on these boundaries yo(1) = 0.9427 or zo(1) = 0.0573, and y’o(1’) = 0.9528 or zo(1’) = 0.0472 of W1 and W’1 in equilibrium with Fe-O and Fe-O’are proposed at points A and B, respectively, both assumed at 1184 K, which cannot strictly occur as discussed below.
6
2.3.2. Thermodynamic inconsistency
In an extended and careful review published in 1991, Wriedt [17] asks questions about the isotherm at 1184 K, and its assumed continuity, while it seems to correspond with transitions Wi/W’j, i.e., with five sub-boundaries for the indexes 1/1, 2/1, 2/2, 2/3 and 3/3. Are they linked to the - Fe transformation? These pending questions have no answer until the 1980s.
The basic equations governing the various equilibria between gases and solid phases (see equilibrium diagram in Fig. 3) are listed below. Particularly at the two boundaries involving-Fecr or -Fecr (subscript ‘cr’ for ‘solid’, i.e., ‘crystallized’), equilibriacan be expressed:
1) on the boundaryFe/W’1 from point B to point C,
(1-zo(1’)) -Fecr + ½ O2 Fe1-zo(1’)O
K = exp (Go/RT) (8a) -Fecr Fegas
K(gas)= p(Fegas) (8b) (1-zo(1’)) Fegas + ½ O2 Fe1-zo(1’)O
K(, gaz)= exp -(Go1/RT) = 1 / (p(Fegas). p’
½) (8c) 2) similarly, on the boundary Fe/W1 from point A to melting,(1-zo(1)) -Fecr + ½ O2 Fe1-zo(1’)O
K = exp (Go/RT) (8d)-Fecr Fegas
K(gas) = p (Fegas) (8e) (1-zo(1)) Fegas + ½ O2 Fe1-zo(1)O
K(, gaz)= exp -(Go2/RT) = 1 / (p(Fegas).p’
½) (8f ) At the arbitrarily unique temperature of 1184 K, it is thus necessary to apply two different partial pressures p1 and p2 of Fe(gas), at equilibrium with the solid at points A and B. Obviously, at the uniqueFe equilibrium temperature, it exists only one value of the pressure p(Fegas) = 3.005x10⁻¹¹ atm. Thus, the points A and B cannot be at the same temperature. Correlatively, in the case of the points A and B differing in temperatures T(A) and T(B), the compositions zo(W)(A) and zo(W’)(B), the equilibrium partial pressures p
'
(A)and p2(A), p
'
(B) and p1 (B) of oxygen and iron gas are necessarily different. Finally, a small difference in temperatures, probably a few degrees, are to be determined experimentally in order to adjust this set of parameters, which determines the phase diagram (Fig.II-3) close to the stable temperature of the -Fe transition. In this situation, the bottom row in Table IV should be changed to a value of T(A) higher than 1184/1185 K, and the header line of Table V to a value of T(B) also higher than 1185 K, but lower than T(A) in ([28] p. 723 and 724).Note: If T(A) and T(B) differ from a typical value of 4 °C (see 2.3.4. Fe-O phase diagram close to 1185 K ), for example T(A) = 1191 K and T(B) = 1187 K, the partial pressures of iron are necessarily p(A)=p1=3.692 x10⁻¹¹ atm and p(B) = p2=3.220 x10⁻¹¹ atm
following tabulated data [52], [53], [54]. Thus, the differences between the two iron partial pressures is on the order of 0.4x10⁻¹¹ atm. The corresponding partial pressures of oxygen are p’(A) = 4.829 x10⁻¹⁷ atm and p’(B) = 4.229 x10⁻¹⁷ atm, i.e. a difference of 0.6 x10⁻¹⁷ atm. The compositions zo(A) = 0.0571 and zo(B) = 0.0468 correspond to a gap of 0.01 in composition.
2.3.3. Phenomena observed close to the isotherm at 1185 K
Experimental confirmations of this hypothetical separation exist in the literature. Several of them are interesting to be examined. Löhberg and Stannek separate the pre-exponential term a and the energy term b =
G/RT of an expression functionally similar to a Boltzmann distribution pH2O/pH2 = a.exp(b.z) expressed as a
function of T-1 in two segments intersecting in the vicinity of the Fe transition temperature in ([55] Fig. 8 and 9 p. 250).
Similarly, Janowski, Mrowec, Stokłosa separate in two segments the variation of the self-diffusion coefficient D*Fe of iron in wüstite as a function of T-1 from their own results and several sets from the literature in ([56] Fig. 7 p. 99). The intersection occurs for T-1= 8.28 x 10⁻⁴ K-1, i.e., at 935°C, of the segments attributed to W and W’.
7 Jacobsson and Rosén, Guillermet and Per Gustafson, Sjödén, Seetharaman and Staffanson, Grønvold
et al. publish new experimental thermodynamic data of highly improved accuracy about the molar
thermodynamic properties of iron and wüstite [57] [58] [59] [60].
Sundman, in an assessment of the entire Fe-O system, formulate a model for the ‘pure iron corner’ (solid solutions Fe-O and Fe-O’) [16]. The assessment of Spencer and Kubaschewski is also relevant in the same context [7].
A departure from a monotonous variation of the electromotive force of galvanic cells, near the
Fe transition, is evidenced from measurements at the iron/wüstite electrode, in several galvanic cells [57] [59]. In addition, authors [59] publish their numerous determinations of the electromotive force (e.m.f.) between 866.7 and 1339.3 K. An anharmonic transitional zone between two separate continuous variations, not in continuation of each other, can be identified in the temperature range [1186-1194 K].
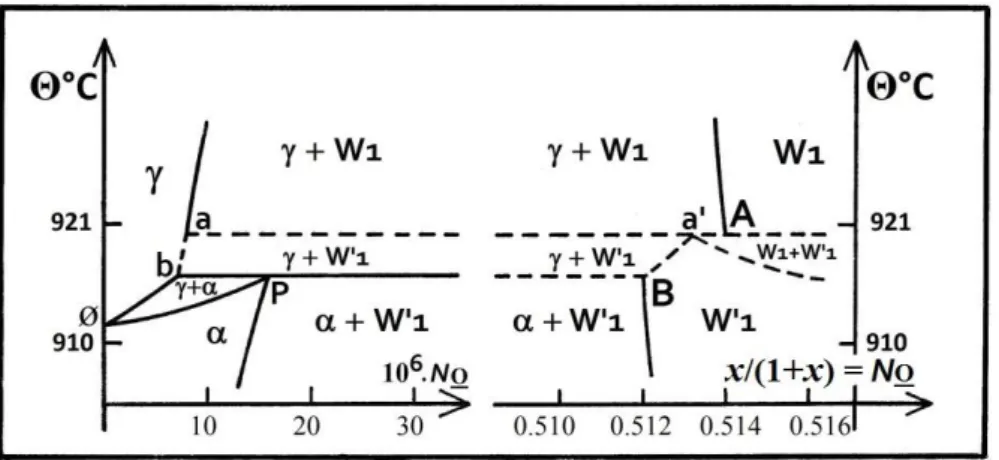
2.3.4. Consequences relevant to the Fe-O phase diagram
The Fe first order transition in the ‘pure iron corner’ of the phase diagram Fe-O is not documented sufficiently. The left side in Fig. 3 displays literature data (relative to FeOx) concerning the
domain of this transition [7] [16] [61]. The temperature of the strictly pure FeFe transition is tabulated at 1184 3 K in the data base NIST-Janaf (1999-2011) [54]. At present, it is generally taken to be 1185 K (point
ø
in Fig. 3).Fig. 3. Equilibrium diagram (FeOx) between W1 and W’1 and ‘pure iron’, with both limit points A and B of -Fe/W1 and -Fe/W’1 boundaries. Compositions NO = x/(1+x) are arbitrarily taken at 1184 K in paper [28].
Dashed lines correspond with hypothetical limits.
The Fe transitional enthalpy is known with a twenty percent dispersion from assessed and experimental data, (see [58] Table 3 p. 604). Very few experimental studies are available concerning the P(eritectoid) invariant point (Fe-O’, W’1, Fe-O) close to the temperature of the pure -Fe -Fe transition [61]. Sundman takes up the molar fractions ( at point P, ’ at point b in Fig. 3) of dissolved oxygen NO = x/(1+x) = 16 x 10-6 and 6.8 x10⁻⁶ in - and -Fe respectively at 1185 K or 912 °C [16] (Fig. 3).
The separation of the boundary iron/wüstite into parts Fe-O/W1 from point A and Fe-O’ /W’1 from point B arises distinctly in the temperature range characterized in [59], following the suggested phase diagram in the right part of Fig. 3. Two types of two-phase domains ( + W’1) and (W1 + W’1) have been added hypothetically as well as an invariant point a’ (W’1, Fe-O, W1). As of now, the location of points A and B remains to be determined precisely. New experimental data is necessary to confirm the preceding suggestions.
8 For the subdomain of W’ below 912 °C, the information equivalent to that of W above 912 °C is more difficult to access (see [44] Figs. 6 and 7 p. 12 and 13). An empirical relationship associated with the three W’j requires a curvature term. The analytical expression has been taken as follows:
l
’
= (a’jT-1 + b’j) x2 + (c’j T-1 + d’j) x + (e’j T-1 + f’j) (9) The corresponding coefficients (a’j - f’j) are available numerically in ([29] Table 1 p. 210).Fig. 4. Phase diagram °C (l’, x) of solid wüstite FeOx under equilibrium following Raccah-Vallet-Carel; upper
temperature 1250 °C, lower one 592 °C at point C; coordinate l’ for log10p(O2). Points noted by a capital letter are tabulated in [27], except the point in [28] and the point T in [62] [63] [64].
The sets of numerical relations detailed above for l
’
as functions of x and T-1 allow the determination of the transition lines or boundaries between domains of the pseudo-phases W1, W2 and W3, from -iron to magnetite between 912 and around 1400 °C, and W’1, W’2 and W’3, from -iron to magnetite between 912 and 592 °C, at point C, as drawn in Fig. 4 (see precedent drawings [26] [27] [29]).2.4. First evidences of phase modifications or pseudo-phases in the literature
2.4.1. Wagner jr’s team
In the course of (thermodynamics - defect structure) approaches by Carl Wagner, Wagner jr et al. study the electrical conductivity at equilibrium as function of log pO2 [65]. With the help of their own thermogravimetric data l
’
(x) [66], they state that the composition of the break on their curves (x) well agree with that of the transitions Wi Wi+1 determined in Raccah’s work. So, the pseudo-phases are identified at equilibrium outside of Vallet’s group for the first time (see [65] Table IV p. 955; also Annex A Fig. A1 a-). The further studies of Wagner jr’s group about wüstite were concerned with transport phenomena in the bulk and on the surface, in relation with the p to n transition.2.4.2. Fender and Riley
From numerous accurate electromotive force measurements (e.m.f.) in galvanic cells, Fender and Riley [67] brought the second experimental confirmation, outside of Vallet’s team, of the likely existence of
9 three pseudo-phases, and the location of the boundaries of the subdomains in the range 700-1350 °C. Their plot of the equilibrium diagram is in fairly good agreement with that of Vallet et al. (see Annex A, Fig. A2). 2.5. Partial molar enthalpies and entropies. Convergence point
Fender and Riley, then later Vallet and Carel assessed the partial molar properties of an oxygen solid solution (HO HO - ½ H°O2, SO SO - ½ S°O2) as functions of x [1.058 -1.172] for the three pseudo-phases Wi (i=1,2,3) named also wI, wII and wIII (see [67] Table I p. 796, and infra in Figs. 5 and 6). The following relations were formulated in [28] for the three Wi (i=1,2,3) at T >1184 K:
HO = 19.14475(ai.x + ci), (10h)
SO = -19.1447 (bi.x + di) (10s)
Fig. 5. HO from some authors. ─ : derived for the Wi (i=1-3) i.e. at T [1193 - 1523 K] from
thermogravimetry + CO2/CO [28]; : w I, - - : wII, and : wIII (two points only) by emf at T [1023-1623 K] [67]; dash-dot line -.-.-: by calorimetry at 1348 K under vacuum (+ nO2) [68];
: by emf at T [873-1273 K] [69]; : by thermogravimetry + CO2/H2 at T [1373-1673 K] [70]; : by emf at T [823-1323 K] [71]; : by emf data at T [873-1373 K] [72] [13].
and, for the three W’j (j=1,2,3) at T< 1184 K:
(HO)’ = 19.14475 (a’j.x2 + c’j
.
x + e’j) (11h)(SO)’ = -19.14475 (b’j.x2 + d’j.x + f’j) (11s) Relations (10) for the Wi, and (11) for the W’j are independent of T, in accordance with the property of regularity ([12] p. 81-85) of the solid solution wüstite identified in [41] but contested in [68]. HO is represented in Fig. 5 from numerous available data sets. A convergence in the vicinity of the common intersection point at x = 1.0713 (0.001) of the straight lines HO(x) from (10h) is globally noticeable. Contrary to this contrived amalgamation process, the numerical adjustments presented next are related principally to the initial results from Raccah [40] to [44] which form a well populated and coherent data set at equilibrium, and for which it exists now a systematic interpretation by Vallet’s group [27] [28] [29], and experimental confirmations [65] [67] [73].
The graphical representation of the relations (10h) and (11h), (10s) and (11s), in the case of the isotherms at 1000 and 820 °C, is given in Fig. 6. Along the isotherm at 1000 °C, the three Wi are represented by successive linear segments. For the two transitions Wi Wi+1 at decreasing iron content, a jump is observed toward the lower molar heat and entropy of solution which are exothermic and exo-entropic. For x1/2 = 1.0782: (HO) = -3.5 kJ, (SO) = -2.3 J. K-1, and x2/3 = 1.1154: (HO) = -10.5 kJ, (SO) = -8.3 J.K-1.
Above 1184 K, the exothermic HO for W1 increases with x and z corresponding to oxygen dissolution. For each O a vacancy and zero, one or two electronic holes are created simultaneously as the
10 clustering is in progress (see equation (4a)). For W3, HO is decreasing with x, probably because of the formation of long-range ordering. For W2, HO varies in a manner intermediate between that for W1 and W3, which corresponds to the observation that W2 is a solid solution of W1 and W3 [67].
Fig. 6. Partial molar enthalpy (HO - ½HoO2) and entropy (SO - ½S°O2) of solution of oxygen, through the stability
field of wüstite,whatever the temperature. Transitional jumps are at 820 °C (W’i) and 1000 °C (Wi). Dashed lines are drawn in extrapolated or metastable zones.
Along the isotherm at 820 °C, the three W’i are represented by parabolic curves. Jumps (weaker in amplitude than the ones at 1000 °C) are observed toward higher values for the molar exothermic transitions W’jW’j+1, x1’/2’ = 1.071: (HO)’ = +10.9 kJ, (SO)’ = +6.3 J.K-1 and x2’/3’ = 1.1154: (HO)’ = +2.9 kJ, (SO)’ = +2.7 J.K-1. A convergence of parabolas HO
’
(x) is observed for x = 1.0852 or y = 1-z = 0.9215 (0.004). This convergence occurs for a composition different (y =1.3 10-2)from that of point C (y = 0.935), and is not defined as precisely for W’ as it is for W.The Gibbs-Duhem relation leads to the iron solution property HFe from HO (Fig. 7).
Fig. 7. Variations of the partial molar enthalpy (HFe - H°Fe) vs x for the isotherms at 1000 °C (Wi)
and 820 °C (W’j). For comparison: - . -: H Fe from e.m.f. measurements at 1000 °C by Asao et al.
([69] Table 3 p. 75); : Darken and Gurry determinations ([31] Table X p. 1408).
In the domain of W, exothermic transitional jumps are observed toward the higher values for the two transitions Wi Wi+1 at equilibrium. At 1000 °C, the transition W1/W2 (x1/2=1.0782) is characterized by
(HFe)1/2 = 3.25 kJ.mol-1, (SFe)1/2 = 2.56 J. K-1.mol-1. The transition W2/W3 (x2/3=1.1164) is characterized by (HFe)2/3 = 12.06 kJ.mol-1, (S̅Fe)2/3 = 9.47 J.K-1.mol-1. In the domain of W’, the equivalent jumps are exothermic as shown in Fig. 7 drawn for transitions at 820 °C.
11 As iron deficiency increases, the partial molar enthalpy of solution of iron HFe decreases for W1 and increases for W3, variations that are opposite to that of HO. The five determinations of Asao et al. at 1000 °C are distributed on a curve noticeably parallel to the set of the successive segments concerning W1, W2 and W3 [69].
Equations xi/i+1(T) of the lines -the so-called boundaries- separating the domain of stability of single
pseudo-phases Wi and Wi+1 were adjusted following the analytical equations:
xi/i+1 = [(ci+1 - ci ) + T.(di+1 - di)] / [(ai – ai+1 ) + T.(bi – bi+1 )]
(see [26] p. 3680, equations (6)). Numerically, they are adjusted now to
x1/2 = (60412.0 - 41.3182T) / (56322.3 - 38.5509T) (12) x2/3 = (25297.2 - 18.310T) / (23670.0 - 17.1941T) (13) A metastable boundary can also be envisaged
x1/3 = (85709.2 - 59.6282T) / (79992.3 - 55.7450T) (14)
The authors in [43] remarked that the corresponding terms in the numerator and the denominator [of equations (12), (13) and (14)] are almost exactly proportional in a same ratio of 1.07, i.e., (ci+1
-
ci) / (ai-
ai+1) = (di+1-
di) / (bi-
bi+1) 1.07, also close to Chaudron’s point composition. It results that the three pseudo-phases are under equilibrium at T (K) under the same oxygenpressure
for a composition x 1.07 (e.g., p’
8 x10 -17, 4 10 -15 or 8 x10 -11 atm at 1184, 1273, or 1573 K respectively), irrespective of index i. This result constitutes the reason why the property HO (= -274.8 kJ.mol-1) of equation (9h) is shared by the three Wi's with the same composition x 1.07 under the same equilibrium oxygen potential. The convergence at point results of that fact. The iron partial molar properties converge also for H̅Fe = +87.8 kJ.mol-1 at 1000 °C. At invariant point C (-Fe, W’1, Fe3O4) of abscissa xC = 1.0700, these properties are merged (HO = - 290.4 kJ.mol-1and HFe = + 21.4 kJ.mol-1 ).It is noticeable that a common « kinetic origin » is characterized by x = 1.070 0.001 in W’ (see Annex 2 « Re-analysis of kinetic data at 850 °C», derived from the experimental results [73]).
2.6. The triple point (W1, W2, W3) out of equilibrium
The point 8 (W1, W2, W3) was determined as the intersection of the extrapolated boundaries W1/W2 and W2/W3 at temperature 302 °C and composition y = 0.9322, directly below point and point C (yC 0.9350) (see [26] Table III and Fig. p. 3681).
Manenc et al. observed a disproportionation near 300 °C, in a miscibility gap, by inducing a slow drop in temperature [74-75]. Fender and Riley remarked that wII (W2) behaves [(GO vs 1-x)/T] in its specific region as a two-phase system above its critical temperature. Similarly to Vallet and Raccah [26], they remarked that the extrapolation into the metastable domain below point C shows the phase separation into wI (W1) and wIII (W3) in the vicinity of 315 °C » [67].
As early as 1977, Andersson and Sletnes studied conjointly the ordering and the preceding behavior below 300 °C, in reference with the spinodal decomposition using electron diffraction and microscopy (dark field images) [76] [77]. Typical patterns were attributed to the phase P
’
(periodicity of 2.6ao), in the composition interval y (of FeyO) [0.95-0.92]. After heat treatment for 20 min at 300 °C, a tetragonal ororthorhombic symmetry was observed which can be compared to ordered P
’
-type regions. For compositions less than y = 0.91 in Fe0.91O (z ≥ 0.09), the more ordered structure identified as P”
was observed even after quenching. Its parameters are a = b = c = 5ao.These different observations indicate that W2 can be represented as a solid solution of W1 and W3, consistent with the determinations of [HFe (x)]i
e
12 2.7. Trends to ordering at increasing z
The difference [HFe( x) ]i e
between the partial molar enthalpy of iron in (FeOx)i and FeOxo(i) on the boundary with Fe was envisaged as an excess type property in order to tentatively establish links between thermodynamic and defect structure properties [45]. The corresponding relations, using the previous formalism established for [HO( x) ]i,[HFe( x) ]i,[SO(x) ]i and [SFe( x) ]i leading to Figs. II-6 and II-7 above, are simply:
[ HO( x ) ]i e
= [HO(x) - HO(xo)]i = 19.14475(ai/2(x - xo(i))) (15h)
[SO( x ) ]i e
= [SO(x) -SO(xo)]i= -19.14475(bi/2(x - xo(i))) (15s) [ HFe( x ) ]i
e
= [HFe(x)- HFe(xo)]i = -19.14475(ai/4(x2-xo(i) 2
)) (16h) [ SFe( x ) ]i
e
= [SFe(x) -SFe (xo)]i = 19.14475(bi/4(x2-xo(i) 2
)) (16s)
Substituting the coefficients ai, bi and xo(i) on the -Fe/Wo(i) boundary by their numerical values yields Table 1. The sign of the term [HFe( y) ]i
e
as well as the sign of its derivative /x is the sign of
-a
i. This termcorresponds to the energetic effect U on the iron lattice for the interaction between each additional O and a mole of FeOx into which it is dissolved (at constant iron content), a vacancy and zero, one or two electronic
hole(s) being created (see supra relations 4a-4c).
Table 1 - Variations at 1273 K of excess properties [HO]i
e and [SO]i e . FeOx/Fe1-zO x=1.0950 or z=0.0868 x=1.1420 or z =0.1243 W1: a1= 46753.4 b1= -7.3781 xo(1)= 1.0572* z o(1)= 0.0541 [HO]1 e [HFe]1 e ** 16.90 -18.19 [SO]1e [SFe]1 e ** 2.67 -2.87 [HO]1 e [HFe]1e 37.94 -41.72 [SO]1 e [SFe]1e 5.99 -6.58 W2: a2= -9568.9 b2= 31.1728 xo(2)= 1.0522 z o(2)=0.0496 [HO]2 e [HFe]2 e -3.92 4.21 [SO]2e [SFe]2e -12.78 13.76 [HO]2 e [HFe]2 e -8.23 9.03 [SO]2 e [SFe]2e -26.80 29.41 W3: a3= -33238.9 b3= 48.3669 xo(3) =1.0482 z o(3)=0.0460 [HO]3 e [HFe]3 e -14.90 15.97 [SO]3e [SFe]3e -21.68 23.24 [HO]3 e [HFe]3 e -29.85 32.69 [SO]3 e [SFe]3e -43.44 47.57 * For x= xo(i), all terms are equal to zero. ** The terms [HO]i
e
and [HFe]i
e
are expressed in kJ.mol-1, and the terms [SO]i
e
and [SFe]i
e
in J.K-1.mol-1.
The values of [HFe]i e
in Table 1 show that:
1) for W1, the internal energy Um of the iron lattice (the term PVm is negligible compared to the contribution Um in Hm) decreases as z increases, which corresponds to the exothermic formation energy of clusters (m:n) that are thus favored (see Gokcen [5] p. 241-44, and [12] p. 42-44, and Desré and Hodaj [21] p. 91-96).
13 2) conversely, W3 is characterized by an increase in the lattice energy, which corresponds to the completion of the cluster percolation and the formation of the superstructure (2.55a x 2.55a x 2.55a) named P
”
by Manenc and characterized using HREM by Iijima [75] [78] [79].3) likely because W2 is more than likely a solid solution of W1 and W3, the variation of Um is intermediate.
Such trends were discussed previously by Fender and Riley when considering GO and HO in ([67] p. 797). The positive and negative values of the term [SO]i
e
(see Table I) correspond mainly to a vibrational entropy change in the oxygen sublattice [20] [70] [80]. In the case of the initially disordered pseudo-phase W1, the excess entropy term weakly increasing with z shows that the disorder due to the formation of point defects is predominant. Reversely, in the case of the pseudo-phase W3, increasing short- and long-range orderings would be associated with increasing z values as indicated by a strong decrease of [ SFe(x)]3
e
. These entropy variations are related to the increasing frequency of the Fe-O bond because of larger clusters and/or an increasing degree in their percolation until completion and superstructure. The pseudo-phase W2 can be thought to appear at the starting threshold of the percolation of clusters, when the lattice becomes more rigid.
3. Several approaches of investigation
3.1. Burgmann’s review
In 1968, this author gathers some experimental results (electrical conductivity and transition p-to-n). Because of numerous analogies with pyrrhotine Fe1-zS [81], he describes tentatively the defect structure in
terms of clusters (see [4] Fig. 5 p. 173). He proposes a conduction model involving the formation of an acceptor band or of new states produced by the interaction of defects as z increases. The lattice contraction at increasing z reduces the gap between the valence and conduction bands, inducing a p-to-n transition for compositions z= 1/12 = 0.083 at 900 °C and z = 1/13 = 0.076 at 1300 °C ([4], Hillegas [82]). Such an overlap is also considered later by Molenda, Stoklosa and Znamirowski [83].
3.2. Manenc’s phases P, P
’
, P”
As the most important result of a seminal work, Manenc describes three types of « phases » named P, P
’
and P”
. He characterizes them after (rapid) quenching into water using X-ray diffraction. For an iron rich wüstite (z < 0.08), vacancies and ions Fe3+ seem to be randomly distributed. This corresponds to the phase P which has a weakly incomplete NaCl-type structure alone. Other diffraction patterns of more iron deficient samples (0.08< z < 0.11) have additional reflections corresponding to a cubic cell with a repeating distance 2.6ao. Diffuse trails parallel to 100 directions connect these reflections. These features are characteristic of the phase P’
alloyed with the phase P, and individually observed only in « oxygen rich » samples. Iron vacancies are ordered in the two phases [75, 78].Diffraction for a heated single crystal such as z = 0.08 shows that a superstructure exists in the range 800-1000 °C for this composition. The phase P
’’
is observed in wüstite such as z 0.10 near 300 °C and when slowly cooled, at the threshold of disproportionation yielding Fe and Fe3O4. New superstructure lines are thencharacteristic of a commensurate 5X cubic cell [75, 78]. 3.3. Mössbauer spectroscopy
Greenwood and Howe [84] interpret Mössbauer spectra in modeling the asymmetrical doublet as evidencing the differing defect structures of the pseudo-phases identified by Vallet and Raccah [44], and Fender and Riley [67] at high temperature. The quenching process produces nuclei leading to Manenc phases P, P
’
, [(P+P’
) for z [0.05-0.08], (P’
) for z [0.08-0.10], and (P’’
) for z > 0.10] below point C. The phases are detectable from fine variations of quadrupole splitting resulting from cubic symmetry distortions. These distortions can be evaluated for the single cluster (4:1), and the Koch and Cohen cluster (13:4). From a sample14 such as z 0.05, the disproportionation gives rise to Fe0.918
O
(defect rich phase P’
) and Fe0.976O (defect poor phase P), because of a mixture of the (13:4) and (4:1) clusters.Among numerous other Mössbauer studies reviewed by Long and Grandjean [15], Romanov, Checherskaya and Tatsienko [85] [86], Hrynkiewicz et al. [87], Pattek-Janczyk et al. [88], this latter is of particular interest. The authors modeled the asymmetric doublet with a singlet attributed to Fe3+ in tetrahedral sites, and two doublets attributed to octahedral Fe2+ and Fe3+. They associated the maximum observed in the variation of the quadrupole splitting to the p-n transition described by [89]. This transition is likely the same as the transition « metal Mott insulator » identified by Molenda, Stokłosa and Znamirowski [83].
Aldon and Jumas use the Mössbauer spectroscopy to evaluate precisely the reversible insertion of lithium and the effects on the local and long-range orderings of the wüstite lattice. They characterize the lithium as « an actor of electronic pressure » (see infra [110] in section 4.3. Nanocomposites. Epsilon-Fe). 3.4. First electronic-structural modeling
Goodenough’s modeling [1] is proposed as early as 1971. Considering the relations (2) associated with thermogravimetric analyses, and relation
p’
1/s (17) corresponding to the conductivity [65], the results
=6 in the W1 subdomain above 1060 °C characterizes a statistical distribution of vacancies and electronic holes (Fe3+), possibly corresponding to Manenc’s phase P. Below 1060 °C, the changes in values ofs
correspond to an increasing association between vacancies and holes. In the W2 domain, triplets Fe3+ - VFe - Fe3+ are partially ordered, improving Madelung energy. Numerous (4:1) clusters which form a superstructure according to Koch & Cohen (see infra section 7.2. The historical cluster (13:4) and [130]) correspond to W3. A mapping of the transfers of iron ions, and electronic exchanges is proposed as a mechanism, needing small polarons related to energy differences between the top of the valence band and an acceptor level [1]. Later, this author with Gleitzer will consider the wüstite again from the point of view of its electronic properties and crystallographic structure. They will express some doubt concerning the role of the cluster (4:1) as only building unit of larger clusters (see [11] p. 51-4).3.5. Zvintchuk’s team
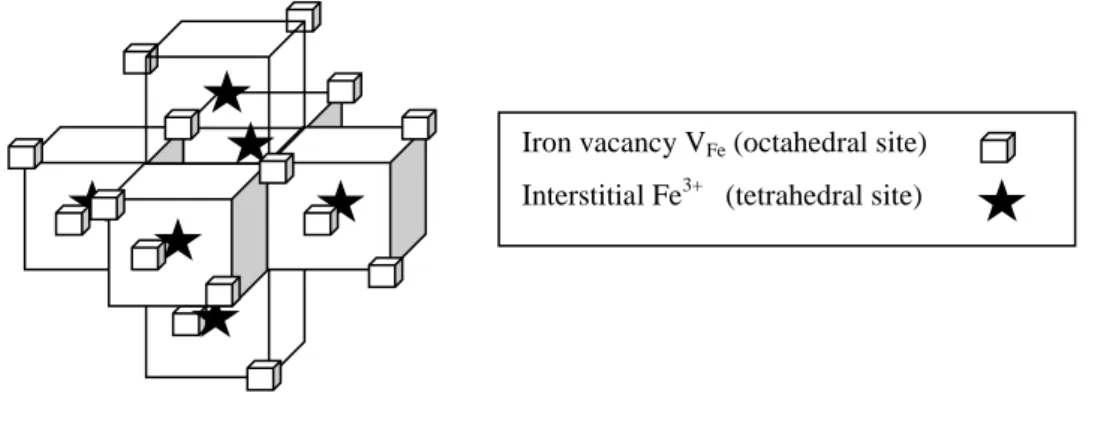
In 1973, Tchiong Tki Khong in Zvintchuk’s team, in collaboration with J. Manenc, studies samples of wüstite of composition z [0.065-0.108] quenched from 1100 °C [90]. Electron diffraction reveals three forms I, II and III corresponding to the modifications wI, wII and wIII of the phase diagram by Fender and Riley [67], and to the phases P, P
’
, P’’
. A correspondence with the three Wi is specified. The authors describe a defect complex (16:6) of point symmetry m3m, formed of six tetrahedral corner sharing clusters (4:1) distributed on the six faces of an empty cube. This cluster is represented on Fig.8.
Fig. 8. The m3m cluster (16:6) of <110> type corresponding to (z+t)/t = 2.66 (from ref. [90]). Iron vacancy VFe (octahedral site)
15 A later work by Shaïovitch, Zvintchuk and Vergazov describes a superstructure with a quadratic cell P4 3m for a wüstite Fe1- 0 .10O [91].
3.6. Worral and Coley. Isotopic kinetic transitions
More than 40 years after Raccah, Vallet et al. [26, 41-44, 48-49], Wagner jr et al. [65] [66], and Fender and Riley [67], Worral and Coley evidence kinetic transitions related evidently to the pseudo-phases [73]. Following the process first used by Temkin et al. at the surface of iron oxides [92-93], and then applied by Grabke [94], Cramb and Belton [95], Mori, Morita and Sano [96], later by Zhang et al. [97] [98], Worral and Coley study the kinetics of the carbon exchange in the equilibrium W/(CO2/CO mixtures) in which a controlled proportion of 13CO2 species was introduced. In such an environment, a specific equilibrium of the carbon isotopes is established following:
13
CO2 + CO
13
CO + CO2
which can be viewed as the sum of the two half-reactions: 13
CO2
13
CO + Oads and CO + Oads CO2
as reflecting oxygen exchange on the surface of the sample and being conditioned by the electronic structure in the bulk. The apparent rate constant is expressed as a function of oxygen activity aO as follows:
ka = k0.aO- m or log ka = - m.log aO + logk0
(18)
The variation of log ka with the activity aO defined as being the ratio p(CO2)/p(CO), can be described by
three successive linear segments at 995 °C, with m = 0.51 (w1), 0.66 (w2), 1.03 (w3) in ([73] Fig. 8 and equations [36] [37] [38] p. 820-1).
The authors observe only one transition attributed to two pseudo phases w’1-2 and w’3 along the isotherm at 850 °C, no change being observed in the vicinity of the forecasted boundary w’1/w’2 by Vallet and Carel [27]. The only observed transition appears as a discontinuity at the location of the transition W’2 W’3 forecasted for x = 1.090 at equilibrium. Nevertheless, the authors state that three pseudo-phases w’1, w’2 and w’3 probably exist, but that two of them could not be separated, either because they were not detectable by electrical conductivity measurements as found before in [65], or because they were possibly « obscured by the scatter ». Finally, Worral and Coley declared that, in their study, transitions at 850 °C and 995 °C were observed « correspond[ing] exactly with the proposed pseudo-phase boundaries in quite good agreement with the phase diagram by Vallet and Carel». Because of the identity of coefficients m in the correlations concerning Wi and W’j for i=j, they attributed in a following review [22] three predominant clusters (7:2) type II to w1 and w’1, (12:4) type II to w2 and w’2 and (16:5) type I to w3 and w’3.
Note: In Annex B and Fig. B2, a graphical and numerical re-analysis of Fig. 9 by ([73] p. 821) shows a possible separation of the data in three sets at 850 °C, which correspond likely to the three W’j, provided that some data or groups of data are located in subdomains not proposed as stable. In Annex A, Fig.A1, the location of the observed transitions is represented by the set f-).
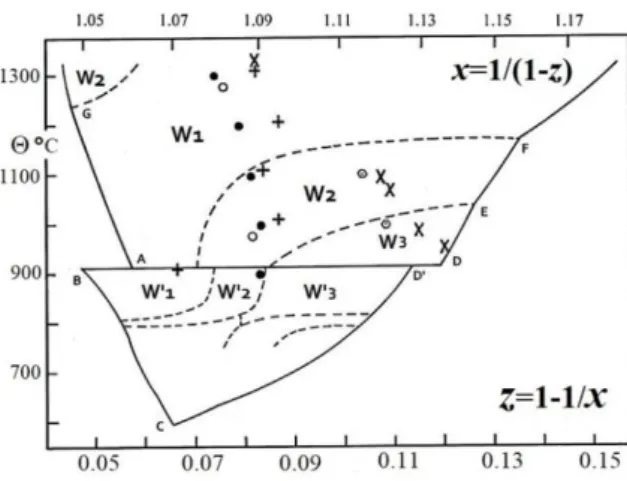
3.7. Takayama and Kimizuka’s phase modifications
Using thermogravimetric analyses under equilibrium oxygen pressure p’ defined by CO2/H2 mixtures,
Takayama and Kimizuka observe significant modifications in curves representing l’ vs log x in FeOx [70]. The authors conclude to the existence of a transition between pseudo-phases (see [70] Table I and Annex A Fig. A1 d-). Typical changes in slopes are clearly observed from their data.
16 Fig. 9. Variation of l’ vs log z for Fe1-zO at 1250 °C.
Three sets of data can be defined as three quasi-linear relations.
To illustrate their results, we have transformed their representations for one temperature T=1523 K. For this temperature, their data are interpreted in terms of two relations only:
For low x values (x = 1/(1-z)):
l
’
= M1.x + B1 = 28.512 x - 41.366 (19) For high x values:
l
’
= M2.x + B2 = 23.288 x - 35.715 (20) The new representations for l’
vs log z are done in Fig. 9. Two coefficients s can be defined as a first step,using the hypothesis of a transition implying two pseudo-phases proposed by the authors:
s
close to 4 ands
close to 7.5. However, three correlations can be also defined as follows:l
’
= 4.4539 log z - 5.5685, l’
= 6.1378 log z - 3.6876, l’
= 9.5059 log z - 0.5046 (21) from which three values for s can be derived. A first domain for low z values yields a coefficient s = 4.5. So, it is possible to interpret the non-linear second domain in terms of two linear sequences with two coefficients s = 6.1 and s = 9.5: these two last coefficients are quite close to those obtained from the data of Vallet et al. The results of Takayama and Kimizuka [70] and those of Bransky and Hed [99] show a relative agreement in the same domain of temperature (see also Annex A Fig. A1 b-), but disagree with results of Fender, and those of Vallet because these authors did not observe any breaking point on the isothermal lines above 911 °C (see infra section 10. Percolation approach, Nota: Metastabilities).4. Electrical properties. Transitions. Percolation
In an extensive review about electrical properties, Gleitzer points out that the modeling of the electrical conductivity of wüstite is relevant of the percolation concept [19]. The superimposition of the two kinds of p-n and Wi Wi+1 transitions, almost independent of each other, and both function of z, is already referenced in the Burgmann’s review [4].
Because of this common stress, it is not easy to correlate the p-n transition to the structure. Since the percolation process is characterized experimentally by a steep variation of the studied property at a threshold composition, the curves for the electrical conductivity vs composition can be interpreted in terms of upgradable clusters and long-range ordering in the subdomains of W1, W2 and W3 [65] [100] [101].
Later in the present review (see Section 10 Percolation approach, Fig. 20), a statistical distribution of clusters with two types of percolation modes is schematically represented through the phase diagram. This cluster distribution can justify structurally the singularities of the integral and partial thermodynamic
17 properties (see above Figs. 1, 2, 5, 6, 7). Also, it can justify the distinct rate constants observed in kinetic processes (see section 3.6. Kinetics transitions, and Annex B: Figs. B-1 and B-2).
4.1. The p to n transition
Tannhauser observe a thermo-electronic p to n transition around 1300 °C by thermal e.m.f. analyses of a highly nonstoichiometric wüstite [89]. More precisely with Bransky [102], a change in sign of the Seebeck coefficient is observed for polycrystalline samples near O/Fe 1.09 or z 0.083 at T [1010-1310 °C] and near z 0.066 at 910 °C (Fig.10). The authors formalize the Seebeck coefficient , in the case of completely ionized vacancies, when the hopping process is predominant:
= (k/e).(A/kT + ln (co-c)/c) (22)
where c = ‘concentration’ of charge carriers, co= ‘concentration’ of available sites for the charge carriers (see also [103]).
The same formalism is used by Lafollet and Duquesnoy in the case of non-localized when the wüstite is considered as an intrinsic semiconductor, i.e., doped by its own impurities [104].
They modeled = 0 for z = 0.104 at 1100 °C, and z = 0.108 at 1000 °C (see [104] in Fig. 10).
Fig. 10: Some determinations of the p-n transition by thermal e.m.f.. : Geiger et al. [66] not corrected for platinum ; : Bransky and Tannhauser [102]; : Lafollet and Duquesnoy [104] by modeling; : Hillegas jr and Wagner jr [105]; : Gartstein and Mason [106] by re-examination of Hillegas jr’s thesis [82].
Like in previous studies, Hodge and Bowen state that the experimental sign change of the thermal electromotive force, from positive to negative, occurs at increasing values of z [107]. Their model considers principally clusters (4:1) and electron holes trapped in octahedral sites adjacent to cluster vacancies. The thermally activated hopping of these holes permits continuous paths through the crystal because of the high point defect concentration between the zones separating the clusters.
In their studies on electrical conductivity, Ariya and Bratch, and Kozheurov and Mikhailov observe modifications to the relationship
(p’)1/n, closely related to the relationship z
(p’)1/n, where their coefficient n ( s) varied in such a way that three subdomains can be defined [100] [101]. They find an increase of the conductivity in two composition ranges, from z 0.048 to 0.079 then from 0.079 to 0.097, in relation with the Fe/W and W/Fe3O4 boundaries.
4.2. Electrical conductivity
Neuschütz and Towidi establish a variation of the conductivity for T[700-1220 °C] from which they inferred that the defect electrons jumped between Fe2+ and Fe3+, the activation energy of the process being 9.6 kJ.mol-1 [108].
18 Following Molenda, Stokłosa and Znamirowski, the conductivity can be the sum of an « extrinsic conductivity σy » related to the nonstoichiometry and of an « intrinsic component σo » independent of the defect concentration, i.e., of p
’
[83]. Charge transport at high temperature would occur simultaneously in the valence and conduction bands, and the dopant acceptor band due to Fe3+ in octahedral and tetrahedral sites. Near the composition z ≈ 0.08, the acceptor band would overlap the valence band giving rise to a broad metallic band close to the thermoelectric transition p to n for z ≈ 0.09 and corresponding to the stability limits of W1 and W2-3. Experimental details are given in ref. [83] (Fig. 2 p. 519 and Fig. 4, see also Annex A, Fig. A1 e-), where successive segments and breaks corresponding to the Raccah-Vallet’s isotherms have been observed.More recently, Toroker and Carter examined the possible improving of the conductivity of Fe1-zO
by doping the p- or n- conduction mode, with the aim of stabilizing the nanoscale fabrication of wüstite, and then adapting the nanoparticles to create efficient solar light conversion materials [109].
They listed the procedures allowing the calculation of Marcus theory parameters for cluster models with hydrogen dopant and substitutional Cu+, Li+ and Na+. They concluded that « iron vacancies drastically limit the hole conductivity » while Li, H and Na dopants improve it. So, it would be interesting to suppress the formation of vacancies by « alloying FeO », which would amplify the p-type conductivity.
Note: An extensive thermodynamic study of multiple substituted wüstites can be found in the work of Lykasov et al. which is reviewed partly in [13] and [111]. Structural aspects of calcio- and magnesio-wüstites are available infra (see Table II, and in Fig. 15)).
4.3. Nanocomposites. Epsilon-Fe
Aldon and Jumas examine the electrochemical redox phenomena at the negative electrode Fe/Fe1-z0O formed by wüstite of limit-composition z0 (= 0.050 0.013) in Li-ion batteries [110]. The initial samples of hematite powder, reduced in H2 at 800 °C, are quenched outside the furnace. The analyses by Mössbauer
spectroscopy and X-ray diffraction, after the first discharge, yield the nature and concentration of the products of reduction of wüstite by Li. Nanoparticles of iron (2nm) embedded in a Li2O matrix are identified. A part of the iron atoms appearing in the disproportionation is made of the -Fe phase which is stressed in the matrix under a pressure evaluated at 6.7 GPa, and which is not ferromagnetic. It can be due to the extrusion from the W structure. At the same time, small clusters of lacunary hematite are formed. These phenomena have been still identified in the formation of « planetary materials, in the Earth’s inner core ». See also geological observations by Hazen and Jeanloz [10].
5. Other kinetic and diffusional works
5.1. Iron self-diffusion
In 1963, Desmarescaux and Lacombe study self-diffusion in using isotopes 55Fe and 59Fe [112]. They state experimentally (Fig. 11) that the self-diffusion coefficient D*Fe increases with z at a given temperature
T. At increasing T, because the clusters are dissociated, the rate of free vacancies is increased, the self-diffusion coefficient too. They deduce that self-self-diffusion proceeded through a vacancy driven mechanism, especially noticeable at high temperature. At lower temperatures, fewer free vacancies and more complex vacancy-electron holes exist. Diffusion is then slower. The number of vacancies associated to Fe3+ cations [the clusters] increases with z, so a compensation with the free vacancies implies a quasi-constant D*Fe whatever z below 850 °C. These observations are interpreted in the Collongues’s review [18] with the help of theoretical evaluations of the binding energies in clusters (see Sections 6.5. Cluster stability, and 6.6.
19 Fig. 11: Fe diffusion (from ref. [112], Fig.4) : log D*Fe vs 1/T.
Fe % = 75.6 z= 0.112; 76.0 0.093; 76.2 0.083; 76.5 0.067. 5.2. Isothermal kinetics
Landler and Komarek measure the loss of mass vs time M(t) in H2/H2O mixtures when reducing polycrystalline samples by thermogravimetry [113]. In their calculations, the coefficients of iron self- and chemical diffusion decrease for increasing z at constant T[800 - 1050 °C] because of « the increased freezing due to repulsive interaction of the vacancies ». That corresponds to activation energy independent of T. This observation is related primarily to the formation of clusters, then to the ordering of clusters in the bulk (see Section 2.7. Trends to ordering).
Considering the relationship log(M/Mo) = n.log t + k, in which Mo is the total mass loss, reduction kinetics data from the authors at 950, 1000 and 1050 °C can be separated into three regimes II, III, and IV (see Annex B, Fig. B1). At 1000 °C, the calculated mean values of n are -0.72 (W3?), -0.49 (W2?) and -0.3 (W1?), respectively [114]. A brief anharmonic sequence is observed at the transitions between two reduction processes. The increase of 0.6 eV in the activation energies EIII = 1.31 eV and EII = 1.89 eV, for the reduction sequences III then II, is observed a decreasing z, i.e., when the vacancy concentration decreases. It corresponds to the decrease of the ordering on the boundary W3W2. This variation is opposite to other results in the literature, particularly to ([112] Fig 5, see section 5.1. Self-diffusion). The three coefficients n are primarily the signature of the bulk modifications by Landler and Komarek, while the three kinetic coefficients m by Worral and Coley are primarily characteristic of surface phenomena [113] [73] (see [115]: Bulk and surface process in the course of the reduction).
Similarly, successive different reduction sequences using H2O/H2 gas mixtures that exhibit transitional anomalies can be observed by Rieke and Bohnenkamp [116] (see Annex A, Fig. A1 c-).
5.3. In situ diffusion
Rickert and Weppner combine a solid galvanic cell for the ionic conduction by O2- through the sample while with the other sample face in contact with a platinum foil [117]. The diffusion is studied in situ during the relaxation from a composition to another, driven by controlled impulses of electrical potential. Their main result is that the chemical diffusion coefficient increases with increasing z (i.e., with the vacancy concentration), which disagrees with Landler and Komarek [113] and not with any other authors. Transitional anomalies are clearly noticed (see [117] Fig. 6 and 7 p. 1856, and Fig. 8 p. 1857).
20
6. Relationships between defect structures and the phase diagram
We review key publications from authors who have attempted to solve the key challenge formulated by Carl Wagner in 1930 of linking more tightly defect structure and thermodynamics, such as partial molar properties or the equilibrium constant of formation of the clusters. Kinetics (diffusional) relations were also developed.
6.1. Per Kofstad and Zeev Hed
Theses authors remark that z increases at constant p
’
as T decreases, which is different than other oxides, and likely due to a complex defect structure [2] [118] (see section 5.1. Iron self-diffusion by authors [112]). They emphasize that there is some doubt that all the iron vacancies are doubly charged. The electron holes associated to a vacancy can jump into only one of the 12 next nearest octahedral neighbors (FeFe°) and one tetrahedral site (Fei°°°). Most of octahedral vacancies are singly charged.A model can thus be elaborated from the Roth complex [ VFem(’)
- Fein(°)-VFep(’) ]q(’)
, n=1,3, (m,p) = 0,1,2. In the relationship
p’
1/s, the s value is larger than the value in the similar relationship connecting z to p’ because vacancies would be neutral.6.2. Toft Sørensen’s works
In a book devoted to nonstoichiometric oxides, Toft Sørensen then with El Sayed Ali [9] [46] tentatively identify the defect structure of the « subphases » in using thermogravimetric data [l
’
- z] at 1000 - 1300 °C exclusively by Bransky and Hed [99]. They consider three main defects (doubly charged vacancy VFe”
, and tetrahedral complex defects (4:1)(m)- and (6:2)) as defined by Catlow et al. (see [9] chapter 2). They focus on the defect cluster differently ionized, which leads them to define a linear plot of l’
vs log y (≡z) withminimal slopes 1/s in the relation z (p’)1/s. A second criterion concerns the so-called exclusion envelope,
i.e., the long-range order as a layer or a close packing structure. They localize in the wüstite equilibrium area
T(z) the predominant defect (4:1) plus a layer structure, (4:1) plus a close packing, (6:2) plus a layer structure, according to T layers above 1300 °C, between 1300 and 1200 °C and below 1200°C, respectively. In addition, iron vacancies VFe
”
are present on the right side of a line at composition z close to 0.09 (see [46], Fig. 7 p. 20). So, a structural characterization is roughly proposed, and the phase diagram of Fender and Riley [67] and Vallet and Raccah [44] is approximately drawn again.6.3. The C(luster) C(omponent) M(ethod)
Structural unit blocks S.S. I, II, III: positions : (16d), : (16c), : (8b), : (8a), : (48f), : (32e); a and d are for iron, c and f for vacancies (see ref. (6), Table 7.1., p. 186). Short range order in terms of S.S and C.C. in the three
sub-domains; C.C. 1: I-6III, C.C. 2: II-6III, C.C. 3: I-6III-II. In the range [zo- z1/2], II and III increase, I decreases; in [z1/2-
z2/3], II and III decrease, 1 or 2 increases; in [z2/3- z1], 1 and 2 decrease, 3 increases.
Fig. 12: C.C.M. applied to wüstite (from ref. [121]). The three pseudo phases from zo on the -Fe/W1 boundary to


![Fig. 5. H O from some authors. ─ : derived for the Wi (i=1-3) i.e. at T [1193 - 1523 K] from thermogravimetry + CO 2 /CO [28]; : w I, - - : wII, and : wIII (two points only) by emf at T [1023-1623 K] [67]; dash-dot line -.-.- : by](https://thumb-eu.123doks.com/thumbv2/123doknet/14641612.735363/9.892.280.650.286.594/fig-authors-derived-thermogravimetry-wiii-points-dash-line.webp)

![Table 1 - Variations at 1273 K of excess properties [ H O ] i](https://thumb-eu.123doks.com/thumbv2/123doknet/14641612.735363/12.892.240.695.556.926/table-variations-k-excess-properties-h-o-i.webp)
![Fig. 12: C.C.M. applied to wüstite (from ref. [121]). The three pseudo phases from z o on the -Fe/W 1 boundary to z 1 on the W 3 /Fe 3 O 4 boundary described with the help of three cluster components , , ](https://thumb-eu.123doks.com/thumbv2/123doknet/14641612.735363/20.892.149.786.852.1000/applied-wüstite-pseudo-boundary-boundary-described-cluster-components.webp)