HAL Id: insu-01142636
https://hal-insu.archives-ouvertes.fr/insu-01142636
Submitted on 3 Jan 2019
HAL is a multi-disciplinary open access
archive for the deposit and dissemination of sci-entific research documents, whether they are pub-lished or not. The documents may come from teaching and research institutions in France or abroad, or from public or private research centers.
L’archive ouverte pluridisciplinaire HAL, est destinée au dépôt et à la diffusion de documents scientifiques de niveau recherche, publiés ou non, émanant des établissements d’enseignement et de recherche français ou étrangers, des laboratoires publics ou privés.
Indoor Emissions of Carbonaceous Aerosol and Other
Air Pollutants from Household Fuel Burning in
Southwest China
Hefeng Zhang, Tong Zhu, Shuxiao Wang, Jiming Hao, Heidi Mestl, Lines
Alnes, Kristin Aunan, Zeqin Dong, Liying Ma, Yu Hu, et al.
To cite this version:
Hefeng Zhang, Tong Zhu, Shuxiao Wang, Jiming Hao, Heidi Mestl, et al.. Indoor Emissions of Carbonaceous Aerosol and Other Air Pollutants from Household Fuel Burning in Southwest China. Aerosol and Air Quality Research, 2014, 14, 14 (6), pp.1779-1788. �10.4209/aaqr.2013.10.0305�. �insu-01142636�
Aerosol and Air Quality Research, 14: 1779–1788, 2014
Copyright © Taiwan Association for Aerosol Research ISSN: 1680-8584 print / 2071-1409 online
doi: 10.4209/aaqr.2013.10.0305
Indoor Emissions of Carbonaceous Aerosol and Other Air Pollutants from
Household Fuel Burning in Southwest China
Hefeng Zhang
1,7, Tong Zhu
1, Shuxiao Wang
1, Jiming Hao
1*, Heidi E.S. Mestl
2,
Line W.H. Alnes
2,3, Kristin Aunan
2,3, Zeqin Dong
4,
Liying Ma
4, Yu Hu
4, Min Zhang
5,
Abdel Wahid Mellouki
6, Fahe Chai
7, Shulan Wang
71 School of Environment, State Key Joint Laboratory of Environment Simulation and Pollution Control, Tsinghua University,
Beijing 100084, China
2 CICERO (Center for International Climate and Environmental Research – Oslo), P.O. Box 1129, Blindern, N-0318 Oslo,
Norway
3 Department of Chemistry, University of Oslo, P.O. Box 1033 Blindern, N- 0371 Oslo, Norway
4 Guizhou Research & Designing Institute of Environmental Science, 1 Tongren Road, Jinyang New District, Guiyang,
Guizhou Province, 550081, China
5 Key Laboratory of Data Analysis and Application, The first Institute of Oceanography, State Oceanic Administration,
Qingdao 266061, China
6 ICARE-CNRS, 1C Avenue de la Recherche scientifique, 45071 Orleans cedex 02, France
7 Atmospheric Environment Istitute, Chinese Research Academy of Environmental Sciences, Beijing 100012, China
ABSTRACT
Field campaigns were conducted to determine indoor emissions of carbonaceous aerosols and other air pollutants from household fuel burning in southwest China. “1-h peak” concentrations of CO, PM1.0, PM2.5 and PM10 were 14.0 ppm, 200, 220, and 260 µg/m3 for wood and 10.3 ppm, 80, 110, and 180 µg/m3 for coal, respectively. Daily average levels of CO, PM1.0, PM2.5 and PM10 were 5.7 ppm, 100, 110, and 160 µg/m3 for wood and 6.0 ppm, 50, 70, and 100 µg/m3 for coal, respectively. For wood and coal, particle size distribution show a prominent Aitken mode with peaks at around 40–80 nm. Emission factors of BC and OC were 0.57 and 2.69 g/kg for wood and 0.01 and 0.31 g/kg for coal, respectively. The total BC emissions from wood and coal (anthracite) burning in China were 63.3 Gg in 2000 and 81.6 Gg in 2005, respectively.
Keywords: Household fuel burning; Indoor emissions; Carbonaceous aerosol; Air pollutions; Particle size distribution.
INTRODUCTION
Around one-half of the world’s population relies on household fuels –such as wood, charcoal, animal dung, crop residues, and coal– for everyday energy needs (Bruce
et al., 2000; Smith et al., 2004). The impact of household
fuel burning on ambient environments (indoor and outdoor) is a very essential issue, due to its adverse effects on human health and potential influence on atmospheric environment. Smoke from household fuel burning represents an important source of atmospheric pollutants and has a significant impact on human health (Mumford et al., 1987), ambient environment (Nel, 2005), atmospheric chemistry (Ramanathan et al., 2001), and climate change (Menon et
* Corresponding author.
Tel.: +86-10-62771466; Fax: +86-10-62773650
E-mail address: hjm-den@tsinghua.edu.cn
al., 2002). It was reported that, in rural areas of developing
countries, smoke from household fuel burning accounts for a substantial proportion of the global disease burden and mortality (Bruce et al., 2000; Smith et al., 2004).
Moreover, smoke from household fuel burning also have a significant effect on atmospheric environment due to its contribution to regional-scale pollutant burden (Venkataraman
et al., 2005). For instance, carbonaceous aerosol (BC and
OC), as important components of smoke from household fuel burning, not only contributed to marked degradation of indoor environments but also have adverse effects on human health due to toxic organic compounds, such as polycyclic aromatic hydrocarbons (PAHs) (Zhang et al., 2011) and their alkylated homologues (Lian et al., 2009), which are noted carcinogens and mutagens (Ren et al., 2006). In addition to health effects, carbonaceous aerosol also have significant implications for regional carbonaceous aerosol burden (Jacobson, 2004) and further affect atmospheric radiation balance, which, in turn, could alter regional rainfall patterns. Emission control of carbonaceous aerosol has been
Zhang et al., Aerosol and Air Quality Research, 14: 1779–1788, 2014 1780
suggested as an important measure to improve regional air quality and mitigate climate change (Ramanathan et al., 2001; Shindell et al., 2012). Therefore, it is essential to investigate indoor emissions of smoke from household fuel burning in rural residential households.
Indoor emissions from household fuel burning were carried out in some rural areas in China (Sinton et al., 2004; He et al., 2005; Jin et al., 2005; Fischer et al., 2007). However, these studies scarcely have reported time-resolved concentrations of indoor air pollutants, which may be valuable in improving exposure assessment (Fischer et al., 2007). It is well known that health exposures from indoor air pollutants are mainly derived from the period of high-pollution emissions. Hence, time-resolved concentrations of indoor air pollutants during the period of cooking and heating are of crucial importance to exposure assessment development. Particle number concentration and size distribution emitted from household fuel burning have been measured during the flaming processes (Zhang et al., 2012), but the knowledge of particle size distribution in indoor environments during different burning stages is very limited. Carbonaceous aerosol emissions from household fuel burning have been conducted in the laboratory (Cao et al., 2006; Zhi et al., 2008; Zhang et al., 2008; Li et al., 2009), they can provide useful information, but are not well representative of indoor emission characteristics. It is well known that emission characteristics in indoor environments were quite different from those in laboratory simulations. Therefore, indoor emissions in rural residential households are more representative than laboratory experiments in estimating carbonaceous aerosol emissions.
To provide more documents about indoor emissions from household fuel burning and better understand the characteristics of indoor air pollutants as well as their impact on indoor air quality and regional atmospheric environment, we carried out field campaigns to investigate the emissions of indoor air pollutants from the burning of two household fuels (wood and anthracite coal), used widely in southwest China. Time-resolved concentrations of CO, PM1.0, PM2.5 and PM10 were monitored. Smoke particle size distributions from household fuel burning were characterized during ignition, flaming and smoldering processes. Considering potential application in developing emission inventory and providing source apportionment, we investigated emission factors of carbonaceous aerosols (BC and OC), roughly estimated indoor contribution to global carbonaceous aerosol burden, and discussed climate implications.
METHODOLOGY Experimental Description
Field measurements were carried out in rural residential households during the period from December 2010 to January 2011 in the southwestern China region. Wood and coal, widely used as household fuel in this region, were chosen as representatives of household fuels. Detailed descriptions of chemical composition of two household fuels can be found elsewhere (Zhang et al., 2012). The wood, which is locally grown pine, was cut into pieces according
to local practice. The pieces were roughly 20–30 cm in length and 4 × 8 cm in cross-section. The wood pieces were burned on the metal tripod stoves. The coal, which is anthracite, was intermixed with clay and made into honeycomb briquettes. The briquettes were 12-hole columns with a height of 6 cm and diameter of 9.5 cm. The honeycomb briquettes were burned into the honeycomb coal stove. In our measurements, both wood stove and coal stove have no chimney, which is not typical practice in china. Some stoves with chimney were also used in local houses.
To ensure the measured results are representative of local rural residential households in the southwestern China region, representative household was selected and measured in the village of southwestern China, considering that the house structure, ventilations, fuels and stove types are typical and common. The studied houses were usually made of brick (coal burning) or wood (wood burning) and have 2–3 rooms, including cooking/living room, sleeping room, and storage room, which was connected each other with doors. The stoves were placed in the cooking/living room during the period of cooking/heating. The average areas of cooking/ living rooms are about ~20 m2 and the storage and/or sleeping rooms are about 10–15 m2. The cooking/living room is almost 2 times larger in size than the other two rooms. During the period of cooking/heating, the doors are usually closed and the window is open. Ventilations in these houses are based on natural draft. All measurements were carried out on non-rainy days with winds speeds less than 3 m/s.The local cooking and heating practice mainly involved cooking rice and heating water. During the period of cooking and heating, fuel size and feeding rate complied with the local cooking and heating practice and burning rates were averaged to be 1.6–2.4 kg/hour for wood and 1.1–1.7 kg/hour for coal, respectively.
Sampling Instruments and Analysis
CO gas analyzer (Model 48i, Thermo Fisher Scientific, Co., Ltd) was used to monitor CO concentrations. CO2 gas analyzer (Model 410i, Thermo Electron Corporation) was used to monitor CO2 concentrations. DustTrak Aerosol Monitors (model 8533, TSI Inc.) were used to record real-time mass concentrations of particulate matters (PM1, PM2.5, PM10). It should be noted that the PM values measured by the DustTrak Aerosol Monitor were calibrated by gravimetric values from calibration experiments at the beginning of each measurement. A wide-range particle spectrometer (WPS, Model 1000XP, MSP Co., USA) was used to measure smoke particle size distribution, with a wide size range of 10 nm to 10 µm (Wilson et al., 2007). Detailed descriptions of WPS can be found elsewhere (Zhang et al., 2012). Prior to the sampling campaign, WPS instrument was calibrated by the manufacturer. These sampling instruments (CO, CO2, PM1, PM2.5, and PM10, particle size) were set up on chairs (a height of 1.5 m) in the cooking/living room and was about 1.5–2 m away from the fire, far enough for smoke to dilute and cool to ambient temperature before sampling. Before EC and OC sampling, background EC and OC concentrations were measured and subtracted from the measured samples. For EC and OC sampling, a developed
Zhang et al., Aerosol and Air Quality Research, 14: 1779–1788, 2014 1781 and optimized dilution sampler was used to achieve post
combustion quenching and gas/particle partitioning (Li et
al., 2009). PM2.5 was collected on prebaked quartz-fiber filters (QFF) by a cyclone inlet particle sampler during the sampling period and were analyzed for EC and OC to calculate emission factors. Emission factors of EC and OC were calculated using the carbon mass balance method (Zhang et al., 2000). The carbon balance method assumes the total mass of carbon combusted equals the total mass of carbon emitted as carbonaceous aerosols and carbonaceous gases such as CO2, CO, CH4, and NMHCs. Detailed descriptions about carbon mass balance method were presented in the Supporting Information.
For indoor CO, PM1, PM2.5, and PM10 measurements, sixteen successful samplings were recorded for each fuel and samplings were conducted in sixteen different residential places. The sampling duration is 24 h, typically covering a midday-to-midday period. For indoor smoke size distribution measurement, the modified combustion efficiencies (MCE, MCE = C[CO2]/(C[CO2] + C[CO])) were used to determine the different burning stages and distinguish the flaming stage from the smoldering stage (flaming stage: MCE > 0.9; smoldering stage: MCE < 0.9) (Zhang et al., 2008). It is well known that light-absorbing sp2-bonded carbon, measured by change in light transmittance or reflection, was defined as BC, and refractory graphitic carbon, measured by thermal evolution under high-temperature oxidation, was defined as EC (Schauer et al., 2003). Since most measurements of EC were treated as equal to BC (Chen et al., 2009; Li et al., 2009), therefore, in this study, BC was also assumed to be the same mass as EC. EC and OC were analyzed by a Thermal/Optical Carbon Analyzer (DRI, Model 2001) using the IMPROVE protocol (Chow et al., 1993, 2001).
2.3 Quality Assurance (QA)/Quality Control (QC)
In order to ensure the accuracy and reliability of the results, we strictly followed certain quality assurance (QA) and quality control (QC) protocol for sampling and analysis. Before each measurement, Particulate Matter (PM) sampling
instruments were calibrated carefully. To reduce the accidental error in particle mass concentrations for each location, parallel samplings were conducted to ensure the validity of the results. For particle size distribution, at least five valid measurement results for each fuel were obtained under the stable operating conditions. Prior to BC and OC sampling, the quartz filters were baked at 550°C for 4 h to remove carbonaceous impurities. For BC and OC analysis, field blanks were collected and subtracted from the measured samples.
RESULTS AND DISCUSSION
Indoor CO and Particulate Matter (PM) Concentrations
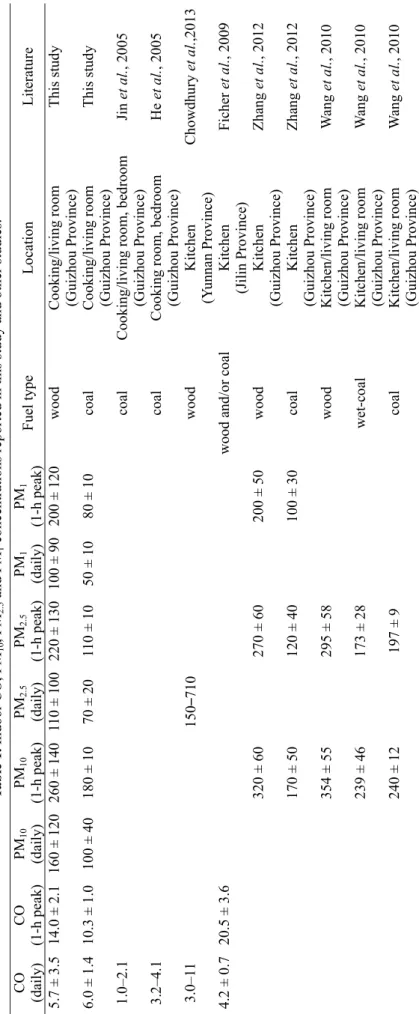
Concentrations of carbon monoxide (CO) and particulate matter (PM1, PM2.5, and PM10) from the burning of two fuels (wood and coal) in sixteen residential households were illustrated in Fig. 1 and Fig. 2, respectively. “Daily average” represents 24 h average concentrations, typically covering a midday-to-midday period. “1-h peak” denotes 1 h averages of peak concentrations during the burning period. “Daily average” and “1-h peak” concentrations of CO were 5.7 and 14.0 ppm for wood and 6.0 and 10.3 ppm for coal, respectively. Jin et al. (2005) measured that daily CO concentration from coal burning in Guizhou ranged from 1.0 to 2.1 ppm in both cooking room and bedroom. He et
al. (2005) further presented that daily CO concentrations
from coal burning in Guizhou were 3.2 ppm in the cooking room and 4.1 ppm in the bedroom, respectively. Studies by Ficher et al. (2009) showed that daily CO concentration from coal and wood burning in Jilin was averaged to be about 4.2 ppm. In Chowdhury’s (2013) research, daily CO concentration from wood burning in Yunan was in the range of 3.0–11.0 ppm. Compared with those studies (Table 1), daily CO concentrations in our measurements were higher than most values reported above. This difference could be attributed to different stove type (with/without chimney), fuel moisture content, or fuel burning amount. Although
Fig. 1. Average concentrations of daily-average and 1-h peak CO from wood burning and coal combustion. Note: number
Zhang et al., Aerosol and Air Quality Research, 14: 1779–1788, 2014 1782
Fig. 2. Average concentrations of daily-average and 1-h peak particulate matter (PM1, PM2.5, and PM10) from wood burning and coal combustion. Note: number of measurements for each fuel, n = 16.
limited studies have measured peak concentrations of indoor pollutants in China, Ficher's (2009) research reported peak CO concentration during cooking periods in northern Chinese households. Our 1-h peak CO concentrations were far lower than the average value (20.5 ppm) reported by Ficher. The high 1-h peak CO concentration in cooking room in Ficher's study (2009) could be explained by house characteristics, fuel heating practice, and/or other sociocultural and climatic factors.
From Fig. 2, “daily average” concentrations of PM1, PM2.5, and PM10 were 100, 110, and 160 µg/m3 from wood burning and 50, 70, and 100 µg/m3 from coal combustion, respectively; “1-h peak” concentrations of PM1, PM2.5, and PM10 were 200, 220, and 260 µg/m3 for wood and 80, 110, and 180 µg/m3 for coal, respectively. Peak concentrations of PM1, PM2.5, and PM10 in our measurements were comparable to our previous study (200, 270 and 320 µg/m3 for wood and 100, 120 and 170 µg/m3 for coal) (Zhang et
al., 2012). However, as shown in Table 1, high PM2.5 and PM10 concentrations in Guizhou were observed in Wang's study (2010) and the values were 295 and 354 µg/m3 from wood burning and 197 and 240 µg/m3 from coal combustion, respectively. PM2.5 and PM10 data in our measurements were much lower than those from Wang 's study (2010). The high concentrations of indoor PM2.5 and PM10 in Wang' study could be explained by stove type, house ventilation and/or fuel characteristics (such as fuel size, moisture content, burning rate, etc.).
From our measurement results, we can find that daily CO concentrations in indoor environments were within Chinese guideline value of 9 ppm for residential indoor air quality (Fischer et al., 2007) and World Health Organization guideline (WHO) values of 10 ppm, and indoor peak CO concentrations did not exceed the WHO guideline values of 26 ppm for 1-h exposures. Although both daily and peak CO concentration do not exceed the corresponding standards, CO exposure levels in our measurements are not adequately characterized due to the absence of the factors that
influence the level of exposure and the relative contributions of each, such as spatial variation, day-to-day exposure variability, and time amount spent inside the house or near the burning area. Daily average of PM10 concentrations was close to the Chinese residential indoor standard of 150 µg/m3, while peak values of PM10 concentrations were far in excess of the standard value (150 µg/m3). Both “daily average” and “peak value” of indoor PM2.5 concentrations simultaneously exceed the US EPA PM2.5 daily average values of 65 µg/m3, indicating adverse impact on human health in indoor environments. Although PM1 standard is not under consideration in China and in the world, data from epidemiological studies suggest that a relationship may exist between PM1 and human health (Oberdorster et al., 2001; Englert, 2004; Schulz et al., 2005; Pope et al., 2002), which can penetrate deeper into the alveolar regions of the lung and pose greater threat to human health (Pope et al., 2002).
Smoke Particle Size Distribution
Typical smoke particle size distributions in indoor environments from the burning of two fuels (wood and anthracite coal) during the different burning stages were shown in Fig. 3. Smoke particle size distributions were unimodal with most of particle numbers centered between 40 and 80 nm during the different burning stages. As shown in Fig. 3, the shape of particle size distribution for wood and coal was similar. The size distributions showed apparent Aitken modes (Seinfeld and Pandis, 2006), with peaks at 62, 58 and 41 nm for wood and at 73, 61 and 63 nm for coal during ignition, flaming and smoldering stage, respectively. Our results, to some extent, were comparable with those reported in previous literatures. For example, Hays et al. (2002) observed a unimodal size distribution in the accumulation mode for wood burning and the mode mainly peaks between 100 and 200 nm. Wardoyo et al. (2006) presented a unimodal size distribution in the Aitken mode for wood burning, with peaks at 30–40 nm for fast burning
Zhang et al., Aerosol and Air Quality Research, 14: 1779–1788, 2014 1783 Ta b le 1 . In doo r CO, P M10 , P M2. 5 an d P M1 c onc en tr at io ns r epo rt ed in th is st udy a nd ot he r st ud ie s. CO (d aily) CO (1-h peak) PM 10 (d aily) PM 10 (1-h p ea k) PM 2. 5 (d aily ) PM 2. 5 (1 -h p ea k) PM 1 (da ily ) PM 1 (1-h p ea k) F uel t yp e Lo cation Liter at ur e 5. 7 ± 3 .5 14. 0 ± 2.1 16 0 ± 12 0 260 ± 14 0 11 0 ± 1 00 22 0 ± 13 0 10 0 ± 90 200 ± 12 0 w ood Co ok in g/living ro om (Gu izho u P rov in ce) Th is s tud y 6. 0 ± 1 .4 10. 3 ± 1.0 100 ± 40 18 0 ± 10 70 ± 20 11 0 ± 10 50 ± 10 80 ± 10 co al Co ok in g/living ro om (Gu izho u P rov in ce) Th is s tud y 1. 0–2.1 co al Cook ing/liv in g ro om , b ed room (Gu izho u P rov in ce) Jin et al. , 2 005 3. 2–4.1 co al C ook ing roo m , b ed room (Gu izho u P rov in ce) He et al. , 2 005 3.0 –1 1 15 0– 710 w ood Kitch en (Y unna n Prov in ce) Ch owdhu ry et a l., 2013 4. 2 ± 0 .7 20. 5 ± 3.6 wood and /o r co al Kitch en (J ilin P rovin ce ) Fich er et a l., 20 09 32 0 ± 60 270 ± 60 20 0 ± 50 w ood Kitch en (Gu izho u P rov in ce) Zh an g et a l., 20 12 17 0 ± 50 120 ± 40 10 0 ± 30 co al Kitch en (Gu izho u P rov in ce) Zh an g et a l., 20 12 35 4 ± 55 295 ± 58 wood Kitchen /livi ng r oo m (Gu izho u P rov in ce) W ang et a l., 2010 23 9 ± 46 173 ± 28 we t-co al Kitchen /livi ng r oo m (Gu izho u P rov in ce) W ang et a l., 2010 24 0 ± 12 197 ± 9 co al Kitchen /livi ng r oo m (Gu izho u P rov in ce) W ang et a l., 2010
Zhang et al., Aerosol and Air Quality Research, 14: 1779–1788, 2014 1784 101 102 103 0.0 2.0x10⁵ 4.0x10⁵ 6.0x10⁵ 8.0x10⁵ dN /dl og(dp) (cm -3 ) Particle diameter (nm) Background Smouldering Igniting Flaming wood burning 101 102 103 0.0 5.0x10⁴ 1.0x10⁵ 1.5x10⁵ 2.0x10⁵ 2.5x10⁵ dN /dlog( dp) ( c m -3 ) Particle diameter (nm) Background Smouldering Igniting Flaming coal combustion
Fig. 3. Smoke particle size distribution during the ignition, flaming and smoldering stage from wood burning and coal
combustion.
and at 50–60 nm for slow burning. McElroy et al. (1982) showed a unimodal size distribution peaking at around 100 nm from coal combustion. Bond et al. (2002) found a unimodal size distribution in the Aitken mode (20–100 nm) for coal combustion. In our recent measurements (Zhang et
al., 2012), a unimodal size distribution for residential wood
and coal burning were observed during the flaming stage with peaks at between 60 and 80 nm. However, a transition conversion from bimodal to unimodal size distribution during the flaming processes for residential wood burning was observed. The possible explanation for this result may be due to burning conditions, such as burning rate or burning temperature, etc. In addition, the shape of the unimodal size distribution for wood and coal burning in our measurements were also similar to those for agricultural residue burning in laboratory studies (Zhang et al., 2011). It can be concluded, from our measurements, that smoke particles from the burning of these two fuels were mainly dominated by ultrafine particles (UFP, Dp ≤ 100 nm), which implied a degradation of indoor air quality and a significant threat to human health. Therefore, it is noteworthy that
household fuel burning may be an essential source of ultrafine particles (UFP, Dp ≤ 100 nm), potentially affecting health effects, indoor environment quality, and even regional atmospheric environment.
BC and OC Emission Factors
Emission factors of BC and OC from the burning of two household fuels are shown in Table 2. The measured BC and OC emission factors were averaged to be 0.57 and 2.69 g/kg for wood and 0.01 and 0.31 g/kg for coal, respectively. BC and OC emission factors in our measurements, to some extents, were comparable with those previously reported, for example, Venkataraman et al. (2005) reported that BC and OC emission factors from residential wood burning ranged from 0.38 to 0.62 g/kg and from 0.17 to 4.69 g/kg, respectively. Zhang et al. (2008) presented that the average BC and OC emission factors from residential anthracite coal were 0.03 and 0.47 g/kg, respectively. Our measurements yielded BC/OC ratio of 0.3 and 0.04 for wood and coal, respectively, which were quite comparable to the ratio of 0.42 from wood burning (Shen et al., 2013) and of 0.06 from
Zhang et al., Aerosol and Air Quality Research, 14: 1779–1788, 2014 1785 Table 2. Emission factors of BC and OC, and the BC/OC ratio and MCE value from the burning of two household fuels
(wood and anthracite coal, n = 5).
Fuel type Source Burn rate (kg/h) Emission factors (g/kg) BC OC BC/OC Ratio Modified combustion efficiencyMCE
WOOD
Barked pine Locally grown
Min 1.6 0.46 0.89 0.1 0.91
Max 2.4 0.68 3.94 0.5 0.94
Ave ± SD 2.0 ± 0.3 0.57 ± 0.11 2.69 ± 1.14 0.3 ± 0.1 0.92 ± 0.01
COAL
Honeycomb Local mine
Min 1.1 0.003 0.12 0.03 0.90
Max 1.7 0.03 0.45 0.06 0.95
Ave ± SD 1.4 ± 0.2 0.01 ± 0.01 0.31 ± 0.18 0.04 ± 0.02 0.93 ± 0.02
anthracite coal burning (Zhang et al., 2008). The modified combustion efficiency (MCE) is 0.92 for wood and 0.93 for coal, respectively. Both values are more than 0.90, indicating that the burning process of two household fuels is dominated by the flaming burning in indoor environments. Therefore, it can be inferred in our study that the measured BC and OC emission factors should be representative of the lowest emission factors from the burning of wood and coal in residential indoor environments.
Although the formation of BC and OC from the burning of household fuels is not well understood and is also beyond the scope of this work, it would be closely related with some variables, such as burn condition, fuel type, fuel size, and fuel moisture content, etc. It has been evidenced by Venkataraman and her colleagues' (2005) research that high burn rates, which are characterized by fuel-rich flame conditions, can result in high BC and low OC formation. Furthermore, it should be noted that household fuel burning in residential cooking stoves are distinct in nature from other large fires (such as, forest fire and industrial boiler combustion) and that a more complete understanding of their BC and OC emissions remains to be gained.
BC and OC Emission Estimate from Household Fuel Burning
Based on BC and OC emission factors we measured, together with household fuel consumption (NBS 2002, 2007), we calculated BC and OC emissions from the burning of two household fuels (wood and anthracite coal) in China. BC and OC emission estimates for the year 2000 and 2005 were presented in Table 3. It was well known that household fuel burning for cooking and/or heating occurs most often in indoor environments and the influence of natural ventilation on air exchange rate depends on indoor particle source emission rate, deposition rate and outdoor particle concentration, etc. If the indoor particle source emission rate is very large and the outdoor particle concentration is very low, the fraction of indoor emissions that penetrate to the ambient air will increase with pollutant concentration difference between indoors and outdoors. Based on typically natural ventilation and particle deposition rates in rural households (Venkataraman et al., 2005; Mengerson et al., 2011), we assumed in these estimates that the fraction of
emissions, which emitted into the ambient air, was estimated to be about 80%. As shown in Table 3, total BC emissions from wood burning and anthracite coal combustion in Chinese residential households were 63.2 and 0.1 Gg in 2000 and 81.5 and 0.1 Gg in 2005, respectively. The corresponding OC emissions were 298.1 and 3.9 Gg in 2000 and 384.8 and 3.9 Gg in 2005, respectively. During the 2000 to 2005 period, the increase of BC and OC emissions from household wood burning in China mainly resulted from an increase of household wood consumption, whereas constant BC and OC emissions from anthracite coal combustion were possibly attributed to invariable consumption of household coal fractions due to the introduction of electricity as supplemented household energy. Other estimates of 109 and 485 Gg/year BC and 545 and 899 Gg/year OC emissions from firewood burning and coal combustion in China (Cao et al., 2006) differ from our findings for several reasons. First, emission factors they used are derived from other countries or global average emission factors, highly different from our field measurements. Second, their emissions from residential coal combustion come from all consumptions of raw coal and coal briquettes (including rural and urban areas), covering a wide range of coal maturity (sub-bituminous, bituminous and anthracite), which are different from our anthracite coal emission in Chinese rural areas. Furthermore, their emissions are estimated mainly on the basis of uncontrolled or poorly controlled use of raw coal and coal briquettes in Chinese rural and urban residential houses. Finally, the fraction of 100% emissions, which penetrated from indoor environments to the ambient air, is adopted in Cao's (2006) study. Therefore, all these factors make direct comparisons untenable.
Household fuel burning in rural residential households, not only affects indoor air quality (Dasgupta et al., 2006; Zhang et al., 2007; Mengerson et al., 2011) but also is a potentially essential source of atmospheric BC (Menon et
al., 2002; Kaufman et al., 2006). Between 2000 and 2005,
the increase of BC emissions in this study resulted not from an increase of BC emissions from anthracite coal burning, but from an increase in BC emissions from wood burning. BC emissions from anthracite coal burning have essentially remained unchanged during the period of 2000–2005 (Table 3), implying that, to a certain extent, cleaner cooking fuels and technologies have been introduced very slowly in Chinese
Zhang et al., Aerosol and Air Quality Research, 14: 1779–1788, 2014 1786
Table 3. black carbon (BC) and organic carbon (OC) emission estimates from the combustion of two household fuels (wood
and anthracite coal) in China.
Year wood coal wood coal wood coal Fuel consumption (Tg) Black carbon emissions (Gg) Organic carbon emissions (Gg)
2000 138.5 15.8 63.2 0.1 298.1 3.9
2005 178.8 16.0 81.5 0.1 384.8 3.9
rural areas. It has been suggested that a relatively small proportion of BC aerosol emissions can play a dominant role in climate effect in that they can lead to the reduction of surface solar radiation and the increase of air heating, and they can further influence the vertical temperature profile, evaporation, latent heat fluxes, atmospheric stability, and the strength of convection (Menon et al., 2002). A small increase of BC emissions from household fuel burning in China could contribute to a tendency toward great radiation perturbations (Satheesh et al., 2000) and potential changes in atmospheric precipitation and temperature (Ramanathan
et al., 2001), which would have significant implications for
regional climate effects. The regional climate effects of BC aerosols, confirmed by other studies (Venkataraman et al., 2005; Kaufman et al., 2006) provide an important basis for reducing BC aerosol emissions. Afterwards, emission control of BC aerosols has been suggested to be an important measure to slow regional warming and mitigate regional climate change, especially on short time scales (Shindell et al., 2012). Therefore, we suggest that household fuel burning needs to be addressed as a distinct source in the future, and that emission control of household fuel burning, due to transition to cleaner cooking fuels and technologies, not only yield indoor air quality benefits but also have an important role in regional climate change mitigation.
CONCLUSION
In this study, indoor emissions of carbonaceous aerosol (BC and OC) and other air pollutants (CO, PM1, PM2.5 and PM10) from household fuel burning were investigated in southwest China. “Peak” and “daily” concentrations of CO, PM1, PM2.5 and PM10 were monitored in indoor environments, which may be valuable in evaluating health risk and developing exposure assessment. Particle number concentrations and size distribution were characterized during different burning stages (i.e., ignition, flaming and smoldering stage). The lowest emission factors of carbonaceous aerosols (BC and OC) in indoor environments were estimated. Based on the measured BC and OC emission factors, together with household fuel consumption in China, the indoor emission contribution to global carbonaceous aerosol burden were roughly evaluated.
This work not only can provide basic information for epidemiological research for better assessing the relationship between indoor pollutants and human health, but also can help develop the databases of global carbonaceous aerosol emissions. It is suggested in this study that emission control of household fuel burning is central to both indoor air quality benefit and climate change mitigation on a regional and global scale.
ACKNOWLEDGMENTS
This work was funded by the National Natural Science Foundation of China (41005061, 20921140095), Norwegian Research Council’s program GLOBVAC (Project No. 183596) and Special Fund for Environmental Scientific Research in the Public Interest project (201009001). In addition, we would like to express our sincere gratitude to all of the study participants, especially to Zhenhua Xi, Kejia Wu and Xiaona Liu for their invaluable assistance during the field measurements. We also sincerely thank the households who participated in the study for their help and hospitality.
SUPPLEMENTARY MATERIALS
Supplementary data associated with this article can be found in the online version at http://www.aaqr.org.
REFERENCES
Bond, T.C., Covert, D.S., Kramlich, J.C., Larson, T.V. and Charlson, R.J. (2002). Primary Particle Emissions from Residential Coal Burning: Optical Properties and Size Distributions. J. Geophys. Res. 107: 8347.
Bruce, N., Perez-Padilla, R. and Albalak, R. (2000). Indoor Air Pollution in Developing Countries: A Major Environmental and Public Health Challenge. Bull. World
Health Organiz. 78: 1078–1092.
Cao, G., Zhang, X. and Zheng, F. (2006). Inventory of Black Carbon and Organic Carbon Emissions from China.
Atmos. Environ. 40: 6516–6527.
Charlson, R.J., Schwartz, S.E., Hales, J.M., Cess, R.D., Coakley, J.A., Hansen, J.E. and Hofmann, D.J. (1992). Climate Forcing by Anthropogenic Aerosols. Science 255: 423–430.
Chen, Y., Zhi, G., Feng, Y., Liu, D., Zhang, G., Li, J., Sheng, G. and Fu, J. (2009). Measurements of Black and Organic Carbon Emission Factors for Household Coal Combustion in China: Implication for Emission Reduction.
Environ. Sci. Technol. 43: 9495–9500.
Chow, J.C., Watson, J.G., Pritchett, L.C., Pierson, W.R., Frazier, C.A. and Purcell, R.G. (1993). The DRI Thermal/Optical Reflectance Carbon Analysis System: Description, Evaluation and Application in U.S. Air Quality Studies. Atmos. Environ. 27A: 1185–1201. Chow, J.C., Watson, J.G., Pritchett, L.C., Crow, D.,
Lowenthal, D.H. and Merrifield, T. (2001). Comparison of IMPROVE and NIOSH Carbon Measurements. Aerosol
Sci. Technol. 34: 23–34.
Marter-Zhang et al., Aerosol and Air Quality Research, 14: 1779–1788, 2014 1787 Kenyon, J., Pennise, D., Charron, D. and Xia, Z. (2013).
Measurement and Modeling of Indoor Air Pollution in Rural Households with Multiple Stove Interventions in Yunnan, China. Atmos. Environ.67: 161–169.
Dasgupta, S., Huq, M., Khaliquzzaman, M., Pandey, K. and Wheeler, D. (2006). Indoor Air Quality for Poor Families: New Evidence from Bangladesh. Indoor Air 16: 426–444.
Department of Industry and Transport Statistic State Statistic Bureau of China, Bureau of Energy of National Development and Reform Commission (2008). Chinese
Energy Statistic Yearbook 2007, China Statistics Press,
Beijing.
Dusek, U., Frank, G.P., Hildebrandt, L., Curtius, J., Schneider, J., Water, S., Chand, D., Drewnick, F., Hings, S., Jung, D., Borrmann, S. and Andreae, M.O. (2006). Size Matters more than Chemistry for Cloud-nucleating Ability of Aerosol Particles. Science 312: 1375–1378.
Englert, N. (2004). Fine Particles and Human Health- A Review of Epidemiological Studies. Toxicol. Lett. 149: 235–242.
Fischer, S.L. and Koshland, C.P. (2007). Daily and Peak 1h Indoor Air Pollution and Driving Factors in a Rural Chinese Village. Environ. Sci. Technol. 41: 3121–3126. Gao, J., Wang, T., Zhou, X., Wu, W. and Wang, W. (2009).
Measurement of Aerosol Number Size Distributions in the Yangtze River Delta in China: Formation and Growth of Particles under Polluted Conditions. Atmos. Environ. 43: 829–836.
Hays, M.D., Geron, C.D., Linna, K.J. and Smith, N.D. (2002). Speciation of Gas-phase and Fine Particle Emissions from Burning of Foliar Fuels. Environ. Sci. Technol. 36: 2281– 2295.
He, G., Ying, B., Liu, J., Gao, S., Shen, S., Balakrishnan, K., Jin, Y., Liu, F., Tang, N., Shi, K., Baris, E. and Ezzati, M. (2005). Patterns of Household Concentrations of Multiple Indoor Air Pollutants in China. Environ. Sci. Technol. 39: 991–998.
Jacobson, M.Z. (2004). Strong Radiative Heating Due to the Mixing State of Black Carbon in Atmospheric Aerosol.
Nature 409: 695–697.
Jin, Y., Zhou, Z., He, G., Wei, H., Liu, J., Liu, F., Tang, N., Ying, B., Liu, Y., Hu, G., Wang, H., Balakrishnan, K., Watson, K. Baris, E. andEzzati, M. (2005). Geographical, Spatial, and Temporal Distributions of Multiple Indoor Air Pollutants in Four Chinese Provinces. Environ. Sci.
Technol. 39: 9431–9439.
Kaufman, Y.J. and Koren, I. (2006). Smoke and Pollution Aerosol Effect on Cloud cover. Science 313: 655–658. Li, X., Wang, X., Duan, L., Hao, J. and Nie, Y. (2009).
Carbonaceous Aerosol Emissions from Household Biofuel Combustion in China. Environ. Sci. Technol. 43: 6067– 6081.
Lian, J., Ren, Y., Chen, J., Wang, T. and Cheng, T. (2009). Distribution and Source of Alkyl Polycyclic Aromatic Hydrocarbons in Dustfall in Shanghai, China: The Effect on the Coastal Area. J. Environ. Monit. 11: 187–192. McElroy, M.W., Carr, R.C., Ensor, D.S. and Markowski,
G.R. (1982). Size Distribution of Fine Particles from Coal
Combustion. Science 215: 13–19.
Mengersen, K., Morawska, L., Wang, H., Murphy, N., Tayphasavanh, F., Darasavong, K. and Holmes, N.S. (2011). Association between Indoor Air Pollution Measurements and Respiratory Health in Women and Children in Lao PDR. Indoor Air 21: 25–35.
Menon, S., Hanseb, J., Nazarenko, L. and Luo, Y. (2002). Climate Effects of Black Carbon Aerosols in China and India. Science 297: 2250–2253.
Mumford, J.L., He, X.Z., Chapman, R.S., Cao, S.R., Harris, D.B., Li, X.M., Xian, Y.L., Jiang, W.Z., Xu, C.W., Chuang, J.C., Wilson, W.E. and Cooke, M. (1987). Lung-cancer and Indoor Air-pollution in Xuan-wei, China. Science 235: 217–220.
National Bureau of Statistics (2002). China Energy Statistical
Yearbook 2000, China Statistics Press, Beijing.
National Bureau of Statistics (2007). China Energy Statistical
Yearbook 2005, China Statistics Press, Beijing.
Nel, A. (2005). Air Pollution-related Illness: Effects of Particles. Science 308: 804–806.
Oberdorster, G. (2001). Pulmonary Effects of Inhaled Ultrafine Particles. Int. Arch. Occup. Environ. Health 74: 1–8.
Pope, C.A., Burnett, R.T., Thun, M.J., Calle, E.E., Krewski, D., Ito, K. and Thurston, G.D. (2002). Lung Cancer, Cardiopulmonary Mortality, and Long-term Exposure to Fine Particulate Air Pollution. J. Am. Med. Assoc. 287: 1132–1141.
Ramanathan, V., Crutzen, P.J., Kiehl, J.T. and Rosenfeld, D. (2001). Aerosol, Climate, and the Hydrological Cycle.
Science 294: 2119–2124.
Ren, Y., Cheng, T. and Chen, J. (2006). Polycyclic Aromatic Hydrocarbons in Dust from Computers: One Possible Indoor Source of Human Exposure. Atmos. Environ. 40: 6956–6965.
Satheesh, S.K. and Ramanathan, V. (2000). Large Differences in Tropical Aerosol Forcing at the Top of the Atmosphere and Earth’s Surface. Nature 405: 60–63.
Schauer, J.J., Mader, B.T., Deminter, J.T., Heidemann, G., Bae, M.S., Seinfeld, J.H., Flagan, R.C., Cary, R.A., Smith, D., Huebert, B.J., Bertram, T., Howell, S., Kline, J.T., Quinn, P., Bates, T., Turpin, B., Lim, H.J., Yu, J.Z., Yang, H. and Keywood, M.D. (2003). ACE-Asia Intercomparison of a Thermal-optical Method for the Determination of Particle-phase Organic and Elemental Carbon. Environ.
Sci. Technol. 37: 993–1001.
Schulz, H., Harder, V., Ibald-Mulli, A., Khandoga, A., Koenig, W., Krombach, F., Radykewicz, R., Stampfl, A., Thorand, B. and Peters, A. (2005). Cardiovascular Effects of Fine and Ultrafine Particles. J. Aerosol Med. 18: 1–22. Seinfeld, J.H. and Pandis, S.N. (2006). Atmospheric
Chemistry and Physics, from Air Pollution to Climate Change, John Wiley, New York, 1203 pp.
Shen, G., Tao, S., Wei, S., Chen, Y., Zhang, Y., Shen, H., Huang, Y., Zhu, D., Yuan, C., Wang, H., Wang, Y., Pei, L., Liao, Y., Duan, Y., Wang, B., Wang, R., Lv, Y., Li, X. and Zheng, X. (2013). Field Measurement of Emission Factors of PM, EC, OC, Parent, Nitro- and Oxy- Polycyclic Aromatic Hydrocarbons for Residential Briquette, Coal
Zhang et al., Aerosol and Air Quality Research, 14: 1779–1788, 2014 1788
Cake, and Wood in Rural Shanxi, China. Environ. Sci.
Technol. 47: 2998–3005.
Shindell, D., Kuylenstierna, J.C.I., Vignati, E., Van Dingenen, R., Amann, M., Klimont, Z., Anenberg, S.C., Muller, N., Janssens-Maenhout, G., Raes, F., Schwartz, J., Faluvegi, G., Pozzoli, L., Kupiainen, K., Hoglund-Isaksson, L., Emberson, L., Streets, D., Ramanathan,V., Hicks, K., Oanh, N.T.K., Milly, G., Williams, M., Demkine, V. and Fowler, D. (2012). Simultaneously Mitigating near-term Climate Change and Improving Human Health and Food Security. Science 335: 183–189.
Sinton, J.E., Smith, K.R., Peabody, J.W., Liu, Y., Zhang, X., Edwards, R. and Gan, Q. (2004). An Assessment of Programs to Promote Improved Household Stoves in China. Energy Sustainable Dev. 8: 33–52.
Smith, K.R., Mehta, S., Maeusezahl-Feuz, M. (2004). Indoor Air Pollution from Household Solid Fuel Use. In
Comparative Quantification of Health Risks: Global and Regional Burden of Disease Attributable to Selected Major Risk Factors, Ezzati, M., Lopez, A.D., Rodgers,
A. and Murray, C.J.L. (Eds.), World Health Organization, Geneva, Switzerland, p. 1435–1493.
Venkataraman, C., Habib, G., Eiguren-Fernandez, A., Miguel, A.H. and Friedlander, S.K. (2005). Residential Biofuels in South Asia: Carbonaceous Aerosol Emissions and Climate Impacts. Science 307: 1454–1456.
Wang, S., Wei, W., Du, L., Aunan, K. and Hao, J. (2010). Air Pollutants in Rural Homes in Guizhou, China-Concentrations, Speciation, and Size Distribution. Atmos.
Environ. 44: 4575–4581.
Wardoyo, A.Y.P., Morawska, L., Ristovski, Z.D. and Marsh, J. (2006). Quantification of Particle Number and Mass Emission Factors from Combustion of Queensland Trees.
Environ. Sci. Technol. 40: 5696–5703.
Wilson, W.E., Stanek, J., Han, H.S., Johnson, T., Sakurai, H., Pui, D.Y.H., Turner, J., Chen, D.R. and Duthie, S. (2007). Use of the Electrical Aerosol Detector as an Indicator of the Surface Area of Fine Particles Deposited
in the Lung. J. Air Waste Manage. Assoc. 57: 211–220. Zhang, H., Ye, X., Cheng, T., Chen, J., Yang, X., Wang, L.
and Zhang, R. (2008). A Laboratory Study of Agricultural Crop Residue Combustion in China: Emission Factors and Emission Inventory. Atmos. Environ. 42: 8432–8441. Zhang, H., Hu, D., Chen, J., Ye, X., Wang, X., Hao, J.,
Wang, L., Zhang, R. and An, Z. (2011). Particle Size Distribution and Polycyclic Aromatic Hydrocarbons Emissions from Agricultural Crop Residue Burning.
Environ. Sci. Technol. 45: 5477–5482.
Zhang, H., Wang, S., Hao, J., Wan, L., Jiang, J., Zhang, M., Mestl, H.E.S., Alnes, L.W.H., Aunan, K. and Mellouki, A.W. (2012). Chemical and Size Distribution of Particles Emitted from the Burning of Coal and Wood in Rural Households in Guizhou, China. Atmos. Environ. 51: 94– 99.
Zhang, J., Smith, K.R., Ma, Y., Ye, S., Jiang, F., Qi, W., Liu, P., Khalil, M.A.K. and Rasmussen, R.A. (2000). Greenhouse Gases and Other Airborne Pollutants from Household Stoves in China: A Database for Emission Factors. Atmos. Environ. 34: 4537–4549.
Zhang, J.J. and Smith, K.R. (2007). Household Air Pollution from Coal and Biomass Fuels in China: Measurements, Health Impacts, and Interventions. Environ. Health
Perspect. 115: 848–855.
Zhang, Y., Schauer, J.J., Zhang, Y., Zeng, L., Wei, Y., Liu, Y. and Shao, M. (2008). Characteristics of Particulate Carbon Emissions from Real-world Chinese Coal Combustion.
Environ. Sci. Technol. 42: 5068–5073.
Zhi, G., Chen, Y., Feng, Y., Xiong, S., Li, J., Zhang, G., Sheng, G. and Fu, J. (2008). Emission Characteristics of Carbonaceous Particles from Various Residential Coal-stoves in China. Environ. Sci. Technol. 42: 3310–3315.
Received for review, October 7, 2013 Accepted, January 27, 2014
Supplementary Materials
Indoor Emissions of Carbonaceous Aerosol and Other Air Pollutants
from Household Fuel Burning in Southwest China
Hefeng Zhang
1,7, Tong Zhu
1, Shuxiao Wang
1*, Jiming Hao
1, Heidi E.S. Mestl
2,
Line W. H. Alnes
2,3, Kristin Aunan
2,3, Zeqin Dong
4,
Liying Ma
4, Yu Hu
4,
Min Zhang
5, Abdel Wahid Mellouki
6, Fahe Chai
7, Shulan Wang
71 School of Environment, State Key Joint Laboratory of Environment Simulation and Pollution
Control, Tsinghua University, Beijing 100084, China
2 CICERO (Center for International Climate and Environmental Research – Oslo), P.O. Box 1129,
Blindern, N-0318 Oslo, Norway
3 Department of Chemistry, University of Oslo, P.O. Box 1033 Blindern, N- 0371 Oslo, Norway 4 Guizhou Research & Designing Institute of Environmental Science, 1 Tongren Road, Jinyang
New District, Guiyang, Guizhou Province, 550081, China
5 Key Laboratory of Data Analysis and Application, The first Institute of Oceanography, State
Oceanic Administration, Qingdao 266061, China
6 ICARE-CNRS, 1C Avenue de la Recherche scientifique, 45071 Orleans cedex 02, France 7 Atmospheric Environment Istitute, Chinese Research Academy of Environmental Sciences,
Beijing 100012, China
Corresponding author phone: +86-10-62771466; Fax: +86-10-62773650; E-mail: shxwang@tsinghua.edu.cn
Experimental procedure description
Dilution Sampling System.
The dilution sampling system simulates the cooling and dilution processes after
combustion and is widely used to achieve postcombustion quenching and gas/particle
partitioning, which would occur in actual indoor environments, for characterizing
emissions from stationary combustion sources (Fig. S1). A compact dilution sampling
system consists of four main parts: sampling inlet, dilute part, residence chamber, and
sampler. Smoke were entrained into a hood, through the sampling inlet, to the dilution
part and residence chamber, and finally, to the particle sampling instruments.
Smoke were diluted by the purified air and cooled close to ambient temperature.
The dilution ratios for all tests in our measurements are in the range of from 15 to 30,
smoke were cooled to less than 40°C, and the relatively humidity was between 30 and
70%, the aging time of particles before being collected was about 80s, enough time
for vapors condensing onto particles.
The flue gas temperature and concentrations of CO
2, CO and O
2were
continuously monitored by the flue gas analyzer (model KM 9106, Kane). The
instrument was calibrated before each test and the data were recorded every 10 s.
Particles were collected on pre-baked quartz-fiber filters (QFF) during the
measurements using a cyclone inlet particle sampler. A separator inlet of aluminum
triplex cyclone (BGI Inc., Waltham, MA), used in recent source sampling studies (1,
2), was operated at 1.5 L/min to allow flow-through of particles with aerodynamic
diameters smaller than 2.5 µm for collection on the filters.
Before sampling, the quartz-fiber filters (QFF) were baked at 550°C for 4 h to
reduce blank carbon levels. QFF samples were analyzed for black carbon (BC) and
organic carbon (OC) masses using a Thermal/Optical Carbon Analyzer (DRI, Model
2001) with the IMPROVE protocol (3, 4). The emission factors were determined
using the carbon balance method (5). The detailed calculation process are described as
following:
Fig. S1. Schematic graph of dilute sampler system.
The calculation of using carbon balance approach to determine emission factors
The carbon balance method was used to determine BC and OC emission factors.
The carbon balance method assumes the total mass of carbon combusted (carbon in
fuel less carbon remaining in ash) equals the total mass of carbon emitted as
carbonaceous aerosols and carbonaceous gases such as CO
2, CO, CH
4, and NMHCs.
The following equation describes the approach:
C
f– C
a= C
CO2+ C
CO+ C
CH4+ C
NMHCs+ C
PM(1)
where:
C
fand C
adenote the carbon mass in the fuel and ash, respectively.
C
CO2, C
CO, C
CH4, C
NMHCsand C
PMare the carbon mass in CO
2, CO, CH
4, non-methane
hydrocarbons (NMHCs) and particles, respectively.
Sum of OC and BC in PM
2.5are regarded as carbon mass in particles in the
calculation.
The carbon content of the fuel and ash were analyzed using a CHN elemental
analyzer (Model CE-440, Exeter Analytical Inc.). The average concentrations of CO
2