HAL Id: hal-01760780
https://hal.archives-ouvertes.fr/hal-01760780
Submitted on 6 Apr 2018
HAL is a multi-disciplinary open access
archive for the deposit and dissemination of
sci-entific research documents, whether they are
pub-lished or not. The documents may come from
teaching and research institutions in France or
abroad, or from public or private research centers.
L’archive ouverte pluridisciplinaire HAL, est
destinée au dépôt et à la diffusion de documents
scientifiques de niveau recherche, publiés ou non,
émanant des établissements d’enseignement et de
recherche français ou étrangers, des laboratoires
publics ou privés.
Quantitative Description of Internal Activity on the
Ethereum Public Blockchain
Andra Anoaica, Hugo Levard
To cite this version:
Andra Anoaica, Hugo Levard. Quantitative Description of Internal Activity on the Ethereum Public
Blockchain. IFIP NTMS International Workshop on Blockchains and Smart Contracts (BSC), Feb
2018, Paris, France. �hal-01760780�
Quantitative Description of Internal Activity
on the Ethereum Public Blockchain
Andra Anoaica
∗, Hugo Levard
∗†∗IRT SystemX, Paris-Saclay, France, Email: [email protected] †SQLI, Saint-Denis, France, Email: [email protected]
Abstract—One of the most popular platform based on blockchain technology is Ethereum. Internal activity on this public blockchain is analyzed both from a quantitative and qualitative point of view. In a first part, it is shown that the creation of the Ethereum Alliance consortium has been a game changer in the use of the technology. In a second part, the network robustness against attacks is investigated from a graph point of view, as well as the distribution of internal activity among users. Addresses of great influence were identified, and allowed to formulate conjectures on the current usage of this technology. Index Terms—Blockchain, Ethereum, cryptocurrency, smart contract, graph analysis.
I. INTRODUCTION
A transaction between individuals, in the classical sense, requires either trust in each parties, or in a third party. Blockchain solves this problem of trust between the actors by using a consensus algorithm. Beyond the debate on whether or not this technology can be qualified as innovative or simply being an aggregation of already existing building blocks (peer-to-peer protocols, multi-party validation algorithm etc.), it can be reasonably stated that its usage lies on a new paradigm of communication and value exchange . The number of scientific publications dedicated to the general concept of blockchain was multiplied by 15 between 2009 and 2016, which demon-strates both a growing interest for the technical development of blockchains compounds and for its applications in domains for which it has been thought to be potentially disruptive [1]– [6].
Looming over the daily increasing number of available blockchain technologies, Bitcoin is by far the most popular and widely used blockchain. However, in February 2017, a consor-tium of major I.T. and banking actors announced the creation of the Ethereum Alliance, a large project aiming at developing a blockchain environment dedicated to the enterprise based on the Ethereum blockchain. This event suddenly promoted the latter to the level of world wide known and trustworthy blockchain technologies - that up to then only included Bitcoin - making it an essential element of the blockchain world.
Despite an increasing notoriety and a monthly growing fiat money equivalent volume, it remains difficult to find publications dedicated to the establishment of economical and behavioural models aiming at describing internal activity on Ethereum, similarly to the studies performed for the Bitcoin
network [7]–[9]. Concomitantly, global, time-resolved or ma-jor actors-resolved statistical indicators on the past internal activity and on the blockchain network topology are not com-monly found in the literature, while they exist for Bitcoin [10]– [12].
This paper aims at providing basic quantitative insights related to the activity on the Ethereum public network, from the origin, on July 2015, to August 2017. In the first part, correlations in time between internal variables, and between internal variables and the USD/ETH exchange rate are com-puted. A strong sensitivity of the activity to external events is highlighted. In a second part, the network is analyzed from a graph point of view. Its topology and robustness against attacks is investigated, as well as the distribution of internal activity among users. This leads to the identification of major actors in the blockchain, and to a detailed insight into their influence on the Ethereum economy.
II. THEETHEREUMTECHNOLOGY
Similarly to Bitcoin, Ethereum is a public distributed ledger of transactions [13]. Yet, the latter differs from the former by major features, among which the existence of smart con-tracts. Smart contracts are pieces of code that execute on a blockchain. Users or other smart contracts can call its functions, in order to store or transfer tokens, perform simple calculations, dealing with multi-signature transactions etc.
The existence of smart contracts allows us to distinguish five different kinds of transactions:
• User-to-user: a simple transfer of tokens from one
ad-dress to another - both adad-dresses can belong to the same physical user.
• User-to-smart contract: a signed call to one of the func-tions of a smart contract.
• Smart contract deployment: a transaction that contains the binary code of a compiled smart contract and sent to a special deployment address.
• Smart smart contract and smart contract-to-user: user calling a smart contract might call another function of the same smart contract, or of another smart contract, or again transfer tokens to a user. These are called internal transactions, and their study is beyond the scope of this paper.
III. DATA SOURCES AND FEATURES CLASSIFICATION
A. Blocks and transactions
In order to collect data, a public Geth [14] node was con-nected to the Ethereum public network. Once synchronised, the blockchain was stored for further analysis. Within this paper, we only deal with validated transactions, i.e. inserted into a block that was mined and added to the main chain before August 31st 2017.
B. Transactions features
Two main transactions features are retained for the analysis.
• address: A hexadecimal chain of characters pointing to an account, that can either be a user or a smart contract. Even though there is no direct link between an address and its user identity, some of them are publicly known to belong to major actors such as exchange platforms or mining pools. The correspondence can be found on open access blockchain explorer websites, such as Etherscan1. • value: the amount of tokens, expressed in wei, transferred through the transaction. The ether/wei conversion rate is a hard coded constant equal to 1018. The time-resolved exchange rate between ether (ETH) and USD is provided by the Poloniex website API.
The notions of uncles, gas and gas price, inherent to block validation protocol on Ethereum, are not investigated in this paper.
1https://etherscan.io/
IV. ACTIVITY ON THEETHEREUM NETWORK
A. Evolution in time of transaction main features
Table I displays the global percentage of the number of transactions and the amount of tokens that each of the three kinds of transactions defined in Section II represents.
Number of transactions Value transferred user-to-user 64.6% 90.5% user-to-smart contract 34.3% 9.5% smart contract deployment 1.1% < 0.1%
TABLE I: Proportions of transactions sent and value transfered through the three kinds of transactions.
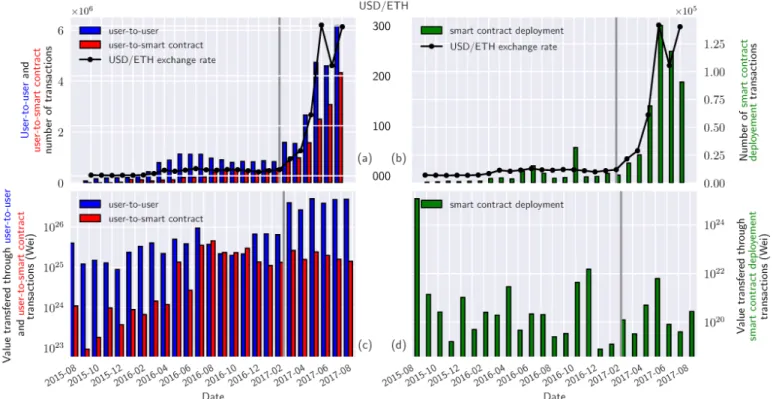
It is worth noting that although the user-to-user transactions gather almost two thirds of the total of all transactions, they carry almost 90% of the transferred amount of tokens. A detailed investigation of the use of smart contracts reveals that most of them have been called only once, but that a small fraction of them have been massively used; this explains the smallness of the number of smart contract deployments compared to the number of user-to-smart contract transactions. Figure 1 displays the monthly total number of transactions and transferred value, respectively, for each of the three categories of transactions defined above. The first two, ranging within the same orders of magnitude, are plotted together for both kinds of plot ((a) and (c)).
1) Number of transactions:
A behavior common to the three categories when it comes to the variation of the number of transactions in time is a
Fig. 1: Number of different transactions and value transfered over time. The gray line highlights the creation of the Ethereum Alliance.
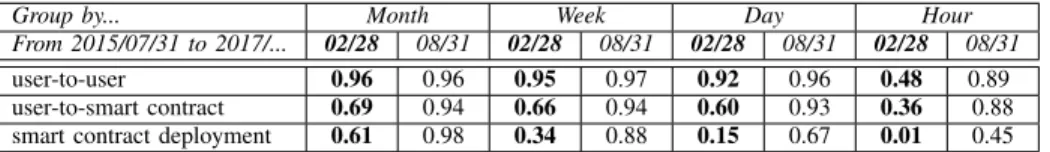
Group by... Month Week Day Hour From 2015/07/31 to 2017/... 02/28 08/31 02/28 08/31 02/28 08/31 02/28 08/31 user-to-user 0.96 0.96 0.95 0.97 0.92 0.96 0.48 0.89 user-to-smart contract 0.69 0.94 0.66 0.94 0.60 0.93 0.36 0.88 smart contract deployment 0.61 0.98 0.34 0.88 0.15 0.67 0.01 0.45
TABLE II: Pearson correlation coefficient over time between the USD/ETH exchange rate and the number of transactions validated, for different aggregation periods (month, week, day and hour), and two time windows - bold figures highlight the time-range ending before the creation of the Ethereum Alliance.
sharp increase from March to August 2017 (top two figures). A very similar trend is observed on the same period concerning the USD/ETH exchange rate, leading to conjecture that these parameters are strongly correlated.
However, a careful examination of these variations reveals that two distinct time windows should be distinguished at this stage when investigating correlations between transactions in-ternal features, and exin-ternal features, on this network. Indeed, the activity on public blockchains such as Bitcoin or Ethereum, as they allow to invest traditional currencies through exchange platforms, may be subject to the same sudden fluctuations as those that can be observed on common market places after external events, such as marketing announcements or financial bankrupts. In the present case, we can reasonably conjecture that there is a causal relationship between the creation of the Ethereum Alliance on February 28th 2017 and the sharp take-off of the above-mentioned features. Considering the renown of the initial partners, this announcement may have promoted Ethereum to a larger audience, even in the non-specialist public, and may have brought a massive interest from individuals resulting in an exponential growth of the activity in terms of number of transactions of all kinds. Hence, the strong correlation that could be calculated between features on a global time range, because of scale effects, may be biased and not reflect a normal behaviour.
To test this hypothesis we computed the Pearson correlation coefficient [15] between the USD/ETH exchange rate and the number of each of the three kinds of transactions defined above, for four different aggregation time periods, and for two subsets of data, that differ from their latest cut-off date: the first one includes all transactions from the creation date of the blockchain (July 31st 2015) up to the announcement date of the Ethereum Alliance (February 28th2017), while the second one ends on August 31st 2017. Results are displayed in table II.
When considering the entire blockchain lifetime (unbold figures), we observe a strong correlation coefficient between the exchange rate and both the user and the user-to-smart contract number of transactions for all aggregation time sizes (between 0.83 and 0.96), which is consistent with the visual impression discussed above. But when excluding the time range [March 2017-August 2017] (bold figures), such a strong correlation only remains for the user-to-user number of transactions, and for aggregation time sizes no shorter than a day (between 0.92 and 0.95). It turns out that this particular data set is the only one for which the exchange rate variation in
time follows the bump observed between March and October 2016, which explains the low correlation coefficient for the two other kinds of transactions. As was conjecture, the Ethereum Alliance creation announcement seems to have been a game changer on the Ethereum internal activity.
2) Values:
The total exchanged values by unit of time displayed on plots (c) and (d) of Figure 1 are shown on log scales for clarity. The peak of activity, in terms of number of transactions, in the period that follows the Ethereum Alliance creation translates here into an average multiplicative factor of 10 as for the total exchanged value through the user-to-user transactions (bottom left figure), compared to the period that precedes it. As for the range of value transferred through smart contract deployment, it spans two orders of magnitude on the whole blockchain lifetime time window, and shows no substantial correlation with any of the retained features within this study.
To emphasise the rise of interest Ethereum has benefitted between 2016 and 2017, we display in table III the equiv-alent in USD of the total value that circulated within the blockchain during the months of June of these two years. The fluctuation of the average amount of tokens transferred per transaction bears no relation to the sudden increase of both the USD/ETH exchange rate and the number of trans-actions after the Ethereum Alliance creation announcement. The tremendous rise of the total value exchanged is thus a direct consequence of the internal activity increase in terms of number of transaction, and not of a behavior change among the individual addresses in terms of amount of tokens transferred through transactions. The macro perspective presented can be
June 2016 June 2017 Value in million ether 41 411 (+1002%) Value in million USD 589 124,088 (+21,068%)
TABLE III: USD equivalent of the total value that circulated within the Ethereum public blockchain during the month of June 2016 and 2017.
completed by a more granular level view. In the following sections, the topology of the resulted graph is examined in order to obtain a characterization of the addresses, as well as to see if there are certain addresses that stand out.
B. Network analytics
A better understanding of the repartition of transactions at the addresses level is revealed by a graph representation of the activity.
The Ethereum blockchain graph is built by setting the addresses as nodes, the transactions as edges, and using a time window that includes all internal events from the first block on July 31st2015 to August 31st2017. The to-user and user-to-smart-contract are different types of interaction. In this short paper, we thus limit to user-to-user transactions. The resulting graph contains 5,174,983 nodes (unique user addresses) and 33,811,702 edges (transactions).
1) Network scaling and robustness against attack:
The topology is firstly analyzed. Random networks are mod-eled by connecting their nodes with randomly placed links, as opposed to scale-free networks [16], such as the Internet, where the presence of hubs is predominant. Following a scale-free architecture implies that the network is rather robust to isolated attacks, however, remaining vulnerable to coordinated efforts, that might shut down the important nodes. In order to understand potential vulnerabilities of the Ethereum Network, we will investigate the presence of central nodes.
In accordance with a previous study on the Bitcoin network in which it is shown to be scale-free [12], and with what is commonly observed in real networks, a power law distribution of the nodes degree d of the form c · d−α is expected, with c a constant. Such a fit in the case of Ethereum gives α = 2.32, which lies in the observed range for most real networks [16].
2) Centrality on the Ethereum Network:
In order to determine whether the activity is well spread among the users, or whether there exist major actors or activity monopoles, we make use of three different centrality indicators:
• In-Degree/Out-Degree: the number of incoming/outgoing
edges a node is connected to;
• Betweenness Centrality: an indicator that summaries how often a node is found on the shortest path between two other nodes and, when communities exist, how well it connects them;
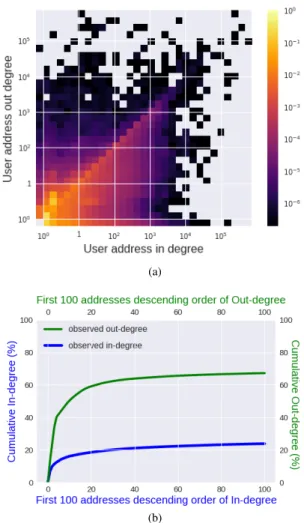
• Left Eigenvector Centrality: a measure of the influence of a node based on the node’s neighbors centrality. Figure 2a depicts the network directed degree distribution discrete probability density p, i.e. the probability for a ran-domly picked node to show a certain in- (di) and out- (do)
degree. The latter are plotted in logarithmic scale for clarity and, by convention, any initial in- (respectively out-) degree value of 0 is plotted with a -1 in- (respectively out-) degree coordinate, to preserve surface continuity. The probability associated with p is denoted P .
It appears that the great majority of users do a rather limited number of transactions, having an in-degree and an out-degree equal to 1 (30.0%), followed by users that just send trans-actions once, never receiving any (20.0%). Firstly, the radial anisotropy is seen subsequent to larger values on the di= do
line, which implies that in- and out-degree distribution are not independent variables: with p(di) and p(do) following a power
law distribution, it seems that p(di, do) 6= p(di) · p(do), and
the proportion of nodes having di= do is 36.9%. It should be
noted that this dependence is consistent with p(di, do) having
a finite value when di or do individually go to 0. Secondly,
(a)
(b)
Fig. 2: (a) Directed degree distribution (logarithmic color scale) upon in-degree and out degree of user addresses ex-pressed as probability; (b) Cumulated in-degree and cumulated out-degree for the first 100 addresses in descending order of their in-degree or out-degree
a mirror asymmetry is observed from one side of the above-mentioned line to the other: P (di 6= do, di > do) = 43.4%,
while P (di 6= do, di < do) = 19.7%. These results suggest
that, regarding the description of degree distribution, more in-formation on the blockchain network could be obtained using a more sophisticated model than a simple power-law [17], contrarily to what was assumed above.
Following these results, the degree spread among addresses is being investigated. Figure 2b shows the cumulative in- and out-degree percentage that represent, over all users, the first 100 addresses in descending order according to their in-degree or out-degree. It reveals that, out of more than 1 million addresses, just 20 addresses account for more than 60% of the transactions sent and 20% of the transactions received. It is then of interest to look for the identity of these addresses and try to infer their public role on Ethereum.
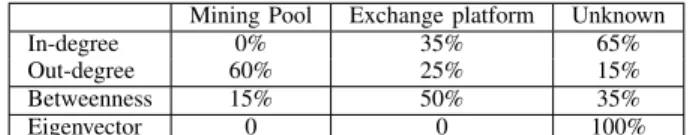
Consequently, we identified the owner of each of the 20 first users in these two lists of addresses, and gather them under three labels, Mining pool, Exchange platform, Unknown,
Mining Pool Exchange platform Unknown In-degree 0% 35% 65% Out-degree 60% 25% 15% Betweenness 15% 50% 35% Eigenvector 0 0 100%
TABLE IV: Public status of the top 20 addresses according to different measurement of centrality
which we assume meaning neither mining poool or exchange platform. Results are displayed in Table IV.
Among the top 20 addresses that send transactions are found 12 mining pools (60%), 5 exchange platforms (25%) and 3 unknown addresses (15%). The top 20 addresses that receive transactions are 7 exchange platforms or addresses related to one of them. The rest of the addresses are unknown. Since the mining retribution is sent to the pool main address only, we can conjecture that around 40% of transactions consist in token redistribution to miners that contribute to a pool. Similarly, because of the lack of services proposing direct payment in ether, it is likely that miners transfer their earned tokens to exchange platforms to convert them into other numeric digital currencies, such as dollar or bitcoin.
The betweenness centrality of the over 1 million nodes lies within the range 0-1%, apart from two addresses for which it reaches nearly 15%. These nodes are important as a high value indicates that a significant number of transactions are connected to this node. How well they connect communities in the network is left for further investigations. Among the top 20 nodes in this category there are 10 exchange services related addresses and 3 mining pools.
Among the 21 unique addresses identified as most cen-tral, none of them belong to the 20 most central addresses in terms of eigenvector centrality. Because the eigenvector centrality awards higher score to nodes connected to other nodes showing a high connectivity, it can be concluded that the most central nodes, from this perspective, are individuals that interact often with major actors, rather than the latter inter-acting with themselves. Inspecting the interaction of services previously identified as central, according to the in- and out-degree and betweenness centrality, we compute for each of these 21 addresses the percentage of transactions in which they take part that connect each of them to other members of the group. It is found that none of them has more than 1.17% of outbound transactions within the group.
The time-independent network topology was investigated and, as for the node directed connectivity, a sharp asymmetry between the in- and out-degree distribution was noticed. A conjecture on the non-independence between these two fea-tures was established. Major actors in terms of number of transactions were identified, as opposed to the vast majority of addresses which are used only once.
V. CONCLUSION
In this paper, quantitative indicators that summarize the internal activity on the Ethereum blockchain were presented.
The study of transaction features temporal variation revealed that the announcement of the Ethereum Alliance creation initi-ated an increase of the activity by several hundred percent,both in terms of number of transactions and the amount of exchange tokens by unit of time. Thus the subsequent caution in the interpretation of time correlations in a blockchain network was highlighted.
The study of the transaction graph revealed that more than 97% of nodes have been engaged in less than 10 transactions. Oppositely, 40 addresses, among which mining pools and exchange platforms, were found to account for more than 60% of the activity, leaving open the question of the health of the Ethereum economic ecosystem.
ACKNOWLEDGMENT
This research work has been carried out under the leadership of the Institute for Technological Research SystemX, and therefore granted with public funds within the scope of the French Program Investissements dAvenir.
REFERENCES
[1] E. Ben-Hamida, K.L. Brousmiche, H. Levard, E. Thea, Blockchain for Enterprise: Overview, Opportunities and Challenges, ICWMC 2017, 91, 2017
[2] M. Mettler, Blockchain technology in healthcare: The revolution starts here, 2016 IEEE 18th International Conference on e-Health Networking, Applications and Services (Healthcom), pp. 1-3, 2016
[3] stampd.io, A document blockchain stamping notary app, [Online], 2017 [4] A. Yasin, L. Liu, An online identity and smart contract management
system, 2016 IEEE 40th Annual Computer Software and Applications Conference (COMPSAC), vol. 2, pp. 192198, 2016
[5] R. Dennis, G. Owen, Rep on the block: A next generation reputation system based on the blockchain, 2015 10th International Conference for Internet Technology and Secured Transactions (ICITST), pp. 131138, 2015
[6] F. Tian, An agri-food supply chain traceability system for china based on rfid blockchain technology, 2016 13th International Conference on Service Systems and Service Management (ICSSSM), pp. 1-6, 2016 [7] S. Athey, I. Parashkevov, V. Sarukkai, J. Xia, Bitcoin pricing, adoption,
and usage: Theory and evidence, 2016
[8] J. Fern´andez-Villaverde, D. Sanches, Can currency competition work?, National Bureau of Economic Research, 2016
[9] J. Chiu, T. Koeppl, The Economics of Cryptocurrencies-Bitcoin and Beyond, 2017
[10] D. Kondor, M. P´osfai, I. Csabai, and G. Vattay, Do the rich get richer? An empirical analysis of the Bitcoin transaction network, PloS one, 9(2), p.e86197., 2014
[11] M. Ober, S. Katzenbeisser, and K. Hamacher, Structure and anonymity of the bitcoin transaction graph, Future internet, 5(2), pp.237-250., 2013 [12] M. Lischke, and B. Fabian, Analyzing the bitcoin network: The first four
years, Future Internet, 8(1), p.7., 2016
[13] G. Wood, Ethereum: A secure decentralised generalised transaction ledger, Ethereum Project Yellow Paper, 2014
[14] https://github.com/ethereum/go-ethereum
[15] W. McKinney, pandas: a foundational Python library for data analysis and statistics, Python for High Performance and Scientific Computing, p. 1-9, 2011
[16] A. Clauset, C. R. Shalizi, and M. E. J. Newman, Power-law distributions in empirical data, SIAM review 51.4, p.661-703, 2009
[17] B. Bollobas, C. Borgs, J. Chayes, O. Riodan, Directed scale-free graphs, Proceedings of the fourteenth annual ACM-SIAM symposium on Discrete algorithms, p 132–139, 2003