Price volatility in
agricultural markets
(2000-2010):
implications for Latin
America and policy
options
Contents
FOREWORD 1
INTRODUCTION 2
I. PRICE INCREASES AND
VOLATILITY, IN PERSPECTIVE 4
II. RECENT EVIDENCE OF VOLATILITY IN AGRICULTURAL PRICES AND
POSSIBLE CAUSES 13
III. A LOOK AT THE IMPACT OF
VOLATILITY IN AGRICULTURAL PRICES 21
IV. EMERGENCY POLICIES AND THE NEED TO DEVELOP LONG-TERM
STRATEGIES TO COPE WITH VOLATILITY 26
STATISTICAL ANNEX 32
REFERENCES 34
Newsletter
ECLAC/FAO/IICA
The Outlook for Agriculture and Rural
Development in the Americas:
In light of recent trends in international agricultural markets, and in the interest of analyzing, contributing to discussions of and making informed decisions on how to address the complex problem of price volatility, we are pleased to present this first issue of the ECLAC-FAO-IICA Bulletin, prepared within the framework of an initiative launched by our institutions in 2009 calling for the annual publication of a document on the state of and outlook for agriculture and rural life in Latin America and the Caribbean.
Since mid-2010 and throughout the early months of 2011, global food prices have been steadily rising, surpassing even the levels reached during the crisis of 2008. For those countries of the region that specialize in the export of raw materials, this increase in agricultural prices affords them a unique opportunity to improve their terms of trade. However, it may also be very costly for them in terms of decreased food security, increased malnutrition and possible social unrest, especially in net food importing countries. The persistence of volatility, which is the result of constant variations in price, will continue to create great uncertainty for farmers, added to the great risks already posed by climate change and recurrent pests and diseases.
The countries of the region face challenges with respect to the implementation and combination of policy instruments, given the unique nature of and the limitations faced by each country. In this first issue, we summarize existing evidence of the volatility in the food and agricultural raw materials markets, the implications of such volatility, and some policy options for addressing the issue. Recognizing that there is no magic formula for solving the problems volatility creates, we believe that the combination of policies applied by each country must address more than the problems of the short term and foster long-term, inclusive economic development that will increase equality, benefitting the most vulnerable segments of its population. To accomplish this, we believe that any agricultural development strategy adopted by the countries must include the implementation of differentiated policies that take into account the marked heterogeneity of the countries of the region.
Alicia Barcena Executive Director Economic Commission for
Latin America and the Caribbean (ECLAC)
Alan Bojanic Officer in Charge Regional Representative for
Latin America and the Caribbean of the United Nations Food and Agriculture
Organization (FAO)
Victor Villalobos Director General Inter-American Institute for
Cooperation on Agriculture (IICA)
INTRODUCTION
During the second half of 2010, increases in food prices again set off alarm bells in the international community. The indices prepared by the relevant international organizations indicate that food prices grew by some 30% (in nominal terms) between
June and December 2010, closing out the year at levels similar to those reached at the height of the rise in prices that occurred in the first semester of 2008 (Figure 1). This trend continued during January 2011, with an increase of 3.4% being reported in the FAO food price index
Figure 1 FOOD PRICE INDICES
Dec. 1991 – Dec. 2010
Sources: World Bank, FAO, IMF, UNCTAD.
This new round of price increases has focused attention on the issue of volatility and its causes, much more so than during the cycle of increases of 2007-2008. Two fundamental questions emerge in the current context. The first is: how much of this increase can be attributed to volatility created by short-term factors, and how much to prices converging at a higher level as a result of structural factors. The other is: with respect to volatility, what is the role of factors such as speculation in the markets for raw materials, uncertainty
regarding the pace of the recovery of the world economy, the application of measures designed to restrict trade, the declining value of the dollar, the over-reaction of agents in the markets to announcements of lower than expected harvests, among others. The object of the present document is not to answer these questions, but rather to provide input for a discussion on them.
Volatility is determined by the speed, magnitude and change in direction of the rate
of variation in prices. From a statistical standpoint, the greater the magnitude of its rate of change (up or down), the greater the speed of such change and the more changes there are in opposite directions, the more volatile a price will be.
For the countries of Latin America and the Caribbean (LAC), volatility has different implications, depending on the relationship between the structure of their exports and imports and the behavior of the prices of the products they export or import. In addition, at the national level, the transmission of volatility may increase or decrease, depending on variations in exchange rates and the adoption of policy measures (See Section IV). The current high volatility in the agricultural raw materials market has important economic implications for those countries that specialize in the export of such materials. Using price data from the 18th century, Jacks, et al. (2009) concluded that volatility in the prices of raw materials has always been higher than that of manufactured products. Consequently, dependence on the export of a few commodities is a fundamental cause of instability in the terms of trade by the countries that specialize in their production, and makes them more vulnerable economically.
Volatility in the prices of agricultural raw materials can have serious consequences for countries: losses in economic efficiency, increased food insecurity, more malnutrition, negative impacts on their trade balance, possible social unrest and greater risks for
producers, especially small-scale producers, due to uncertainty regarding expected levels of income.
There is a broad range of policy instruments available for addressing the issue of volatility. However, the countries’ ability to apply them is determined by the level of development of the institutions, the existence of the necessary technical expertise and any commitments they have assumed under international agreements. In addition, some instruments that may be useful in the short term may not be in the long term.
One of the big challenges facing countries therefore, is to effectively combine policy instruments, taking into account the current international context and social and production-related conditions in each nation, addressing short-term problems without losing sight of the long term, and considering any international commitments assumed and budget constraints faced by each country. The purpose of this bulletin is to review evidence of the existence of greater volatility in the agricultural raw materials markets, the implications of such volatility, and policy options for addressing the problem. The document comprises four sections. Section I addresses recent trends in the prices of agricultural raw materials vis-à-vis the increase in the first semester of 2008; Section II reviews the existing evidence of the existence of greater volatility; Section III focuses on the implications of increased volatility; and Section IV presents policy options for addressing volatility.
I. PRICE INCREASES AND VOLATILITY, IN PERSPECTIVE
When considering changes in the price of agricultural commodities, one must distinguish between changes in trend and mere fluctuations (volatility). Changes in trend occur over medium- or long-term periods and are due to structural alterations in the factors affecting supply and demand – in this case food. Volatility, on the other hand, is a technical concept, which refers to changes in rates of price variation over successive periods of time. There is a great deal of volatility when prices are rising and falling frequently.
In recent years there has been an upward trend in the price of agricultural commodities, as a result of changes in certain factors affecting food demand. Among the most significant changes are the increase in the purchasing power of major segments of the population in countries such as China and India and the shift towards a more westernized diet. The price trend for most agricultural commodities during the past decade has been an upward one.
However, volatility too has increased significantly in recent years. In fact, 2008 saw greater volatility than any year since the crisis that occurred in the first half of the 1970s. Factors affecting volatility are associated with more circumstantial variables that operate over the short term, such as supply shocks (for example, a poor harvest in a major producing country), variations in exchange rates between the United States dollar and other currencies, and expectations in financial markets (see section II for further discussion). The year 2010 was one of high volatility, be it as a result of overreaction to crop forecasts in some countries, the effect of climatic events (e.g., the fire in the Russian Federation) or changes in expectations about the course of the global economy, particularly with regard
to the pace of recovery following the crisis of 2008-2009.
This section analyses price trends and volatility for major agricultural products and inputs in recent years, taking into account differences between product groups and time periods. Particular attention is afforded to the behaviour of prices during the crisis of 2007-2008, as compared with the first five years of the 2000s, and to what has happened in the second half of 2010. These two periods have raised concern within the international community over the speed and magnitude of price changes for various agricultural products. The authors found, however, that the scale of the increase, the nature of the products involved and the degree of price volatility has been different in each individual case.
Not all prices have behaved alike
In real terms, since 2006, average semi-annual prices for major agricultural commodities have exceeded the averages for 2000-2005. The range of difference varies considerably by product, with four distinct situations identifiable (see figure 2).
The first observation to make is the sustained increases observed in the prices of tropical products (coffee, sugar and bananas) and in non-food commodities (rubber and cotton); second, as of the latter half of 2008, stabilization at roughly 50% -100% above the 2000-2005 average for edible oils (except peanut) and soybean complex products; third, an increase of less than 25% in meat products; and fourth, high variability in the price of grain and fertilizer.
Figure 2:
REAL PRICES OF AGRICULTURAL PRODUCTS
In the case of cereals, wheat and maize prices have behaved differently from those for rice. Compared to the average for 2000-2005, average semi-annual real prices for wheat and maize rose consistently through the first half of 2008 and then declined, until the first half of 2010, to levels similar to those in the first semester of 2007. However, both rose significantly during the second half of 2010. In the case of rice, by contrast, the real average 6-month price prior to the rise in 2007-2008 was approximately 30% higher than during the first half of the decade. Following the jump in the first half of 2008, when the price reached 150% of the 2000-2005 average, prices stabilized in the second half of 2001 at around 100% above that average.
With regard to fertilizer prices, real 6-month prices prior to the crisis of 2007-2008 were already between 25% and 50% higher than the 2000-2005 average. After the increase in the first semester of 2008, prices in the second half of the year returned to pre-crisis levels but then began to rise sharply again until the end of 2010. For example, during the second half of 2010, the real average price of urea was 90% higher than the 2000-2005 average; other fertilizers increased at even higher rates: rock phosphate at 156%, potassium chloride at
137%, di-ammonium phosphate (DAP) at 113.5%, and triple superphosphate (TSP) at 108.7%. These increases are higher than for most agricultural products and exceed the 2000-2005 average. In the medium term, this exerts additional pressure on prices, since it affects production costs.
Increases in the second half of 2010 occurred across a relatively wide range of products
The previous section shows that after the sharp decline in prices during the second half of 2008, most resumed their upward trend. Thus, the price rise of the second half of 2010 may be viewed as being part of the process of convergence at higher price levels. However, the rate of increase and the contrast with the first half of the year have raised concerns about the role of factors associated with volatility.
The price hike in the second semester of 2010 was seen across a fairly wide range of products.1 In real terms, higher-than-average
1The data used in this section were obtained using online data from
the World Bank (DataBank). The products used in that database are very similar to those used in constructing the FAO, IMF and UNCTAD indices. In fact, in most cases the reference markets for
price increases were seen for food (37.1%). Prices for edible oils and fats rose by 44.0% and for grains by 52.7% - groups that had experienced declines of 6.6% and 18.5%, respectively, during the first half of the year. There was also a significant increase (34.3%) in the price index of other agricultural products (World Bank), including non-food agricultural commodities (cotton, rubber and tobacco). In addition, the fertilizer index rose significantly (36.5%), above the rate of the overall price index for the agricultural sector (29.9%).
Major differences occurred within each group, however. The growing international concern is linked to price rises for wheat and maize, which, along with rice, constitute the main food grains and are a staple in the diet of the poor, particularly in less developed countries. In real terms, the prices of these products rose by 94.4% (wheat) and 63.9% (maize) during the second half of 2010. Large increases also occurred in the price of sugar (76.2%), coffee (30.0% for Arabica), palm and soybean oils (53.9%) and soybeans (34.1%). Among the non-food agricultural commodities, the greatest price rises were in cotton (80.6%) and rubber (33.1%). Particularly notable in terms of their impact on production costs were the jumps in the price of fertilizers such as urea (63.6%), TSP (36.2%) and DAP (32.6%), with these figures reflecting prices in real terms in constant year 2000 United States dollars.
Behaviour of the volatility
Volatility is the variability in the rates at which prices change over time. It relates to the speed, magnitude and direction of the rates of change in prices. Greater price volatility is
the products, as well as the prices used, are the same. What varies from one index to another are the groupings, the products included in each group, and the weighting of the different products. The World Bank is the only source that reports prices and indices in constant prices (FAO began reporting constant-price indices in January 2011, using the same deflator as the World Bank).
correlated with greater magnitude in the rate of change, whether up or down, with the speed at which the change occurs, and with a greater number of changes in the direction of variation (i.e., a combination of increases and decreases). Volatility is therefore measured by indicators calculated on the basis of rates of change in prices.
This paper uses a simple measure of historical volatility (e.g., Jack and others, 2009 and Dvir and Rogoff, 2009), calculated as the standard deviation of the logarithms of the price ratio between pairs of successive periods for a given period of time. For each of the indices and products concerned, the measure of volatility is calculated for annual periods, based on data for monthly averages. This paper used monthly series of food price indices compiled by FAO, UNCTAD, the World Bank and IMF, as well as monthly series of real prices for various agricultural products compiled by the World Bank (figure 3).
The volatility of food price indices reflects the sharp increase in this indicator for 2008 and 2009, when commodity prices first surged, followed by a sudden decline with the onset of the global financial and economic crisis. Regardless of which indices one examines, those years showed the highest volatility, though there were significant differences between indices, due to the different products involved and methodologies employed. In early 2010, food price indices once again became more volatile, although the variations were much smaller than those in 2008-2009. Volatility increased again in the second half of 2010, however, as reflected in price jumps for a number of products - wheat, sugar, bananas and urea, as well as for others not shown in the figures (edible oils, beef and mutton, cotton and rubber). For some of these commodities (wheat, sugar, mutton and cotton), prices were more volatile in 2010 than at any time since, at least, the beginning of the century.
Figure 3
VOLATILITY OF FOOD PRICE INDICES AND OF PRICES FOR AGRICULTURAL PRODUCTS AND INPUTS
(Annualized standard deviation of the logarithm of the ratio between pairs of prices, December 1999 - December 2010, percentages)
Different types of volatility for different products
Two types of volatility can be identified. Type I occurs when the average price changes are not associated with medium-term trends. Type II occurs when the price variations tend to follow trends in the medium term, but with larger relative increases, as in the second half of 2010 (Type IIa) or first half of 2010 (Type IIb). In terms of impact on the sector’s economic agents (e.g., sellers of inputs and producers) and the possible impact on
consumers, Type I volatility causes the greatest uncertainty. Among the products in the group affected by Type I volatility are a combination of basic foods for human consumption (maize, wheat, sugar and edible oils), products important for human consumption and for the production of animal protein (maize, soybeans and soybean cake), raw materials used in ethanol production, which compete with food production directly (maize) and indirectly (sugar), as well as major inputs for agricultural production (urea, potassium chloride).
Heading the group are products that are highly tradable in commodities markets — wheat, maize, soybeans and their derivatives— as well as products that suffered production problems in some major producing countries, where advertisements may have caused markets to “overreact” during the second half of 2010. For example, data on monthly volatility calculated by the Chicago Mercantile Exchange Group (CME Group historical volatility, 2011), using data from futures contracts, indicate that in August price volatility for wheat (one of the products whose prices surged the most in the second half of 2010) was the fifth highest in the last decade, surpassed only by the values of February, March, August and October of 2008. This greater volatility in August coincided with the announcement that wheat exports from the Russian Federation would
be suspended in anticipation of lower-than-expected yields amid poor weather in major wheat-growing areas of the country. However, there were months of very high volatility in maize (November and December), soybeans (November), soybean oil (November) and ethanol (September and October), whose production relies primarily on maize and sugarcane, which also exhibited Type I volatility under the proposed typology.
The products which show Type II price volatility, i.e., those more closely aligned with the medium-term trend, are mutton, cotton, coffee, beef, rubber, and the fertilizers DAP, TSP and rock phosphate. Several of these products are associated with shifts in consumption patterns (e.g., coffee, meat) and increased demand for industrial raw materials (e.g., cotton, rubber).
Table 1
TREND AND VOLATILITY IN PRICES OF AGRICULTURAL PRODUCTS AND INPUTS
(Growth rates of the average values between periods)
Product Average 2005-2010 vs. average 2000-2005 Average Sem I 2010 vs. average 2000-2005 (A) Average Sem II 2010 vs. average 2000-2005 (B) Volatility B/A Dec 2009 – Jun 2010 Jun – Dec 2010
Products with high variability 2010 vs. medium-term (2000-2005 vs. 2005-2010) Volatility Type I Wheat USA/HR 41.3 12.8 52.3 4.07 -24.1 94.4 Wheat USA/SR 40.5 28.9 77.0 2.67 -12.2 69.0 Wheat Canada 49.2 33.3 69.9 2.10 -9.8 56.5 Maize 40.0 38.0 75.5 1.99 -7.8 63.9 Soy 39.0 44.6 66.5 1.49 -10.0 34.1 Soybean oil 56.4 61.1 92.5 1.51 -8.8 53.9 Urea 90.2 63.1 93.0 1.47 -12.8 63.6 Bananas 29.3 37.9 54.1 1.43 20.1 -6.5 Palm oil 57.7 78.9 108.4 1.37 0.1 53.9 Chicken 3.9 8.0 10.9 1.36 5.4 -2.1 Soybean cake 39.2 50.4 66.8 1.32 -16.3 28.1 Sugar 58.3 109.9 133.6 1.21 -33.0 76.2 Potassium Chloride 137.0 121.8 129.0 1.06 -20.6 11.0 Rice 76.3 96.9 89.1 0.92 -26.1 20.9
Products that, in 2010, changed in parallel with short-term prices (2000-2005 vs. 2005-2010) Volatility Type II(a)
Cotton Index A 8.0 31.4 71.7 2.28 21.6 80.6
Coffee arabica 55.2 84.9 138.0 1.63 19.9 30.0
DAP 113.6 114.6 146.0 1.27 23.4 32.6
Beef 11.3 26.6 29.4 1.10 4.0 13.4
Rubber 110.6 205.9 225.0 1.09 26.4 33.1
Volatility Type II(b)
Mutton 7.1 10.5 24.3 2.31 15.4 8.2
TSP 108.7 85.5 129.7 1.52 48.4 36.2
Phosphate rock 156.4 134.3 170.3 1.27 37.9 12.0
II. RECENT EVIDENCE OF VOLATILITY IN AGRICULTURAL PRICES AND POSSIBLE CAUSES
Various studies in recent years have analyzed the causes of the crisis in agricultural commodity prices in 2007-2008 (e.g., Heady and Fan, 2008; Mitchell, 2008; World Bank, 2008; Robles and others, 2009; Baffes and Haniotis, 2010; Sinnott and others, 2010; Shaun, 2010). Since many of the causes these studies have examined are structural in nature, their usefulness goes far beyond cyclical aspects of the price rises seen in these years and contribute to a broader understanding of the behaviour of markets for agricultural products and price volatility. Although with varying emphasis, a number of studies focused on a more or less homogeneous set of factors which were seen as possible causes of the crisis. However, most studies offer a qualitative, rather than a quantitative, assessment of these factors, and even those that present empirical results are cautious in drawing conclusions.
The first task would be to list, based on baseline studies, the main sources of volatility in commodities in general, and in agricultural products in particular. Given that commodity supply and demand are relatively inelastic in the short term, supply or demand shocks tend to generate more volatility —or longer periods of excessive variability— in commodity prices than would occur in sectors where supply and demand can be more quickly adjusted to market conditions. Therefore, at least two types of forces could heighten volatility in agricultural markets: those that exacerbate the inelasticity of supply and demand in these products, and those that heighten the frequency and intensity of shocks. Both types can and must be addressed with appropriate policies; however, the complexity with which they have evolved in recent years has created uncertainty about how to interpret them in different contexts, what policies are most effective, and what
specific effects may be expected for different countries and population groups.
Valid questions in this regard include whether the factors contributing to the relative volatility of agricultural markets have changed in the last 10 or 15 years, whether new forces have emerged, and whether some of the structural particularities that make prices especially volatile in those markets have grown stronger. Moreover, there is the question of whether any new forces –or strengthened structural factors— have actually heightened volatility in recent years, or whether there are even newer risks on the horizon that could exacerbate volatility in the near future. There is the further question of how these forces act—specifically in relation to Latin American and Caribbean countries. And there is the question of how these forces can be expected to behave in the coming years. Comparison of the elements present in the food crisis of 2007-2008 with those involved in the crisis of the 1970s reveals some similarities, such as dollar depreciation, rising oil prices, inflationary pressures and widespread climate changes affecting world grain production. In recent years however, new elements such as biofuel production and the “financialization” of commodities markets have emerged, adding complexity to the current scenario.
Gilbert and Morgan (2010) argue that historical analysis of markets for agricultural products shows no increase in volatility over time, and that episodes of high volatility in international prices, as was seen between 2007 and 2008, are usually followed by long periods of price stability. In addition, recent agricultural market volatility appears to be less severe than in the 1970s and 1980s, with the exception of prices for rice. However, Gilbert and Morgan highlight some of the
peculiarities of the behaviour of agricultural markets, which could be regarded as posing an additional risk of increased volatility in the coming years or a longer duration of the current volatility than in past episodes. The analysis performed by these authors is echoed by other studies (Heady and Fan, 2008; Baffes and Haniotis, 2010) that examine recent developments in the functioning of agricultural markets in attempting to explain the peculiarities of the current price cycle and anticipate future trends in those markets.
Supply shocks Climate variability
Historically, the most recurrent source of agricultural price variability has been supply shocks caused by extreme weather events. Given the temporal and geographical spacing of these events, periods of high volatility in agricultural markets have generally tended to be limited to certain seasons, products and regions. Volatility is inherent in agriculture, which is subject to the vagaries of climate. In the past, such periods of volatility have also been limited, with a cyclical element adding to the structural trend of declining prices for agricultural products, as a result of societies developing and income levels rising.
However, in recent decades, increased climate variability has become a major global challenge. The frequency of floods and droughts in the Americas, for example, has grown exponentially since the first recordings in the early twentieth century. According to the OFDA/CRED International Disaster Database (EM-DAT), the frequency of floods and droughts in the Americas rose twenty-fold between the first half of the twentieth century and the first decade of the twenty-first (figure 4). These climatic disasters have generated crop losses worldwide, prompting not only fluctuations in the prices of agricultural products, but also famine in the most vulnerable regions.
Figure 4
Frequency of floods and droughts in the Americas 0 5 10 15 20 25 30 35 40 45 1900 1936 1949 1955 1962 1967 1972 1977 1982 1987 1992 1997 2002 2007 Total de inundaciones 0 1 2 3 4 5 6 7 8 9 1919 1963 1968 1973 1979 1983 1987 1992 1996 2000 2004 2008 Total de sequías
Source: Prepared by the authors, on the basis of “EM-DAT: The OFDA/CRED International Database”.
In analyzing the impacts of extreme weather events and natural disasters, it is common to separate the effects of the event itself (the threat) from the consequences of low resilience in the affected agents and locations (i.e., vulnerability). The greater the vulnerability, the greater will be the negative impact of similar threats. In the case of agriculture, resilience to weather events and natural disasters is primarily determined by proper management of natural resources, the use of early-warning and prevention technologies and the supply of risk management tools, such as climate insurance, making it possible to mitigate and respond quickly to damage. In developing countries, disaster prevention and risk management are
Total droughts Total floods
still unfinished tasks in agriculture; thus, most of the global supply of various agricultural products, which are produced primarily in those regions, is particularly vulnerable to natural disasters.
Some studies (World Bank, 2007; Gilbert and Morgan, 2010) have cited insufficient investment in the sector’s technological development, including some “invisible” issues such as risk management and the sustainable management of resources, especially among small and medium-sized producers, as an important source of vulnerability to natural disasters and, consequently, of increased agricultural price volatility, given the growing climate-related risks. The World Bank (2007) finds that public investment in agriculture is lower in countries dependent on that sector than in urban economies in transition, in terms of both the share of total public investment and, particularly, the sector’s value added. At the same time, international aid for agriculture declined in the last 20 years in absolute and relative terms, slipping from 16% of grants to less than 4%, although some efforts have been made recently to reverse that trend. Finally, in terms of adopting currently available agricultural technologies, there is a gap between the countries of Latin America and the Caribbean as a region and the countries of Asia-Pacific. For example: use of
irrigation is 163% higher in Asia-Pacific than in Latin America and the Caribbean, use of improved grain seeds 23% higher, and use of fertilizers is 134% higher. Comparing Asia-Pacific with Sub-Saharan Africa, the gap is even more striking —with irrigation use as much as 725% higher and fertilizer use 1,362% higher in the Asia-Pacific countries.
Public policy
Beyond extreme climate events that affect agricultural production and its ability to develop in the region, a supply shock can also be caused by public policies. Decisions to increase export tariffs or withhold inventory, even at the same time as increasing supply in a given country or region, can tighten international supply, depending on the country’s share in global production and exports and the tariffs or duties involved. Several countries implemented such policies during the food crisis of 2007-2008 and, although there are no studies measuring the impact on international prices, contagion clearly occurred when various countries defensively followed suit and limited commercial exports of some commodities. Public-policy-driven supply shocks can also occur when supply surges owing, for instance, to tariff cuts (see section IV).
Inset 1. AGRICULTURE AND CLIMATE CHANGE
Climate change affects not only the amount of food produced through crop losses, but also crop productivity. Gradual change in climate causes atmospheric and edapho-climatic changes in the large producing areas, increasing agricultural yields in some places and drastically reducing them in others.* For example, in the Argentine Pampas, soybean productivity is likely to soar from 14% to 42%, while that of maize may decrease by as much as 17%. Wheat productivity could drop by up to 16% or rise by as much as 11%. In Brazil, the outlook for wheat and maize is more worrisome, with expected productivity falls of up to 30% and 15%, respectively.
Soybean yields, on the other hand, could rise by up to 21%. In Central America, maize, the local dietary staple, could see large yield falls of between 21% and 34% in Honduras, Guatemala and Panama. Even more critically, bean yields in Guatemala could drop by 66%. At the regional level, overall grain yields could decline by as much as 10% by 2020 and by as much as 30% by 2050.
Demand shocks Changes in income
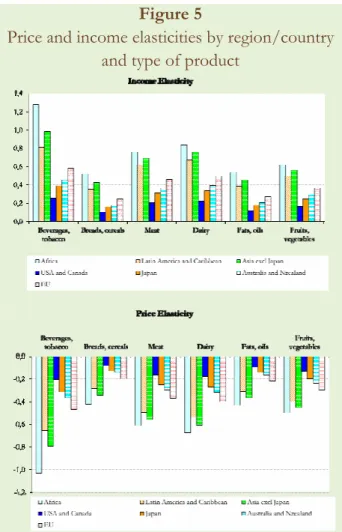
The most common demand shocks are income related. Upward trends in income are usually gradual, especially for the poorest segment of the population, who devote any additional revenues mainly to buying food, which affects demand for agricultural products. Drops in income, however, can occur abruptly, as a result of either economic crisis or cuts to social programmes (because of public expenditure procyclicality in most developing countries) - or both. Here, the effect on price volatility will vary according to the type of product, since the income elasticity of demand for agricultural products varies considerably between products that traditionally form part of the diet of a given population, products that have close substitutes, and those that are consumed selectively – this last category of items being consumed by only a select income group and readily dispensable if income declines.
Figure 5 shows how the price and income elasticities of various foods vary between countries and regions. As the figure shows, the lower the income level, the higher the price and income elasticities of demand. As an economy’s income levels increase as a result of development, demand elasticities tend to decline, which raises a major long-term question about the market for agricultural products. In other words, markets could become more volatile as income levels rise in economies which are now in transition, given the reduction in demand elasticity (unless supply elasticity rises correspondingly). However, to gain a clear picture of the effect on agricultural markets, it would be necessary to consider changes in consumption habits among higher-income groups and opportunities for market segmentation through product differentiation brought about by higher incomes and greater consumer sophistication. Indeed, if consumers substitute
meat for grain as their incomes rise, the ultimate effect on grain markets could potentially be an increase in the average elasticity of demand (as a result of the loss of consumers with low elasticity) and therefore a reduction in volatility.
Figure 5
Price and income elasticities by region/country and type of product
Source: Prepared by the authors from USDA, Economic Research Service, on the basis of ICP data for 1996.
New uses for agricultural products
The discovery of new uses for agricultural products, driven by technological developments (such as the use of biotechnology in agriculture) and social or ideological changes, are additional factors that can, at least in theory, put pressure on demand in the short term. Although these changes are gradual, they often carry incentives (laws, investment decisions by large companies, public policies, etc.) that ultimately
define their economic viability and mark their actual introduction in the market. These are the incentives that can cause volatility in markets, for although some of the trends might already be detectable, supply does not adjust in advance, but only once new market trends begin to take hold. Since agricultural supply is inelastic in the short term - particularly where investment has been historically low, leaving a major technological gap to fill - there is a period of misalignment, with excess demand and greater price volatility.
Effects of the biofuels market
The use of certain agricultural products for biofuels is a clear example of new uses of agricultural crops. Although the technology for producing ethanol and biodiesel has been known for several decades, the development of the biofuels market became feasible -thus opening up an alternative channel for certain agricultural products- only following certain ideological changes and recent political decisions, motivated mainly by the behaviour of the conventional fuels market. Although the political, economic and environmental changes that underpinned the creation of the biofuels market may be relatively stable over time, the relationship of the biofuels and conventional fuels market is not nearly as stable.
Given that the prices of fossil fuels determine the usability, and even the production, of biofuels (and of agricultural products overall, since they serve as inputs), their volatility affects biofuels markets and, therefore, markets for agricultural products that can be used to produce fuels (primarily grains) and for other crops that compete with them for land, water and other resources. However, according to Baffes and Haniotis (2010), the level at which oil prices create a price floor for agricultural commodities is an analytically complex question; other factors such as subsidies, the mix percentage, trade
restrictions and overhead costs for the biofuels industry, must be taken into account. A controversial study by Mitchell (2008) concludes that biofuels production in the United States and Europe accounted for 70% to 75% of the rise in food prices in 2007-2008, because of more limited international availability of grains, changes in land use, increased speculative activity and export restrictions. The remaining 25% to 30% of the food price hike was attributable to high energy prices and a weak dollar. More recently, however, Baffes and Haniotis (2010) concluded that the impact of biofuels on rising food prices was not as great as had previously been thought.
“Financialization” of markets for agricultural commodities
Integration with other markets appears to be one of the main recent sources of increased volatility in the agricultural sector, as indicated in several studies (Robles and others, 2009; Baffes and Haniotis, 2010; Sinnott and others, 2010). These studies address not only integration in a physical market such as the fuels market, or between different types of agricultural products, but look in particular at closer links between commodities markets (including the market for agricultural products) and financial markets. There are numerous reasons for the growing “financialization” of commodities markets. Among these are the growth of financial markets themselves, financial agents’ continuing need to diversify their investments, further deregulation of investment flows in a number of countries (at least in the years prior to the economic and financial crisis of 2008; see FAO, 2010) and increased availability of resources in recent years – an outgrowth of the economic recovery policies implemented in several countries, especially the United States. At the same time, given the prospects of growing demand for commodities in emerging markets, investment in these
markets appears as an attractive alternative to other financing options.
One measure of this growing “financialization” is the volume of futures contracts traded in agricultural products, with volumes increasing sharply in recent years, especially for grain. According to FAO estimates (2010), based on data from the CME Group, futures contracts on agricultural markets grew rapidly after 2000, and particularly since 2005, mostly in response to the deregulation of financial markets around the world. In the case of maize, the volume of contracts traded peaked in early 2008, while for soybeans and wheat the peak was reported later, in late 2009 and mid-2010, respectively, giving these products continuing appeal as an investment alternative, perhaps even more so after the financial-economic breakdown of 2008. In December 2010, the volume of futures contracts on grains and oilseeds was 30.5% higher than in December 2009 (CME Group, 2011).
According to Robles and others (2009) and Torero (2010), the increase in contracts in the futures market for agricultural products is directly related to the increase in futures prices – and, more importantly, spot prices – in these markets. Thus, arbitrage opportunities underpin price rises to levels above what supply and demand behaviour alone would dictate.
Transactions over 24-hour electronic platforms have also increased. Because this mechanism operates in real time, it can increase volatility and magnify agents’ responses to news and other events. The volume of electronically-traded grain and oilseed options on the CME quadrupled between December 2009 and December 2010 (CME Group, 2011).
The effects of growing financialization of the commodities markets are numerous, and it is not clear that the predominant trend in all
markets is towards greater price volatility. Indeed, many financial tools available in the commodities markets were created to help manage risk and, consequently, price volatility. According to Gilbert and Morgan (2010), the futures markets, for example, allow the transfer of risk from commercial to non-commercial agents, providing the markets with sufficient liquidity to meet the necessary productive investment cost, at a lower cost than through conventional means, since financial agents assume some of the risk as part of their speculation strategy. In that case, increased liquidity allows supply to grow faster and at lower cost, improving the responsiveness of producers and potentially reducing volatility.
However, the increased resources being injected in commodities markets respond to opportunities for making a profit in the near future, given the upward prospects for prices. It is not the growing demand in emerging markets that is creating greater volatility in commodities prices, nor is it the financial tools available in those markets (which, as noted earlier, may actually help reduce volatility). However, the herd-type behaviour by investors and the speed and magnitude of investment decisions in financial markets can indeed exert sudden pressures on demand for commodities, even globally, causing massive demand shocks in some of these markets. According to UNCTAD (2009), the number of participants in commodities markets and the size of their positions are not perfectly price elastic, unlike in financial markets. Therefore, relatively large shifts in positions compared to the size of the real market have a temporary or even lingering effect on real prices. This situation can be aggravated by three factors: (a) the “herd” behaviour of a certain group of “uninformed” participants who respond to factors other than market fundamentals; (b) incomplete information on the availability of inventories; and (c) investment funds which, combining some
“herd behaviour” with that of “uninformed” participants, use modern technical analytical tools to identify trends and anticipate changes, incorporating information from other markets outside the commodities markets.
Thus, the speed and magnitude of investment decisions in financial markets can lead to sudden pressure on the demand for commodities, even globally. Although agricultural goods still account for a smaller share of financial investments than energy and mineral products, the resources devoted to that market are following a clear upward trend. As noted earlier, the integration of agricultural products and energy markets, through biofuels and agricultural inputs such as fertilizers and fuel, exerts additional pressure on demand for agricultural commodities.
Effect on foreign-exchange markets
Finally, there is an exchange-rate effect, since international prices of agricultural products, commonly denominated in United States dollars, are subject to the appreciation or depreciation of that currency. Shaun (2010), analysing the factors that drive changes in the longer term (more than one cycle) in the volatility of international food prices, found a significant positive association with several variables, most notably the volatility of inflation in the United States and dollar variability. The recent depreciation of the dollar against most currencies effectively pushed up international prices denominated in United States dollars. The impact of this increase in domestic markets, however, will depend on the exchange rate policy in each country. In countries with a floating exchange rate, rising international prices are usually offset by a roughly proportional appreciation of the domestic currency. Not so in countries that maintain fixed exchange systems, in which international price increases are passed more directly to the domestic market (this is discussed further in section III).
Behaviour of the factors examined, price volatility and effects on the economy
The previous sections attempted to explain the main mechanisms by which price volatility is transmitted in agricultural commodities markets, with emphasis on the emerging forces that are affecting global markets, which function as new channels for transmitting volatility or reinforce more traditional sources of price variability. These emerging forces, however, act differently in different countries, regions and even villages, affecting in various ways the economic actors whose responses will ultimately determine the magnitude and direction of the impact on price volatility. The differential impact of price volatility on economic agents will be discussed in section III. Here, a brief descriptive analysis is offered of recent trends in key determinants of price volatility, assuming that such trends will determine to some extent how volatility will behave in the coming years.
In order to analyse whether a trend change in the volatility of agricultural commodity prices —be it in the form of more frequent price changes, larger price changes or, indeed, more prolonged periods of high volatility— is occurring now or may occur in the near future, three sorts of evidence need to be sought among the potential drivers of volatility: first, the presence of additional factors today compared to the recent past, without any significant reduction in previous factors (i.e., new factors have not simply replaced the old ones, rather, there has been an accumulation of new forces driving volatility); second, an increase in the incidence or variance of the traditional factors; and third, a decrease in economic agents’ capacity to respond to the occurrence of these factors, i.e., a reduction in the elasticity of supply and/or demand for agricultural products. On the first point, it seems clear from previous sections that new forces are
operating in the markets for agricultural products that could lead to a jump in price volatility over the historical trend; of these, integration between the energy market and financial markets would appear to be the most important.
On the second point, the data suggest that the greater frequency of extreme weather events in recent years is probably the most important evidence of a worsening in the factors traditionally responsible for agricultural price volatility.
On the third point, the relative slippage of the agricultural sector as a target for public investment, both in total amounts and in research and development, especially in developing countries with significant internal and external productivity gaps, could reduce the supply elasticity of these products in the short and medium term. At the same time, policies to support agricultural production in developed countries have historically been associated with limited pass-through of international prices to domestic prices and, although these countries have recently adopted reforms aimed at decoupling support from production levels, supply elasticity remains quite low for most of the products concerned (World Bank 2007). On the demand side, the market liberalization of recent years has likely had the opposite effect, increasing the pass-through of international prices to local consumers and thereby increasing demand elasticity.
The effect of commodity price volatility extends to many activities beyond the sectors of production, with broader impacts on the overall economy affecting foreign-exchange earnings, government revenues, productive investment and, hence, growth. Sinott and others (2010) reviewed a long list of empirical studies on the relationship between the volatility of commodity prices and volatility in the terms of trade and in the growth rate, and
concluded that all three types of volatility are positively related, that this relationship is asymmetric (i.e., different with prices trending upward versus downward, and at different levels of volatility), and that the intensity of this relationship depends on the degree of export concentration in commodities, which are subject to greater price volatility.
One of the main mechanisms through which volatility makes the output growth rate more volatile is the increased variability of tax revenues from commodity exports, associated with the procyclical behaviour of public spending in many countries. Moreover, where exports and tax revenues are highly concentrated, institutions often deteriorate, which reduces the possibilities of obtaining public funds from alternative sources and reinforces dependence on volatile tax sources, sharpening the negative effect on the economy.
Indeed, volatility is more damaging to the broader economy in countries whose exports are highly concentrated in commodities (Bhattacharyya and Williamson, 2010; Sinott and others, 2010). This is one of the key aspects differentiating the high-income countries, which are rich in natural resources but whose exports are more diversified, from the commodity-exporting countries of Latin America and the Caribbean, where the impact of volatility on the economy is much greater. In other words, volatility itself may encourage export concentration. Ideally, to prevent that from happening, policies should be deployed to diversify investment and support technological development in sectors deemed strategic - in terms of increasing the prospects for future growth, producing linkages with the rest of the economy, or creating opportunities for technological development in related areas - in order to counteract the forces towards concentration generated by the price boom in a limited set of commodities.
III. A LOOK AT THE IMPACT OF VOLATILITY IN AGRICULTURAL PRICES
The growing volatility of prices in international agricultural markets is a challenge not only for farmers, but also for consumers and decision-makers. Uncertainty regarding the direction that such prices will take in the future has complicated decision-making for almost all economic agents.
Transfer of international prices to domestic prices
Trend and volatility are the most important components of variations in price. The first is defined as a sustained increase or decrease in prices over time, and volatility as unexpected changes (up or down) in prices. Even though most of the studies conducted following the crisis in 2007-2008 have focused on analyzing the impact of the upward trend in prices, and overlooked the impact of volatility, they have yielded interesting findings. The transmission of international prices to domestic prices, for example, determines the impact, on domestic markets, of the trends observed in international prices, which is important in determining the impact on both consumers and farmers.
First, it has been shown that the transmission of international prices is greater in the long term. As a matter of fact, the trend in national and international prices is similar when compared over long periods of time. In other words, while in the short term prices may vary independently, in the medium and long terms domestic and international prices tend to converge (World Bank, 2011). For example, using 76 countries as a reference, Hoyos and Medvedev (cited by de Janvry and Sadoulet, 2010) found that, on average, only 18% of the increase in international prices during the crisis of 2007-2008 was transmitted to domestic markets, showing that the behavior of international markets has limited impact on the movement of domestic prices in the short term.
Another study, which took into consideration wholesale and producer prices of corn and rice in Brazil, Chile, Costa Rica, Guatemala, El Salvador, Nicaragua, Panama and Honduras (Dutoit et al, 2010), found that most of the products analyzed were already present to some degree in international markets. However, of 19 products and markets analyzed, solid evidence of the transmission of prices was found in only five,2 which can be
explained in large part by the fact that imports constitute a large share of total consumption in those countries and by the proximity of importing and exporting countries (Argentina, Uruguay and Brazil). In general, prices are transmitted to wholesale markets faster and more vigorously than to producer markets. Two of the factors that contribute to prices being transferred less or almost not at all are the market power of wholesalers and policies intended to protect producers (such as price-setting).
Secondly, international prices are more volatile than domestic prices. A comparison of the prices of products traded in international markets, such as rice, corn and wheat, reveals that domestic prices are less volatile (FAO- OECD). This is evidence that, in the case of short-term variations, internal factors exert more influence than external ones (the reasons for this will be presented below).
A third finding is that changes in the trend of domestic prices are affected by several factors. Indeed, the extent to which international prices influence the trend in domestic prices is very closely linked to whether or not a country is a net exporter or net importer of a
2 The wholesale price of Brazilian rice, with Argentina;
producer price of Nicaraguan rice, with the U.S.; producer price of Honduran rice, with the U.S.; wholesale price of Panamanian rice, with the U.S., and producer price of Panamanian corn, with the U.S.
given product or is self-sufficient in its production;3 to the existence of distortions in
the domestic markets (monopolies in production, distribution or processing); to the existence of substitute goods in the domestic markets; to the imposition of tariffs and restrictions on imports or exports; to distortions in the exchange rate, and to the existence or lack of close substitutes, as well as other factors. Several studies confirm that there is considerable transmission of prices in the case of some products and markets (e.g., wheat in Ecuador, Dominican Republic and Guatemala and rice in Mexico), and almost none in the case of others (e.g., wheat in Costa Rica and Panama and corn in Guatemala, Mexico and Honduras) (Torero, 2010).
A fourth finding is that there is also indirect transmission of prices to substitute goods. This means that the transmission of international prices may affect the prices of non-tradable goods. To mention only one example, during the 2007-2008 crisis, the high price of rice led to increased consumption of potatoes in some countries of the Andean region, which explains in part the rise in potato prices in domestic markets. In fact, in Peru, the prices paid to potato growers equaled their historic high in April 2008 and, by December 2008, had grown by 80% compared with the same month in the preceding year. A similar situation was found in the case of prices for soft corn and plantain (Arias and Vargas, 2010).
Another important conclusion is that the impact on consumer prices depends on the agricultural production chain in question. The transmission of the international prices of agricultural raw materials to the rest of the
3 If most of the raw material is imported, much of the
volatility of the international price is transmitted to consumers. This is the case in Ecuador, where 95% of wheat is imported. Therefore, its international price is highly correlated with the price consumers pay for bread (Paz, 2010).
chain, and eventually to the prices consumers pay, is highly variable and depends on the nature of the products, on the structure of the chain and on the relative weight of the raw material in the finished product. For example, in those chains in which the relative expenditures on electricity, labor, management costs, depreciation of equipment, patents, packaging and taxes paid by the company are important components of the cost structure of an industry, the volatility of international prices for agricultural raw materials will have a relatively small impact (Paz, 2010).
In addition, several factors contribute to lessening the volatility of domestic prices. One of the most important lessons learnt is that the countries with the greatest capacity to withstand a shock in international prices are those that, in addition to being open to trade, have adopted risk management strategies. Even though it could be said that, in an extreme case of delinkage from the market, price-setting can eliminate domestic volatility (provided there is no price speculation), this measure is very harmful in the long term. For example, countries closely linked to the international market can quickly begin to import food to prevent a rise in domestic prices, should a drought affect domestic production.4 Likewise, they can increase their
exports to avoid a drop in domestic prices in times of surplus. In addition to being open to trade, the countries with sound macro-economic policies (exchange rate, trade, sectoral), as well as private-sector strategies for risk management (inventory control, insurance, future contracts, etc.) experience less price volatility and are less vulnerable to the ups and downs of the international market.
4 However, if a drought occurs in a country heavily
involved in international trade, international prices will skyrocket, affecting volatility in net food importing countries.
A final finding is that there are other factors that can increase the impact of international markets on the volatility of domestic prices. In domestic markets that are closely linked to the international market, it is expected that the difference between the international price and the domestic price will be determined mainly by the cost of international transportation (shipping), the exchange rate, tariffs, other overland shipping costs, as well as the marketing margin of the importer. In this regard, the volatility of domestic prices will increase, not only on the basis of changes in international markets, but also of the variability of exchange rates vis-à-vis the dollar, as well as the cost of transportation, which in turn will be influenced by volatility in energy prices.
Impact of volatility on agricultural incomes
For a farmer, the level and stability of his/her income are equally important. Both components are affected by factors as diverse as yields, the productivity of labor and capital, the weight of input costs in the value of production (input-output relationship), credit worthiness, volatility in the prices of his/her agricultural products and the inputs he/she requires, public policies in support of production, among other variables.
Even though it is difficult to pinpoint the importance of each of these factors in determining the level and stability of agricultural incomes, it could be said that the most serious risks faced by farmers are the result of climatic variability and the volatility of agricultural markets.
Thus, the impact of volatility will depend on the time each actor of the production chain has to make decisions. There is a delay between decisions related to the planting of crops and to the sale of the harvest, which is the greatest risk for a farmer. A farmer who makes decisions related to planting without first knowing what sale price he/she will
receive six or more months later is more vulnerable to unexpected variations in prices, compared with a merchant of the same product whose decisions regarding purchasing and selling are made in much less time. For example, taking international prices as a reference, a corn farmer could face volatilities of up to 40%, while in the case of the merchant the figure could be less than 10%.5
In addition, profitability will depend on how the prices of the final products and agricultural products evolve. When the sale prices of agricultural products are on the rise and input prices do not vary, profitability and production will grow as a direct result of changes in sale prices, and will be limited only by the capacity of production to respond to the application of more inputs (marginal productivity of production becomes negative).6 In contrast, if, in addition to an
increase in sale prices, the prices of inputs rise, production and profitability will increase only if the increase in relative prices is favorable for the farmer (See Inset 2).
Additionally, price volatility has a negative impact on agricultural production and profits because it introduces risks into production and commercial activities that are viewed as an additional cost. Therefore, higher volatility leads to lower agricultural profits and, associated with this, lower levels of production, which in turn makes demand for inputs fall (Robinson and Bary, 1987, Torero, 2010). The current context, characterized by high and increasing volatility, discourages investment, innovation and the desire to increase yields and productivity in agriculture. Nonetheless, the impact on profitability is uncertain when volatility occurs during an upward trend in prices. At present, with prices
5 Monthly volatility and semi-annual volatility, for the
last 20 years, were compared.
6 The use of inputs increases to a point where marginal
rising and becoming more volatile, in order to determine the final impact on agricultural activities it would be necessary to analyze them on a case-by-case basis. However, in general terms, the impact will be favorable if the positive effect of the increase in prices outweighs the negative impact of greater volatility.
Furthermore, the impacts of volatility on agricultural incomes will depend on the existence or lack of risk reduction strategies. For example, a rapid and unexpected variation in agricultural prices will have less of an impact on farmers if they produce a variety of products and average prices do not vary in the same direction (negative correlations). In other words, a farmer can lessen the impact of a drop in the price of one of his/her products if it is compensated by an increase in the price of another. The possibility of reducing risks will be greater if diversified production options are available (depending on agro-ecological conditions) and the correlation between prices is less or negative. A possible difficulty in diversifying production is that, since the beginning of the crisis of 2007-2008, prices have followed a similar trend, which reduces the possibility of substituting one for another.
However, the vertical integration of production can also reduce risks. In fact, the volatility of agricultural incomes will be less for those farmers who engage in two or more production processes, provided that prices are not perfectly correlated and that the volatility in the prices of final products is sufficiently less than that of the intermediate products. Not all famers have access to, or the capacity to participate in futures markets. Even in the United States, where such markets are more well known, the acquisition of coverage against variations in price is less common than might be expected, due primarily to the fact that the decision to participate in them is heavily influenced by the cost of such
participation. However, the more exposed a farmer is to different risks (production, marketing and financial), the more incentive there will be to seek coverage. Farmers with high levels of indebtedness or greater probabilities of suffering illiquidity will be more inclined to acquire coverage. In any case, the optimum level of coverage (which reduces risks to a minimum) is always much less than 100% of production (Arias et al, 2000).
In general terms, price volatility introduces risks into production and commercial activities that are viewed as an additional cost. A farmer will take the decision to become involved in a risky activity if he/she is compensated for the cost of assuming such a risk (Robinson and Barry); in other words, if his/her expected rate of return will increase. Therefore, if the volatility of agricultural prices is not accompanied by the expectation of greater profits, a decline in investment can be expected. In turn, the impact will depend on how much risk an individual is willing to assume to reap higher profits. Some farmers will be, but most are not willing, to become involved in risky activities.
Impact on consumption and well-being of rural households
When attempting to calculate the impact of higher prices on rural households, it is necessary to consider both income derived from the sale of agricultural products and expenditure on food. In the case of agricultural households in particular, the impact on the well-being of the household (measured as changes in consumption) will depend on what percentage of total household income is generated by the sale of agricultural products versus what percentage of total household expenditure can be attributed to the consumption of food.
It is likely, therefore, that very poor rural families who are net buyers of food will be the most vulnerable to volatility in food prices. In
Guatemala and Peru, for example, most families, including those found in agricultural households, will be impacted negatively by an increase in food prices. The impact is even greater in poor families who spend a large percentage of their household budget on food (de Janvry and Sadoulet, 2010), Hernandez et al, n.d.). Evidently, this situation will vary depending on the degree to which they have specialized and diversified production, the percentage of their production earmarked for household consumption, “the terms of trade” of the household - between the products it sells and those it must purchase on the market - and the extent to which it is possible to substitute products from the family food basket.
For example, Robles and Torero (2010) estimate that, as a result of the increase in prices in 2007-2008, the poorest 20% of the populations of Guatemala and Peru reduced their consumption of calories by 8.7% and
18.7%, respectively. Likewise, Zegarra and Tuesta (2008) estimated that the poorest families in Peru, who were also the most vulnerable to food insecurity, would have to have access to US$35 more per month to enable them to consume the same amount of calories as before the crisis of 2007-2008. In addition to the impact generated by the upward trend in prices, the concentration of agricultural markets and other factors explained above cause the prices that rise on the international market to be transmitted easily and rapidly to consumers. However, when they fall, there are rigidities that prevent such decreases from being transmitted easily and rapidly to consumers, impacting negatively on the well-being of households, especially at a time when there are more net increases than net decreases in prices for most staple products, as was the case from 2000-2009 (Bello et al, 2010).
Inset 2
EFFECTS OF THE RISE IN INTERNATIONAL PRICES ON THE INCOME OF SMALL-SCALE FARMERS IN LATIN AMERICA
For the purpose of analyzing the impact of the increase in international agricultural prices on agricultural incomes, IICA conducted a study in 2009 that calculated the variations in the remuneration of all the factors of production (land, capital and labor) as a consequence of the increase in international agricultural prices in 2007-2008. The study estimated the changes in the gross incomes or values of production per hectare, as well as production costs per hectare, especially those of the component of direct inputs, which were also affected by the evolution of prices.
The study calculated indexes of the net incomes of the factors of production, identifying groups of products classified as importable, exportable and non-tradable which, at the end of the process, were deflated by the CPI to obtain a measurement of value added in terms of their purchasing power.
One of the most important findings of the study was that the index of the net incomes of the importable products (corn, wheat, rice and soybeans) showed moderate growth, even though the prices of these products were the ones for which the transmission of prices was the strongest and fastest in the four countries in which the study was conducted (El Salvador, Costa Rica, Peru and Honduras). This was due to much more rapid growth in production costs for this group of products. Despite the fact that the price of inputs grew much more than commodity prices, the weight of input costs in the gross value of production (input-output relationship) is relatively low depending on the technological level of the production chain, which lessens the impact of higher input prices.
IV. EMERGENCY POLICIES AND THE NEED TO DEVELOP LONG-TERM STRATEGIES TO COPE WITH VOLATILITY
Policy measures adopted within the region
The countries of the region have responded to agricultural price volatility in very similar ways. Governments tend to intervene more when prices rise than when they fall; in other words, consumers and inflation have been given relatively more importance than producers and the productive structure of the agriculture sector. Moreover, policy measures have generally focused more on the short-term than on structural problems, even though seeking solutions to such problems could significantly reduce a country’s vulnerability to price volatility.
Some of the policy responses implemented in the region aim to directly counteract the rise in food prices, by eliminating tariffs or by imposing export restrictions, or through price setting, government operations in markets, or establishing agreements between the government and the private agribusiness sector. Other policies have attempted to mitigate risk exposure in specific groups (price bands, in the case of certain agricultural producers), and to counteract the adverse effect of rising prices on vulnerable population groups (food aid, conditional cash transfers, school meals, food-for-work programs, temporary employment, and various other social programs). Lastly, some attempts have been made to strengthen the small-scale basic grain producer sector. Table 2 shows some of the measures commonly adopted by countries in the region, based on the scheme put forward by FAO (2011).
What have developed countries done?
Price volatility, which currently has a high profile on government agendas in the region, has been an issue for decades in developed countries’ agricultural policies. These
countries have traditionally implemented tariff and/or countercyclical marketing policies to stabilize farmer incomes; and they also operate social programs to support low-income population groups. Recently, growing concern about the volatility of agricultural prices has been explicitly included in the preparation of the new Common Agricultural Policy (CAP), and has formed part of the discussions of the 2012 Farm Bill in the United States; it was also a central topic of the summit of G-20 Agriculture Ministers on 22 January 2011.
European Union.- In response to the rise in food prices in 2008, the EU adopted the following measures: (a) sale of intervention reserves; (b) reduction of export drawbacks; (c) suppression of the requirement to withdraw land from production by 2008; (d) increased milk production quotas; and (e) suspension of tariffs on grains. This made it possible to increase domestic supply and thus help stabilize agricultural markets. In the same year, the EU carried out a “health check” on its agriculture policy to ascertain whether the CAP was in a position to deal with the new problems caused by food insecurity, price volatility and the economic crisis. In response to these challenges, the CAP will be reformulated as of 2013. The current CAP, however, has persevered with measures to address the problems caused by volatile prices when these fall to damaging levels, such as the purchase of surpluses (European Commission, 2008).
United States.- As was the case with previous Farm Bills, the current one, covering the period 2008-2012, aims to provide income security to North American farmers. Thus, the United States deals with price volatility mainly through countercyclical payments to its farmers when the market price falls below a specified target level. These payments also