HAL Id: hal-00295699
https://hal.archives-ouvertes.fr/hal-00295699
Submitted on 25 Jul 2005
HAL is a multi-disciplinary open access
archive for the deposit and dissemination of
sci-entific research documents, whether they are
pub-lished or not. The documents may come from
teaching and research institutions in France or
abroad, or from public or private research centers.
L’archive ouverte pluridisciplinaire HAL, est
destinée au dépôt et à la diffusion de documents
scientifiques de niveau recherche, publiés ou non,
émanant des établissements d’enseignement et de
recherche français ou étrangers, des laboratoires
publics ou privés.
radiosonde profiles: A survey of European stations
V. O. John, S. A. Buehler
To cite this version:
V. O. John, S. A. Buehler. Comparison of microwave satellite humidity data and radiosonde profiles:
A survey of European stations. Atmospheric Chemistry and Physics, European Geosciences Union,
2005, 5 (7), pp.1843-1853. �hal-00295699�
www.atmos-chem-phys.org/acp/5/1843/ SRef-ID: 1680-7324/acp/2005-5-1843 European Geosciences Union
Chemistry
and Physics
Comparison of microwave satellite humidity data and radiosonde
profiles: A survey of European stations
V. O. John and S. A. Buehler
Institute of Environmental Physics, University of Bremen, Bremen, Germany
Received: 15 October 2004 – Published in Atmos. Chem. Phys. Discuss.: 15 March 2005 Revised: 17 June 2005 – Accepted: 18 June 2005 – Published: 25 July 2005
Abstract. A method to compare upper tropospheric humid-ity (UTH) from satellite and radiosonde data has been ap-plied to the European radiosonde stations. The method uses microwave data as a benchmark for monitoring the perfor-mance of the stations. The present study utilizes three years (2001–2003) of data from channel 18 (183.31±1.00 GHz) of the Advanced Microwave Sounding Unit-B (AMSU-B) aboard the satellites NOAA-15 and NOAA-16. The com-parison is done in the radiance space, the radiosonde data were transformed to the channel radiances using a radiative transfer model. The comparison results confirm that there is a dry bias in the UTH measured by the radiosondes. This bias is highly variable among the stations and the years. This variability is attributed mainly to the differences in the ra-diosonde humidity measurements. The analysis also shows a difference between daytime and nighttime soundings which is attributed to radiation error in the radiosonde data. The dry bias due to this error alone correspond to approximately 11% relative error in the UTH measurements.
1 Introduction
Radiosonde measurements are important for a large variety of meteorological and climate applications. For example, Peixoto and Oort (1996) have used them for making global climatologies of water vapor and Seidel et al. (2004) and Christy and Norris (2004) have used them for temperature trend analysis. Another important use of radiosonde data is for initialize or assimilate into numerical weather prediction models (Lorenc et al., 1996). The radiosonde data have also been used for detecting super saturation (Spichtinger et al., 2003), identifying and removing biases from data sets (Lan-zante and Gahrs, 2000), and deriving regression parameters
Correspondence to: V. O. John
(vojohn@uni-bremen.de)
(Spencer and Braswell, 1997). The reanalysis procedure also uses radiosonde data (Onogi, 2000; Kistler et al., 2001; An-drae et al., 2004). Another most important application of the data is their use as initial guess for profile retrievals from satellite data (Chaboureau et al., 1998) and validating satel-lite retrieval algorithms (Fetzer et al., 2003).
In spite of the fact that there are several studies which question the quality of radiosonde data (Elliot and Gaffen, 1991; SPARC, 2000), it is inevitable to use radiosonde data to validate satellite retrievals due to unavailability of other better data sets. Recently, there have been several studies which describe the validation of satellite derived upper tro-pospheric water vapor using radiosonde data, for example, Sohn et al. (2001); Jimenez et al. (2004); Buehler and John (2005). But care has been taken in all cases to use quality controlled radiosonde data. Therefore it is important to mon-itor and correct radiosonde data. This motivated us to de-velop a satellite based tool for monitoring global radiosonde stations. The approach follows that of Buehler et al. (2004) and uses microwave data from polar orbiting satellites. As a pilot study we selected the stations from countries which participate in COST Action 723 (COST is an intergovern-mental framework for European Co-operation in the field of Scientific and Technical Research, the details can be seen at http://www.cost723.org). There are 17 countries participat-ing in COST Action 723. Their names, in alphabetical order, are Belgium, Bulgaria, Cyprus, Czech Republic, Denmark, Finland, France, Germany, Greece, Italy, Netherlands, Nor-way, Poland, Spain, Sweden, Switzerland, and the United Kingdom.
The global radiosonde network consists of about 900 ra-diosonde stations, and about two third make observations twice daily. These stations use different types of humid-ity sensors, which can be mainly classified into three cat-egories: capacitive humidity sensor, carbon hygristor, and Goldbeater’s skin hygrometer. The stations selected for this study launch only Vaisala radiosondes which use capacitive
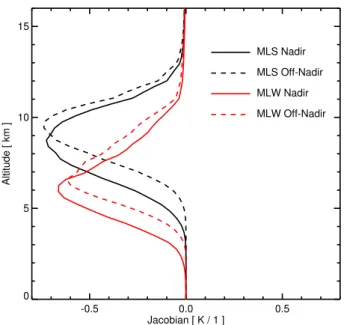
-0.5 0.0 0.5 Jacobian [ K / 1 ] 0 5 10 15 Altitude [ km ] MLS Nadir MLS Off-Nadir MLW Nadir MLW Off-Nadir
Fig. 1. Water vapor Jacobians of AMSU-B channel 18 for a
mid-latitude summer (MLS) and a midmid-latitude winter (MLW) scenarios for nadir and maximum off nadir viewing angles.
-8 -4 0 4 8 12 16 20 24 28 40 44 48 52 56 60 64 68 PL JO JY SO EK ES GR IO KU LI ME MO SC SS BR CE ML PR SP TB UC LE LW WR LC MB MU PM GL LK SU AB BO CA HE HI LA LS NO ST
Fig. 2. The geographical locations of the radiosonde stations used
in this study. These stations launch at least 10 launches per month which reach up to 100 hPa.
humidity sensor. Vaisala radiosondes use thin film capacitors which have an electrode treated with a polymer film whose dielectric constant changes with ambient water vapor pres-sure. There are mainly four versions of Vaisala radiosondes, RS80A, RS80H, RS90, and RS92. The RS80A has a time constant of 100 s at −50◦C and 400 s at −70◦C, thus it will respond to 63% of a step change in humidity over a vertical
distance of 0.5 and 2 km, respectively (SPARC, 2000). The RS80H sensor has a smaller size and responds more quickly than RS80A. The RS90 type radiosondes have an improved humidity sensor, which is designed to solve the problem of sensor icing in clouds. The RS92 type radiosondes have an improved reconditioning procedure which removes all con-taminants from the humidity sensor surface.
Even though the specified absolute accuracy of the Vaisala humidity sensors is 2% RH , there exists a significant dry bias in the humidity measurements (Soden and Lanzante, 1996; Soden et al., 2004; Buehler et al., 2004; Turner et al., 2003; Nakamura et al., 2004). The error sources of this dry bias and a number of correction methods are documented in the liter-ature (Turner et al., 2003; Wang et al., 2002; Leiterer et al., 1997; Roy et al., 2004; Soden et al., 2004; Miloshevich et al., 2001, 2004). Soden et al. (2004) examined the effect of some of these corrections and found that there still remains a sig-nificant dry bias after the corrections. Buehler et al. (2004) also arrived at a similar conclusion about the corrected hu-midity data.
Another important point is that these corrections are ap-plied mostly to the data from special campaigns and not to the data from the global radiosonde network. There exists severe discontinuities in these data due to instrument and launch procedure changes. The monitoring tool developed in this study allows a continuous observation of the perfor-mance of the stations. All stations taken together can also be used to investigate systematic differences between mi-crowave sensors on different satellites.
The structure of this article is as follows: Sect. 2 presents the satellite and radiosonde data, focusing on the properties of the radiosonde data that are relevant for this study. Sec-tion 3 briefly presents the methodology. SecSec-tion 4 discusses the results for different stations for different time periods and satellites, and Sect. 5 presents the conclusions.
2 Data
This section describes the AMSU instrument, the radiosonde data, and basic information on the radiosonde stations such as geographic location and the radiosonde type.
2.1 AMSU-B Data
AMSU-B is a cross-track scanning microwave sensor with channels at 89.0, 150.0, 183.31±1.00, 183.31±3.00, and 183.31±7.00 GHz (Saunders et al., 1995). These channels are referred to as Channel 16 to 20 of the overall AMSU instrument. The instrument has a swath width of approxi-mately 2300 km, which is sampled at 90 scan positions. The satellite viewing angle for the innermost scan positions is
±0.55◦ from nadir, for the outermost scan positions it is
±48.95◦from nadir. This corresponds to incidence angles of
The footprint size is 20×16 km2for the innermost scan po-sitions, but increases to 64×27 km2for the outermost posi-tions.
The AMSU data used in this study were obtained from the Comprehensive Large Array-data Stewardship System (CLASS) of the US National Oceanic and Atmospheric Ad-ministration (NOAA). This is the level 1b data which is not calibrated, but the calibration coefficients are stored in the files. Then the ATOVS and AVHHR processing package (AAPP) was used to calibrate and geo-locate the data. It should be noted that AMSU-B on NOAA-15 has suffered due to radio frequency interference (RFI) which introduced scan dependent biases on the AMSU-B channels, particu-larly on Channels 17, 19, and 20 (Atkinson, 2001). The corrections for RFI are implemented in the level 1b data (for details, see http://www2.ncdc.noaa.gov/docs/klm/html/ m/app-m.htm). Note that we did not apply any calibrations or corrections of our own. There are scan asymmetries observed in AMSU-B data, a detailed discussion on this can be seen in Buehler et al. (submitted 2005). However, for channel 18 the maximum scan asymmetry is below 1.7, 0.5, and 0.49 K for NOAA-15, NOAA-16, and NOAA-17, respectively.
Channel 18 is of interest to this study as the channel sam-ples the atmosphere in the upper troposphere. The sensi-tive altitude of this channel is shown for midlatitude sum-mer (MLS) and winter (MLW) atmospheres in Fig. 1 which displays water vapor Jacobians for the nadir and the maxi-mum off-nadir instrument viewing angles. The peak of the sensitive altitude shifts from 6 km for the MLW atmosphere to 9 km for the MLS atmosphere. The sensing altitude shifts by about 1 km as the instruments scans from the nadir to the maximum off-nadir viewing angle.
2.2 Radiosonde data
Radiosonde data used in this study were obtained from the British Atmospheric Data Centre (BADC). The radiosonde data archive at BADC consists of global operational ra-diosonde data. The humidity values are stored in the form of dew point temperatures. For the study, the dew point tem-perature was converted to actual water vapor pressure using the Sonntag formula (Sonntag, 1994).
Table 1 gives the short name, longitude, latitude, ra-diosonde type, location, and country of each station. The locations of the stations are shown in Fig. 2. As AMSU-B channels are sensitive up to 100 hPa, the launches which reach at least up to this pressure level are used for the com-parison. In order to have enough matches, only those sta-tions which have at least 10 launches per month are included in this study. It should be noted that some of the countries do not have any station satisfying the above condition. All the selected stations launch Vaisala RS80 or RS90 radioson-des instruments. To our knowledge, there were no instru-ment changes during the study time period except for the UK station HE, therefore data from different sensors are not
mixed up while calculating statistics for different stations. Out of 40 stations, 15 launch RS90 sondes and 6 use an AU-TOSONDE facility. The AUAU-TOSONDE (AU) system im-proves the availability and quality of the data by launching the sondes at a preset time, receiving the radiosonde signals automatically, processing the signal into meteorological mes-sages, and transmitting the messages to the external network. The BADC archive contains low resolution radiosonde data, i.e., the vertical data levels are only standard and sig-nificant pressure levels. The sigsig-nificant levels are added to ensure that a linear interpolation of the profile approximates the real profile. It was found that the properly interpolated low resolution data are sufficient to represent layer averaged quantities such as upper tropospheric humidity (UTH) and to simulate AMSU-B radiance which is sensitive to UTH (Buehler et al., 2004).
3 Methodology
This section briefly describes the methodology of the com-parison. For more details, the reader is referred to Buehler et al. (2004), henceforth referred to as BKJ.
In this study, the comparison of humiditiy from satellite and radiosonde is done in radiance space. This means, the satellite radiances are not inverted to temperature and wa-ter vapor profiles to compare with the radiosonde profiles. Instead, satellite radiances are simulated for the radiosonde profiles. This type of comparison has already been done us-ing infrared satellite data (Soden and Lanzante, 1996; Soden et al., 2004). A comparison of this type using microwave radiances was first done by BKJ, and this study is based on that work. One advantage of this kind of comparison is that it is not necessary to do the inversion of satellite radiances to atmospheric profiles, which is a non-trivial problem. Sim-ulating radiances from radiosonde profiles using a radiative transfer (RT) model is rather straight forward and introduces fewer uncertainties.
The RT model used in this study is ARTS (Buehler et al., 2005). ARTS is a line-by-line model which has been com-pared and validated against other models (John et al., 2002; Melsheimer et al., 2005). The setup of the radiative transfer calculations is similar to that in BKJ.
It is difficult to match a radiosonde profile with a single AMSU pixel, because the sonde drifts considerably during its ascent. A target area was defined around each radiosonde station, which is a circle of 50 km radius. The circle normally contains 10–30 pixels depending on the satellite viewing an-gle. The average of the pixels in this circle is then compared to the radiance simulated using the corresponding radiosonde data. Simulations are also done for each pixel in the target area taking into account the satellite viewing angle, and then averaged to get the representative radiance for the radiosonde data.
Table 1. Information of the selected radiosonde stations.
No. Stn. Lon Lat RS Type Location Country
1. PL 14.45 50.02 RS90 Praha-Libus Czech Rep.
2. JO 23.50 60.82 RS80 Jokioinen Finland
3. JY 25.68 62.40 RS90 Jyvaskyla Finland
4. SO 26.65 67.37 RS90 Sodankyla Finland
5. EK 7.23 53.38 RS80 Emden-Koenigspolder Germany
6. ES 6.97 51.40 RS80/AU Essen Germany
7. GR 13.40 54.10 RS80 Greifswald Germany 8. IO 7.33 49.70 RS80 Idar-Oberstein Germany 9. KU 11.90 49.43 RS80 Kuemmersruck Germany 10. LI 14.12 52.22 RS80 Lindenberg Germany 11. ME 10.38 50.57 RS80 Meiningen Germany 12. MO 11.55 48.25 RS80 Muenchen-Oberschleissheim Germany 13. SC 9.55 54.53 RS80 Schleswig Germany
14. SS 9.20 48.83 RS80/AU Stuttgart-Schnarrenberg Germany
15. BR 17.95 40.65 RS90 Brindisi Italy
16. CE 9.07 39.25 RS90 Cagliari-Elmas Italy
17. ML 9.28 45.43 RS90 Milano-Linate Italy
18. PR 12.43 41.65 RS80 Pratica-di-Mare Italy
19. SP 11.62 44.65 RS80/AU S. Pietro Capofiume Italy
20. TB 12.50 37.92 RS90 Trapani-birgi Italy 21. UC 13.18 46.03 RS90 Udine-Campoformido Italy 22. LE 17.53 54.75 RS90 Leba Poland 23. LW 20.97 52.40 RS90 Legionowo Poland 24. WR 16.88 51.12 RS90 Wroclaw Poland 25. LC −8.42 43.37 RS90 La-Coruna Spain
26. MB −3.58 40.50 RS80/AU Madrid-Barajas Spain
27. MU −1.17 38.00 RS80 Murcia Spain
28. PM 2.62 39.55 RS80/AU Palma-de-Mallorca Spain 29. GL 12.50 57.67 RS90 Goteborg-Landvetter Sweden 30. LK 22.13 65.55 RS90 Lulea-Kallax Sweden 31. SU 17.45 62.53 RS90 Sundvall-Harnlsand Sweden 32. AB −4.57 52.13 RS80 Aberporth UK 33. BO −1.60 55.42 RS80 Boulmer UK 34. CA −5.32 50.22 RS80 Camborne UK 35. HE 0.32 50.90 RS80/AU Herstmonceux-west-end UK 36. HI −6.10 54.48 RS80 Hillsborough-MetOffice UK 37. LA −1.80 51.20 RS80 Larkhill UK 38. LS −1.18 60.13 RS80 Lerwick UK 39. NO −1.25 53.00 RS80 Nottingham UK 40. ST −6.32 58.22 RS80 Stornoway-Airport UK
Another issue in the comparison is the difference between radiosonde launch time and the satellite over pass time. Ide-ally, the satellite and the radiosonde should sample the same air parcel for a one to one comparison. This can be achieved only if the time difference is small, but this can be often as large as 3 h. Moreover, the BADC data files do not contain the exact time of radiosonde launch. But the practice is that the sondes are launched one hour before the synoptic hour so that they reach 100 hPa by the synoptic hour. Therefore we take half an hour before the synoptic hour as the mean launch time and the time difference (1t) is the difference
be-tween the mean launch time and the satellite overpass time. In order to calculate the displacement of the air parcel dur-ing this time difference, the average wind vector is computed between 700–300 hPa, the sensitive altitude for the AMSU-B channels used in this study, and then multiplied with 1t. If the displacement is larger than 50 km the data are discarded.
An error model was developed as follows:
σ (i) = q
C02+σ50 km2 (i) (1)
where σ50 km(i) is the standard deviation of the pixels in-side the target area which characterizes radiometric noise of
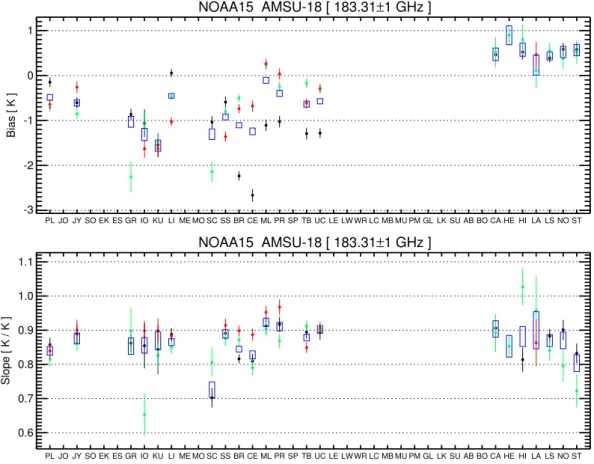
NOAA15 AMSU-18 [ 183.31±1 GHz ] PL JO JY SO EK ES GR IO KU LI ME MO SC SS BR CE ML PR SP TB UC LE LW WR LC MB MU PM GL LK SU AB BO CA HE HI LA LS NO ST -3 -2 -1 0 1 Bias [ K ] NOAA15 AMSU-18 [ 183.31±1 GHz ] PL JO JY SO EK ES GR IO KU LI ME MO SC SS BR CE ML PR SP TB UC LE LW WR LC MB MU PM GL LK SU AB BO CA HE HI LA LS NO ST 0.6 0.7 0.8 0.9 1.0 1.1 Slope [ K / K ]
Fig. 3. Bias (upper panel), slope (lower panel) and their uncertainties of all the stations for channel 18. The satellite is NOAA-15. The
values are shown for different years: 2001 (black), 2002 (green), and 2003 (red). Blue rectangles represent the quantity plus or minus the uncertainty for the whole time period (2001–2003).
AMSU and sampling error due to atmospheric inhomogene-ity. The value C0is estimated as 0.5 K which approximates the other error sources in the comparison such as random er-ror in the radiosonde measurements.
This error model is considered while defining the statisti-cal quantities to measure the agreement between radiosonde and satellite humidity measurements. In BKJ the Bias, B, which is the mean of difference between measured minus modeled radiances (D) was defined as
B = P σ (i) −2D(i)
P σ (i)−2 , (2)
and the uncertainty in the bias can be estimated from its stan-dard deviation
σB= s
1
P σ (i)−2. (3)
But in the present study B is calculated using a linear fit between the modeled and the measured brightness tempera-tures, taking into account the error model:
TBfit=a ∗ (TBARTS−245) + (B + 245). (4)
The value 245 K was found to be the mean brightness tem-perature for channel 18, when data from all stations were combined. Defining B like this reduces its dependence on different atmospheric states. The uncertainties of a and B are calculated as described in Press et al. (1992). In BKJ it was found that the fitted line has a non-unity slope value a, mostly between 0.8–1.0, depending on the channel, which was at-tributed mainly to more underestimation of humidity by ra-diosondes in drier atmospheres than in wetter atmospheres.
4 Results and discussion
This section describes the differences between different ra-diosonde stations for three years (2001–2003) and differ-ences between satellites for the same time period.
We make use of two quantities to check the quality of data from different stations. They are the bias (B) and the slope (a) as defined in Sect. 3. These two quantities are calcu-lated considering the error model, hence the matches with large sampling errors are less weighted. The study focuses on AMSU-B channel 18 which is sensitive to the upper tro-posphere (approximately from 500 hPa to 200 hPa).
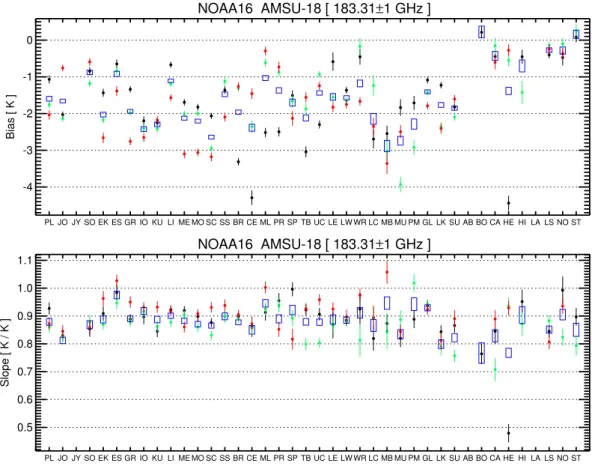
NOAA16 AMSU-18 [ 183.31±1 GHz ] PL JO JY SO EK ES GR IO KU LI ME MO SC SS BR CE ML PR SP TB UC LE LW WR LC MB MU PM GL LK SU AB BO CA HE HI LA LS NO ST -4 -3 -2 -1 0 Bias [ K ] NOAA16 AMSU-18 [ 183.31±1 GHz ] PL JO JY SO EK ES GR IO KU LI ME MO SC SS BR CE ML PR SP TB UC LE LW WR LC MB MU PM GL LK SU AB BO CA HE HI LA LS NO ST 0.5 0.6 0.7 0.8 0.9 1.0 1.1 Slope [ K / K ]
Fig. 4. Same as Fig. 3, but the satellite is NOAA-16.
There exists a relation to translate the quantities a and B which are expressed in radiance units (K) to UTH:
1U T H
U T H =const × 1T , (5)
which yields the relative error in relative humidity for a given absolute error in radiance (Buehler and John, 2005). The constant in the above equation is about −0.07, therefore a 1 K bias in radiance units is equivalent to a 7% relative er-ror in upper tropospheric humidity. The negative value of the constant implies that a positive bias in the radiance is equiv-alent to a dry bias in the humidity and vice versa.
4.1 Different stations
Figure 3 shows results of the comparison for channel 18 on NOAA-15. The NOAA-15 is a morning/evening satellite, therefore it collocates with 06:00 and 18:00 UTC radioson-des launched over Europe. Only about half of the selected radiosonde stations launch sondes at this time, mainly from Germany, Italy, and the UK.
One of the noticeable features is that the biases of the Italian stations (BR–UC) improve considerably for the years 2002 and 2003 compared to 2001. There is an improvement of about 2 K for BR and CE and about 1 K for the other sta-tions. This may be due to an instrument change because a
similar improvement in one of the UK stations was found as discussed later in this section. However, it is not advisable to use radiosonde data for 2001 from these stations for validat-ing or tunvalidat-ing satellite algorithms.
All the available UK stations show a slight positive bias, an opposite behavior to the stations of other countries. A positive bias refers to a wet bias in the humidity measure-ments which is not common for Vaisala RS80/90 radioson-des. Moreover, the bias values are consistent through the years and the stations. But these stations show varying val-ues of slope from 0.7 to 1.1, a low value in slope indicates that the underestimation of humidity by the sondes is more at drier conditions than at wetter conditions. Therefore a low value in slope together with a positive bias, as in case of ST in 2001, there is an overestimation of humidity at wetter con-ditions.
Two German stations GR and SC show a jump in bias be-tween 2001 and 2002, the reason for which is not clear. The bias is −1 K for 2001 and −2 K for 2002. The station LI shows a systematic change in bias through the years, it is almost 0 K in 2001, −0.5 K in 2002, and −1 K in 2003. An-other feature of German stations is that the bias shows maxi-mum value in 2003.
Most of the stations show a consistent slope through the years, though the values are different between the stations.
Exceptions are IO, SC, HI, NO, and ST.
Figure 4 shows the bias and slope of channel 18 on the NOAA-16 satellite. NOAA-16 is a mid-night/noon satellite which collocates with the 0000/1200 UTC radiosonde launch over Europe. Most of the selected stations launch sondes at this time.
The three very noticeable stations in this case are CE of Italy, MU of Spain, and HE of UK, which show a bias of about 4 K. In case of CE and HE this happens only in 2001, during the other years there is reasonable agreement with the other stations. HE shows a very different slope which is far away from unity. Other UK stations do not show any large biases.
Station PL shows a similar result as in the case of NOAA-15, that is, the 2001 bias is less than that of 2002 and 2003 biases, which is almost 0.6 K towards the colder side. But there is a shift in bias values between the satellites by about 1 K. This will be investigated in Sect. 4.2 to see whether this is due to the difference between the AMSU-B instruments on the two satellites.
The two Finnish stations, JO and SO, show consistent val-ues for the bias in 2003. The valval-ues are consistent also over years for SO, but JO shows almost 1 K difference in bias val-ues for 2001 and 2002. On an average, all the Finnish stations show very good performance in case of both the satellites.
Among the German stations, ES, LI, and SS have the least bias, about 1.0 K. ES and SS use autosondes while LI uses correction procedures as described in Leiterer et al. (1997). A general feature for all the German stations is that the bias is the smallest during 2001 and the largest during 2003. An exception to this is KU for which bias values for all the years is about −2.3 K.
The Italian stations show improvement in bias for 2002 and 2003 compared to 2001. The difference in bias is more than 1 K for most of the stations. This feature was observed for NOAA-15 also. One exception is SP whose 2001 bias is less than that of 2002 or 2003.
The polish stations (LE–WR) show good agreement with AMSU data, biases are always less than −2 K. As in the case of the German stations, 2003 biases are the largest. For Span-ish stations (LC-PM), for most cases 2001 has minimum bias and 2002 has maximum bias. The bias values are greater than about 2.0 K, which corresponds to 15% relative error in UTH, for all the stations. Therefore data from Spanish sta-tions may not give good agreement in satellite validasta-tions. The Swedish stations (GL-SU) show comparatively better performance except for LK where 2002 and 2003 biases are about −2.5 K.
In the case of NOAA-16 also the UK stations show a near zero bias except for HE in 2001 and HI in 2002. In case of HE, the shift in bias is due to the instrument change. HE has switched from using Sippican Microsonde II to the Vaisala RS80 (and autosonde) in November 2001 (The details can be seen at: http://www.metoffice.com/research/ interproj/radiosonde/). It should be noted that the error bar
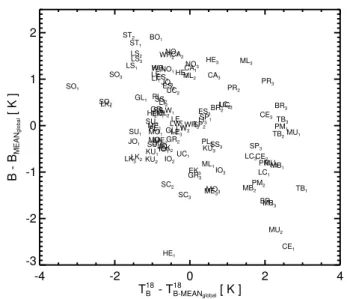
-4 -2 0 2 4 T18 B - T18B-MEANglobal [ K ] -3 -2 -1 0 1 2 B - B MEAN global [ K ] PL1 JO1 SO1 EK1 ES1 GR1 IO1 KU1 LI1 ME1 MO1 SC1 SS1 BR1 CE1 ML1 PR1 SP1 TB1 UC1 LE1 LW1 WR1 LC1 MB1 MU1 PM1 GL1 LK1 SU1 BO1 CA1 HE1 HI1 LS1 NO 1 ST1 PL2 JO2 SO2 EK2 ES2 GR2 IO2 KU2 LI2 ME2 MO2 SC2 SS2 BR2 CE2 ML2 PR2 SP2 TB2 UC2 LE2 LW2 WR2 LC2 MB2 MU2 PM2 GL2 LK2 SU2 CA2 HE2 HI2 LS2 NO2 ST2 PL3 JO3 SO3 EK3 ES3 GR3 IO3 KU3 LI3 MEMO33 SC3 SS3 BR3 CE3 ML3 PR3 SP3 TB3 UC3 LELW33 WR3 LC3 MB3 MU3 GL3 LK3 SU3 CA3 HE3 LS3 NO 3
Fig. 5. Anomaly of bias versus anomaly of channel 18 brightness
temperature for NOAA-16. The anomalies were calculated from the global mean, the mean brightness temperature of channel 18 of all the stations for the whole time period. Station short names are used as plotting symbols. The subscripts 1–3 represents the years 2001–2003.
of HI for 2002 is larger compared to the other UK stations which indicates that the number of matches used for calcu-lating the statistics is less. Therefore a higher bias in this case might be due to insufficient sample size.
The slope in the case of NOAA-16 is around 0.9 K/K for most of the stations, but there is a scatter for some of the stations. For example, the slope of some of the UK stations varies from 0.7 to 0.9 K/K. The case of HE was discussed before and is an exceptional case.
The reason for all these jumps and differences are unclear, nevertheless the features appear to be real. For example, there is no conceivable reason why the satellite instrument should be biased differently over the UK, or why the bias should jump for all stations in Italy. The lack of proper doc-umentation of the instrument change or correction methods at each station makes it difficult to attribute reasons to the observed variability in the performance of the stations.
Figure 5 shows a scatter plot of the anomalies of the bi-ases versus anomalies of channel 18 brightness temperature (T18B) for all the stations and the years for NOAA 16. The anomalies are calculated from the global mean values of the quantities, T18B−MEAN
globaland BIASMEANglobal, mean of all the
stations for the whole time period. The values of these quan-tities are 245.55 K and −0.54 K for NOAA 15 and 245.30 K and −1.64 K for NOAA 16. One does not see any particu-lar relation between the two anomalies. Simiparticu-lar results were found for NOAA 15 (not shown). This implies that the bias values are independent of the atmospheric conditions and are due to the differences in radiosonde measurements.
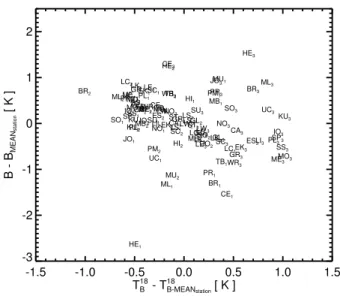
-1.5 -1.0 -0.5 0.0 0.5 1.0 1.5 T18 B - T18B-MEANstation [ K ] -3 -2 -1 0 1 2 B - B MEAN station [ K ] PL1 JO1 SO1 EK1 ES1 GR1 IO1 KU1 LI1 MEMO1 1 SC1 SS1 BR1 CE1 ML1 PR1 SP1 TB1 UC1 LE1 LW1 WR1 LC1 MB1 MU1 PM1 GL1 LK1 SU1 CA1 HE1 HI1 LS1 NO1 ST1 PL2 JO2 SO2 EK2 ES2 GR2 IO2 KU2 LI2 ME2 MO2 SC2 SS2 BR2 CE2 MLPR2 2 SP2 TB2 UC2 LE2 LW2 WR2 LC2 MB2 MU2 PM2 GL2 LK2 SU2 CA2 HE2 HI2 LS2 NO2 ST2 PL3 JO3 SO3 EK3 ES3 GR3 IO3 KU3 LI3 MEMO33 SC3 SS 3 BR3 CE3 ML3 PR3 SP3 TB3 UC3 LE3 LW3 WR3 LC3 MB3 MU3 GL3 LK3 SU3 CA3 HE3 LS3 NO3
Fig. 6. Anomaly of bias versus anomaly of channel 18 brightness
temperature for NOAA-16. The anomalies were calculated from the stations means, the mean brightness temperature of channel 18 of each station station for the whole time period. Station short names are used as plotting symbols. The subscripts 1–3 represents the years 2001–2003.
We went one step further to see whether the bias values are really independent of the atmospheric conditions at different stations by calculating the anomalies from the station means. Figure 6 shows the result of this and confirms that there is no explicit relationship between the two anomalies. This con-firms that the bias values are independent of the atmospheric conditions.
4.2 Different satellites
From Figs. 3 and 4 one can notice a systematic difference in bias values between the two satellites, the magnitude of the bias is larger for NOAA 16 than for NOAA 15.
There can be two possible reasons for this. One is a sys-tematic difference in the radiance measurements by the two satellites, the other is a systematic difference in the humid-ity measurements by radiosondes at different times of the day. To check the first possibility, we selected 10 stations to further study the difference between the satellites. They are PL, KU, LI, SS, BR, CE, ML, PR, TB, and UC. These stations are selected because they launch sondes 4 times a day, therefore have matches with both satellites. These sta-tions have bias values for 2001, 2002, and 2003. The differ-ence in bias, 1B(=BNOAA15−BNOAA16), between the satel-lites per year for each station was calculated. The mean of
1B is 1.15±0.12 K for 2001, 0.93±0.14 K for 2002, and 0.77±0.09 K for 2003. There is a decrease in 1B through the years. The mean of 1B for the whole time period is 0.95±0.12 K. The stability of 1B has been verified by putting the 10 stations into two groups and calculating
sepa-rate mean values, which were found to be consistent with the values given above.
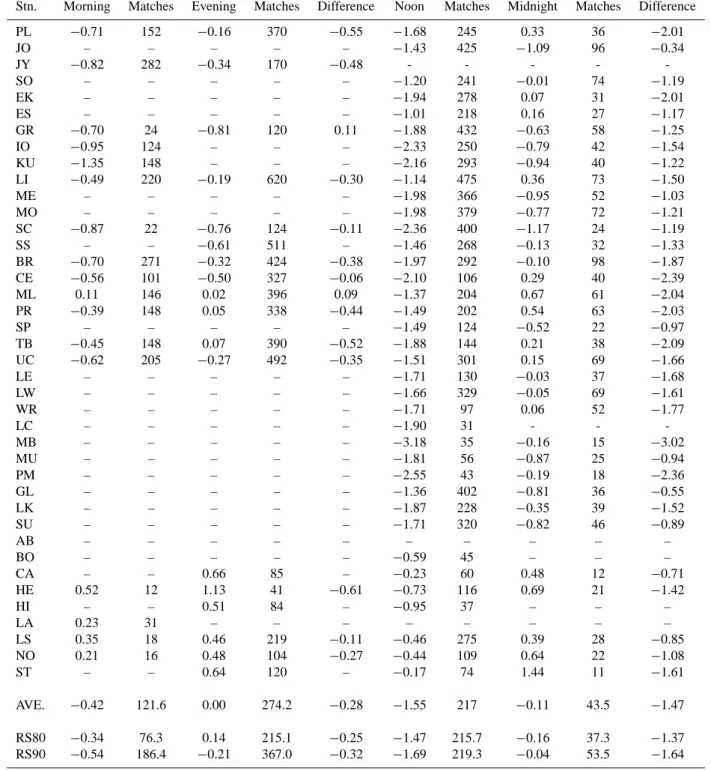
To check the second possibility, we separated the matches by time. Now there are morning matches and evening matches for NOAA-15 and noon matches and mid-night matches for NOAA-16. The statistics of bias for all the sta-tions are shown in Table 2. The difference in bias between morning and evening matches (Bmoring−Bevening) is from −0.61 to 0.11 K with a mean difference of −0.28 K. This in-dicates that morning launches have a drier bias than evening launches, but the differences are not very systematic among the stations as shown in Table 2. The difference in bias be-tween noon and midnight matches (Bnoon−Bmidnight) is from −0.34 to −3.02 K with a mean difference of −1.41 K, that is, there is a systematic large dry bias in the noon launches. We repeated the analysis by further separating RS80 and RS90 instruments and the results were found similar as given in Ta-ble 2. It is known that there is a radiation error in radiosonde data which introduces a large dry bias in daytime soundings compared to nighttime sounding. Our analysis shows that the radiation error alone can contribute about 1.5 K or 11% rela-tive error in UTH measurements according to Eq. (5). Thus, the difference between biases for NOAA-15 and NOAA-16 is mostly coming from time dependent measurement errors in radiosonde data such as radiation error. Even if there are difference in the radiances measured by the instruments on NOAA-15 and NOAA-16, it may not be visible in this kind of comparisons due to the large errors in the radiosonde data.
5 Conclusions
The method of comparing satellite and radiosonde humidities developed by BKJ was applied to all European radiosonde stations for which data were readily available. The method seems to be useful for monitoring upper tropospheric humid-ity data from radiosonde stations using microwave satellite data as reference. The stations used in this study launch Vaisala radiosondes which suffer a known dry bias. The re-sults of this study also confirm this dry bias in the radiosonde data. Only the stations from the UK shows a near zero or slightly positive bias. There is a large variability in the dry bias among stations and years. There are believed to be sev-eral reasons for this such as radiosonde age, difference in cal-ibration and launch procedures (Turner et al., 2003). An ap-parent difference in bias of about 1 K between NOAA-15 and NOAA-16 was observed. A detailed analysis by separating the matches based on the radiosonde launch time revealed a systematic dry bias in the daytime soundings which was the reason for the difference found between the two satellites. Thus, data from different NOAA satellites were found to be consistent within the limited radiosonde accuracy. This dry bias in the daytime soundings is due to radiation errors and its magnitude is approximately 1.5 K. Although, the errors are expressed in radiance units (K), they can be easily converted
Table 2. Detailed statistics for bias by separating morning/evening (NOAA-15) or noon/midnight (NOAA-16) satellite overpasses for the
entire time period (2001–2003).
Stn. Morning Matches Evening Matches Difference Noon Matches Midnight Matches Difference
PL −0.71 152 −0.16 370 −0.55 −1.68 245 0.33 36 −2.01 JO – – – – – −1.43 425 −1.09 96 −0.34 JY −0.82 282 −0.34 170 −0.48 - - - - -SO – – – – – −1.20 241 −0.01 74 −1.19 EK – – – – – −1.94 278 0.07 31 −2.01 ES – – – – – −1.01 218 0.16 27 −1.17 GR −0.70 24 −0.81 120 0.11 −1.88 432 −0.63 58 −1.25 IO −0.95 124 – – – −2.33 250 −0.79 42 −1.54 KU −1.35 148 – – – −2.16 293 −0.94 40 −1.22 LI −0.49 220 −0.19 620 −0.30 −1.14 475 0.36 73 −1.50 ME – – – – – −1.98 366 −0.95 52 −1.03 MO – – – – – −1.98 379 −0.77 72 −1.21 SC −0.87 22 −0.76 124 −0.11 −2.36 400 −1.17 24 −1.19 SS – – −0.61 511 – −1.46 268 −0.13 32 −1.33 BR −0.70 271 −0.32 424 −0.38 −1.97 292 −0.10 98 −1.87 CE −0.56 101 −0.50 327 −0.06 −2.10 106 0.29 40 −2.39 ML 0.11 146 0.02 396 0.09 −1.37 204 0.67 61 −2.04 PR −0.39 148 0.05 338 −0.44 −1.49 202 0.54 63 −2.03 SP – – – – – −1.49 124 −0.52 22 −0.97 TB −0.45 148 0.07 390 −0.52 −1.88 144 0.21 38 −2.09 UC −0.62 205 −0.27 492 −0.35 −1.51 301 0.15 69 −1.66 LE – – – – – −1.71 130 −0.03 37 −1.68 LW – – – – – −1.66 329 −0.05 69 −1.61 WR – – – – – −1.71 97 0.06 52 −1.77 LC – – – – – −1.90 31 - - -MB – – – – – −3.18 35 −0.16 15 −3.02 MU – – – – – −1.81 56 −0.87 25 −0.94 PM – – – – – −2.55 43 −0.19 18 −2.36 GL – – – – – −1.36 402 −0.81 36 −0.55 LK – – – – – −1.87 228 −0.35 39 −1.52 SU – – – – – −1.71 320 −0.82 46 −0.89 AB – – – – – – – – – – BO – – – – – −0.59 45 – – – CA – – 0.66 85 – −0.23 60 0.48 12 −0.71 HE 0.52 12 1.13 41 −0.61 −0.73 116 0.69 21 −1.42 HI – – 0.51 84 – −0.95 37 – – – LA 0.23 31 – – – – – – – – LS 0.35 18 0.46 219 −0.11 −0.46 275 0.39 28 −0.85 NO 0.21 16 0.48 104 −0.27 −0.44 109 0.64 22 −1.08 ST – – 0.64 120 – −0.17 74 1.44 11 −1.61 AVE. −0.42 121.6 0.00 274.2 −0.28 −1.55 217 −0.11 43.5 −1.47 RS80 −0.34 76.3 0.14 215.1 −0.25 −1.47 215.7 −0.16 37.3 −1.37 RS90 −0.54 186.4 −0.21 367.0 −0.32 −1.69 219.3 −0.04 53.5 −1.64
to errors in UTH using Equation (5). According to this, a 1 K error in radiance corresponds to 7% relative error in UTH. Since the relation is linear, an error of 2 K in radiance corre-sponds to 14% relative error in UTH and so on. We plan to extend our analysis covering the global radiosonde network, thus allowing the sampling of different air masses.
Acknowledgements. We would like to thank the reviewers for
their constructive comments, and in particular H. Voemel, CIRES, NOAA for his useful insights on issues related to radiosonde data. We also thank M. Kuvatov for contributions to the development of the methodology, the British Atmospheric Data Centre (BADC) for the global operational radiosonde data, LAUTLOS community for useful discussions, and Sreerekha T. R. for constructive comments on the manuscript. Special thanks to L. Neclos from the Comprehensive Large Array-data Stewardship System (CLASS) of the US National Oceanic and Atmospheric Administration (NOAA) for providing AMSU data. Thanks to the ARTS radiative transfer community, many of whom have indirectly contributed by implementing features to the ARTS model. This study was funded by the German Federal Ministry of Education and Research (BMBF), within the AFO2000 project UTH-MOS, grant 07ATC04. It is a contribution to COST Action 723 ‘Data Exploitation and Modeling for the Upper Troposphere and Lower Stratosphere’. Edited by: D. McKenna
References
Andrae, U., Sokka, N., and Onogi, K.: The radiosonde temperature bias corrections used in ERA-40, Tech. rep., ECMWF, ERA-40 project report series no. 15, 34, 2004.
Atkinson, N. C.: Calibration, monitoring and validation of AMSU-B, Adv. Space. Res., 28, 117–126, Proceedings of the A0.2 symposium of the 33rd COSPAR Scientific Assembly, Warsaw, Poland, July 2000, 2001
Buehler, S. A. and John, V. O.: A Simple Method to Relate Mi-crowave Radiances to Upper Tropospheric Humidity, J. Geo-phys. Res., 110, D02110, doi:10.1029/2004JD005111, 2005. Buehler, S. A., Kuvatov, M., John, V. O., Leiterer, U., and Dier,
H.: Comparison of Microwave Satellite Humidity Data and Ra-diosonde Profiles: A Case Study, J. Geophys. Res., 109, D13103, doi:10.1029/2004JD004605, 2004.
Buehler, S. A., Eriksson, P., Kuhn, T., von Engeln, A., and Verdes, C.: ARTS, the Atmospheric Radiative Transfer Simulator, J. Quant. Spectrosc. Radiat. Transfer, 91, 65–93, 2005.
Buehler, S. A., Kuvatov, M., and John, V. O.: Scan asymmetries in AMSU-B data, Geophys. Res. Lett., (pdf file at: http://www.sat.uni-bremen.de/members/sab/publications/ amsu-scan-bias/amsu-scan-bias.pdf), submitted 2005.
Chaboureau, J.-P., Chedin, A., and Scott, N. A.: Remote sensing of the vertical distribution of atmospheric water vapor from the TOVS observations: Method and validation, J. Geophys. Res., 103, 8743–8752, 1998.
Christy, J. R. and Norris, W. B.: What may we conclude about global tropospheric temperature trends, Geophys. Res. Lett., 31, L06211, doi:10.1029/2004GL019361, 2004.
Elliot, W. P. and Gaffen, D. J.: On the Utility of Radiosonde Hu-midity Archives for Climate Studies, Bull. Amer. Met. Soc., 72, 1507–1520, 1991.
Fetzer, E., McMillin, L. M., Tobin, D., Aumann, H. H., Gunson, M. R., McMillan, W. W., Hagan, D. E., Hofstadter, M. D., Yoe, J., Whiteman, D. N., Barnes, J. E., Bennartz, R., Vomel, H., Walden, V., Newchurch, M., Minnet, P. J., Atlas, R., Schmidlin, F., Olsen, E. T., Goldberg, M. D., Zhou, S., Ding, H., Smith, W. L., and Revercomb, H.: AIRS/AMSU/HSB validation, IEEE T. Geosci. Remote Sensing, 41, 418–431, 2003.
Jimenez, C., Eriksson, P., John, V. O., and Buehler, S. A.: A practical demonstration on AMSU retrieval precision for upper tropospheric humidity by a non-linear multi-channel regression method, Atmos. Chem. Phys., 5, 451–459, 2005,
SRef-ID: 1680-7324/acp/2005-5-451.
John, V. O., Kuvatov, M., and Buehler, S. A.: ARTS – A New Radiative Transfer Model for AMSU, in: Twelfth International TOVS Study Conference (ITSC – XII), Lorne, Australia, 2002. Kistler, R., Kalnay, E., Collins, W., Saha, S., White, G., Woollen,
J., Chelliah, M., Ebisuzaki, W., Kanamitsu, M., Kousky, V., den Dool, H. V., Jenne, R., and Fiorino, M.: The NCEP-NCAR 50 year reanalysis: monthly means CD-ROM and documentation, BAMS, 82, 247–268, 2001.
Lanzante, J. R. and Gahrs, G. E.: The “clear-sky bias” of TOVS upper-tropospheric humidity, J. Clim., 13, 4034–4041, 2000. Leiterer, U., Dier, H., and Naebert, T.: Improvements in Radiosonde
Humidity Profiles Using RS80/RS90 Radiosondes of Vaisala, Beitr. Phys. Atm., 70, 319–336, 1997.
Lorenc, A. C., Barker, D., Bell, R. S., Macpherson, B., and May-cock, A. J.: On the use of radiosonde humidity observations in midlatitude NWP, Meteorology and Atmospheric Physics, 60, 3–17, 1996.
Melsheimer, C., Verdes, C., Buehler, S. A., Emde, C., Eriks-son, P., Feist, D. G., Ichizawa, S., John, V. O., Kasai, Y., Kopp, G., Koulev, N., Kuhn, T., Lemke, O., Ochiai, S., Schreier, F., Sreerekha, T. R., Suzuki, M., Takahashi, C., Tsu-jimaru, S., and Urban, J.: Intercomparison of General Pur-pose Clear Sky Atmospheric Radiative Transfer Models for the Millimeter/Submillimeter Spectral Range, Radio Sci., RS1007, doi:10.1029/2004RS003110, 2005.
Miloshevich, L. M., Voemel, H., Paukkunen, A., Heymsfield, A. J., and Oltmans, S. J.: Characterization and correction of relative humidty measurements from Vaisala RS80-A radiosondes at cold temperatures, J. Atmos. Oceanic Technol., 18, 135–156, 2001. Miloshevich, L. M., Paukkunen, A., Voemel, H., and Oltmans, S. J.:
Development and validation of a time-lag correction for Vaisala radiosonde humidity measurements, J. Atmos. Oceanic Technol., 21, 1305–1327, 2004.
Nakamura, H., Seko, H., and Shoji, Y.: Dry biases of humidity measurements from the Vaisala RS80-A and Meisi RS2-91 ra-diosondes and from ground based GPS, J. Meteor. Soc. Japan, 82, 277–299, 2004.
Onogi, K.: The long term performance of the radiosonde observ-ing system to be used in ERA-40, Tech. rep., ECMWF, ERA-40 project report series no. 2, 2000.
Peixoto, J. P. and Oort, A. H.: The climatology of relative humidity in the atmosphere, J. Clim., 9, 3443–3463, 1996.
Press, W. H., Teukolsky, S. A., Vetterling, W. T., and Flannery, B. P.: Numerical Recipes in C, Cambridge University Press, 2
edn., 1992.
Roy, B., Halverson, J. B., and Wang, J.: The influence of radiosonde “age” on TRMM field campaign soundings humidity correction, J. Atmos. Oceanic Technol., 21, 470–480, 2004.
Saunders, R. W., Hewison, T. J., Stringer, S. J., and Atkinson, N. C.: The Radiometric Characterization of AMSU-B, IEEE T. Microw. Theory, 43, 760–771, 1995.
Seidel, D. J., Angell, J. K., Christy, J., Free, M., Klein, S. A., Lanzante, J. R., Mears, C., Parker, D., Shabel, M., Spencer, R., Sterin, A., Thorne, P., and Wentz, F.: Uncertainty in signals of large-scale climate variations in radiosonde and satellite upper-air temperature datasets, J. Clim., 17, 2225–2240, 2004. Soden, B. J. and Lanzante, J. R.: An Assessment of Satellite and
Radiosonde Climatologies of Upper-Tropospheric Water Vapor, J. Climate., 9, 1235–1250, 1996.
Soden, B. J., Turner, D. D., Lesht, B. M., and Miloshevich, L. M.: An analysis of satellite, radiosonde, and lidar observations of up-per tropospheric water vapor from the Atmospheric Radiation Measurement Program, J. Geophys. Res., 109, 1235–1250, 2004. Sohn, B. J., Chung, E.-S., Schmetz, J., and Smith, E. A.: Estimating upper-tropospheric water vapor from SSM/T-2 satellite measure-ments, J. Appl. Meteorol., 42, 488–504, 2001.
Sonntag, D.: Advancements in the field of hygrometry, Meteorol. Z., 3, 51–66, 1994.
SPARC: Assesment of Upper Tropospheric and Stratospheric Wa-ter Vapour, chap. Conclusions, World Climate Research Pro-gramme, WCRP-113,WMO/TD-No. 1043, 261–264, 2000. Spencer, R. W. and Braswell, W. D.: How Dry is the Tropical Free
Troposphere?, Implications for Global Warming Theory, Bull. Amer. Met. Soc., 78, 1097–1106, 1997.
Spichtinger, P., Gierens, K., Leiterer, U., and Dier, H.: Ice supersat-urated regions over the station Lindenberg, Germany, Meteorol. Z., 12, 143–156, 2003.
Turner, D. D., Lesht, B. M., Clough, S. A., Liljegren, J. C., Rever-comb, H. E., and Tobin, D. C.: Dry bias and variability in Vaisala RS80-H radiosondes: The ARM Experience, J. Atmos. Ocean Technol., 20, 117–132, 2003.
Wang, J., Cole, H. L., Carlson, D. J., Miller, E. R., Beierle, K., Paukkunen, A., and Laine, T. K.: Corrections of humidity mea-surement errors from the Vaisala RS80 radiosonde application to TOGA COARE data, J. Atmos. Ocean Technol., 19, 981–1002, 2002.