HAL Id: halshs-01707760
https://halshs.archives-ouvertes.fr/halshs-01707760
Preprint submitted on 13 Feb 2018
HAL is a multi-disciplinary open access
archive for the deposit and dissemination of
sci-entific research documents, whether they are
pub-lished or not. The documents may come from
teaching and research institutions in France or
L’archive ouverte pluridisciplinaire HAL, est
destinée au dépôt et à la diffusion de documents
scientifiques de niveau recherche, publiés ou non,
émanant des établissements d’enseignement et de
recherche français ou étrangers, des laboratoires
Immigration and the Future of the Welfare State in
Europe
Alberto Alesina, Johann Harnoss, Hillel Rapoport
To cite this version:
Alberto Alesina, Johann Harnoss, Hillel Rapoport. Immigration and the Future of the Welfare State
in Europe. 2018. �halshs-01707760�
WORKING PAPER N° 2018 – 04
Immigration and the Future of the Welfare State in Europe
Alberto Alesina
Johann Harnoss
Hillel Rapoport
JEL Codes:
Keywords:
P
ARIS
-
JOURDAN
S
CIENCES
E
CONOMIQUES
48, BD JOURDAN – E.N.S. – 75014 PARIS
TÉL. : 33(0) 1 80 52 16 00=
www.pse.ens.fr
Immigration and the Future of the Welfare
State in Europe
Alberto Alesina
y, Johann Harnoss
z, and Hillel Rapoport
xDecember 2014 (Updated: February 2018)
Abstract
We analyze the e¤ect of immigration on attitudes to redistribution in Europe. Using data for 28 European countries from the European Social Survey, we …nd that native workers lower their support for redistribution if the share of immigration in their country is high. This e¤ect is larger for individuals who hold negative views regarding immigration but is smaller when immigrants are culturally closer to natives and come from richer ori-gin countries. The e¤ect also varies with native workers’and immigrants’ education. In particular, more educated natives (in terms of formal educa-tion but also job-speci…c human capital and ocupaeduca-tion task skill intensity) support more redistribution if immigrants are also relatively educated. To address endogeneity concerns, we restrict identi…cation to within country and within country-occupation variation and also instrument immigration using a gravity model.
Overall, our results show that the negative …rst-order e¤ect of immigra-tion on attitudes to redistribuimmigra-tion is relatively small and counterbalanced among skilled natives by positive second-order e¤ects for the quality and diversity of immigration.
We thank Francesc Ortega and Ekaterina Zhuravskaya as well as seminar participants at the Paris School of Economics for helpful suggestions. Hillel Rapoport acknowledges support from CEPREMAP. This paper is based on Johann Harnoss’(2014) dissertation thesis "Essays on the economics of immigration and birthplace diversity", chapter 4.
yHarvard University and IGIER Bocconi zUniversité Paris 1 Panthéon-Sorbonne
1
Introduction
Research on population diversity in the United States suggests that ethnic and racial diversity undermine social trust and solidarity (Putnam, 1995), which in turn negatively in‡uence attitudes towards redistribution (Luttmer, 2001, Alesina and Glaeser, 2004). As a result, one can observe a clear negative em-pirical relationship in the US between ethnic diversity and redistribution, e.g. for measures such as municipal level public goods provision (Alesina, Baqir and Easterly, 1999) or welfare payments across US states (Alesina and Glaeser, 2004). Is what holds true for the United States also true for Europe?
In his in‡uential book "Exodus", Paul Collier (2013) uses the …ndings from the US context to assert a similar relationship in Europe. This paper suggests that such a transposition masks important heterogeneities and is thus not nec-essarily valid.
For one thing, Europe and the United States di¤er in many respects and often stand as antipodes to one another on issues such as immigration and redistribution. The U.S. is often portrayed as a "land of opportunity" while Europe, we are told, is a "land of redistribution" (Boeri, 2010). And indeed, the US is still relatively welcoming to immigrants and averse to high levels of re-distribution while Europe, in contrast, is still relatively closed to non-European immigration but relatively generous in terms of social support for anyone who has made it through its borders. The numbers re‡ect these di¤erences: Europe is less diverse in terms of ethnicity1 than the United States and has a much larger welfare state.2 In terms of immigration, however, the two are converging as Europe is slowly but surely becoming a much more diverse place. Over the last decade, Europe has more than doubled –from 30 to 60 million –the number of its immigrants; as a result, most European countries exhibit rising levels of birthplace diversity,3 leading some to predict the end of the European welfare state.
This paper takes this assertion seriously and submits it to an empirical test. We show that the negative e¤ects of ethnic/racial diversity on trust and redistri-bution in the context of the US cannot be simply transposed to the EU context. Instead, our results suggest that immigration (its size and skill composition) and the diversity arising from it do not necessarily translate into lower attitu-dinal support for redistribution. The paper belongs to the broader literature that seeks to explain social preferences based on individual level determinants.4 Median-voter models suggest that an individual’s income relative to average income is a key determinant of such preferences (Meltzer and Richard, 1981).5 1The european average for ethnic fractionalization is 0.27 versus 0.49 in the United States (on a scale from 0 to 1, based on Alesina et al., 2003).
2Public social expenditure in Europe is around 25% of GDP vs. 19% in the United States (based on 2009 data compiled at the OECD by Adema, Fron and Ladaique, 2011).
3All European OECD countries (except for four: Estonia, Greece, New Zealand, Poland and Slovakia) saw increases in the diversity of their skilled workforce between 1990 and 2000. On average, birthplace diversity increased by 17%.
4See Alesina and Giuliano (2010) for a recent survey.
redis-Age, education, occupation and past experience of unemployment are just a se-lection of many other factors that matter, beyond further determinants as varied as income mobility (Piketty, 1995, Benabou and Ok, 2001, Alesina and La Fer-rara, 2005), risk aversion (Sinn, 1995) and beliefs about fairness (Alesina and La Ferrara, 2005). Racial di¤erences also matter. This applies particularly to the United States, where white individuals tend to be less generous if blacks are over-represented among welfare recipients (Luttmer, 2001, Alesina and Glaeser, 2004).
Immigration a¤ects preferences for redistribution through some of these fac-tors. The most obvious channel, group loyalties, relates to group formation: The willingness to redistribute increases in the share of an individuals’ own ethnic group in a community and decreases when other groups grow in size (this holds in particular for groups of welfare recipients).6 The degree to which such group loyalty e¤ects are relevant in Europe is largely unclear, since group loyalty ef-fects materialize most strongly along racial/ethnic divisions. Such racial/ethnic di¤erences, however, are not very large in European countries. A second possi-ble channel relates to the labor market. When immigrants enter the labor force and compete with native workers, their additional labor supply may increase native workers’perceived risk of downward income mobility. To insure against this risk, native workers likely demand more redistribution.7 A third possible channel relates to preference e¤ects. Native citizens may derive utility from the mere presence of immigrants, or from a more diverse set of immigrants. This preference e¤ ect may be stronger for more educated native citizens due to "educated preferences" of such individuals (Hainmueller and Hiscox, 2007).
We brie‡y review the literature on attitudes to redistribution, with an em-phasis on the recent empirical evidence for European countries. Nearly all of these focus on the size of immigration, but do not take into account immigrant diversity and the relative skill level of natives to immigrants.8 In addition, only a handful of existing studies fully address endogeneity, although immigration ‡ows are well known to be a¤ected by the extent of the welfare state in receiv-ing countries (Borjas, 1999, Grogger and Hanson, 2011). Besides this issue of reverse causality, idiosyncratic di¤erences between countries (e.g. in terms of average incomes, extent of redistribution) further complicate a purely descrip-tive analysis. Endogeneity is also prevalent within countries, as immigrants’ select into di¤erent occupations and people’s average preferences vary by the type of occupation they pursue (Guillaud, 2011). For example, immigrants sort into manually-intensive occupations where they may have comparative advan-tribution in a society increases in the di¤erence between the median voter’s income and the mean.
6See Luttmer (2001) for early evidence on group loyalties in U.S. communities and Muñoz and Pardos (2014) for experimental results.
7Interestingly, this channel has been studied intensively in the research on attitudes to immigration (Scheve and Slaughter, 2001, Mayda, 2006, O’Rourke and Sinnott 2006, Ortega and Polavieja, 2012, among many others), but not with respect to attitudes to redistribution. 8Birthplace diversity (Harnoss, 2013) and the skill ratio (Mayda, 2006), however, are key determinants of public preferences towards immigration - and thus potentially also for atti-tudes to redistribution.
tages (visavis natives), but the average native worker in these occupations -irrespective of immigration - tends to favor more redistribution (since he is a net recipient of transfers).
Our empirical strategy takes these multiple issues of endogeneity into ac-count. The standard approach would be to identify within countries or occupa-tions and exploit solely time variation in immigration. This strategy, however, is currently constrained by the lack of high frequency occupation-level immigra-tion data (the OECD database only includes years 2000 and 2005) and the lack of country level variation in attitudes over time. We thus follow a di¤erent ap-proach. Our chosen identi…cation strategy relies on variation within countries and also within occupations in a cross section of 28 countries. More speci…-cally, we solely identify marginal e¤ects of individual-level characteristics inter-acted with country/occupation-level migration variables. All other confounding country-level or occupation level variables are absorbed by …xed e¤ects.9 This set-up allows us to avoid most endogeneity concerns. To address issues of mi-grant self-selection to di¤erent destinations, we also specify a gravity model of immigration to predict immigration solely on the basis of exogenous bilateral geographical variables.
We …nd robust evidence consistent with group loyalty and labor market e¤ects of immigration. Native citizens’ demand for income redistribution de-creases by about 2 percent when the share of foreigners inde-creases by a stan-dard deviation (about 10 percent points in our sample).10 This e¤ect holds on the country level, within country-occupation cells and also in an instrumental variables 2SLS model. Tellingly, group loyalty e¤ects are stronger for natives who think that immigrants negatively a¤ect the quality of life in natives’home countries. We also show that immigrants’socioeconomic characteristics matter, since group loyalty e¤ects are considerably weaker when immigrants hail from culturally closer or richer origin countries.11
In addition, we …nd evidence consistent with labor market e¤ects. We …nd that the more highly educated a native, the higher her support for redistribution – if immigrants are also mostly highly educated. An increase of the skill ratio of immigrants to natives by one standard deviation increases skilled natives’ demand for redistribution by about 1 percent. These results hold also within country-occupation cells and are driven by occupations with higher exposure to immigrants. Two reasons make it unlikely this is not merely a re‡ection of well-known preference e¤ects: …rst, attitudes to immigrants do not a¤ect this channel (the e¤ect holds in subsamples of natives with negative and positive views on immigrants). Second, using alternative indicators of labor market skill (a measure of job-speci…c human capital and two measures of task skill intensity following Peri and Sparber, 2009) yields very similar results.12
9This empirical strategy has been employed by, among others, Mayda (2006).
1 0In other words, a one-percentage point increase in the share of foreigners lowers natives’ support for redistribution by about 0.2 percent.
1 1We do, however, …nd no robust evidence that immigration from certain countries (e.g. from Arab, Muslim or South-Saharan origins) a¤ects peoples’ attitudes.
Our paper makes three main contributions. First and foremost, we take a number of steps to address endogeneity. We focus our analysis on variation within countries and even within a country’s ISCO 1-digit level occupations to exclude potential confounding e¤ects of other variables. We also specify a gravity model of bilateral migration to address reverse causality. Second, we measure immigration as an actual outcome variable; the vast majority of previ-ous papers uses variables of perceived (rather than actual) immigration. Third, we focus not only on the share of immigration, but analyze all key dimensions in an integrated framework: size, (birthplace) diversity and the skill ratio relative to natives - only the …rst of these has been analyzed in prior literature.
The rest of the paper is organized as follows: Section 2 brie‡y discusses the individual- and country level determinants of attitudes to redistribution and shows some descriptive correlations. Section 3 presents our data, descriptive statistics and empirical strategy; Section 4 shows results. Section 5 concludes.
2
The demand for redistribution
2.1
Economic and cultural determinants
The demand for redistribution largely depends two factors: First, if the individ-ual thinks she bene…ts from an income transfer scheme and second, if she regards the other bene…ciaries of the scheme to be worthy recipients of support.13
The …rst factor can be modeled following Meltzer and Richard (1981). Their seminal model predicts that a voter demands income redistribution if her in-come lies below the average.14 Benabou and Ok (2001) develop a more advanced model incorporating people’s “prospect of upward mobility”. Their theory ex-plains why voters with sub-average income in fact often do not want more re-distribution, since they rationally expect to lie above the average in future. This social mobility hypothesis performs much better empirically, as tested e.g. using German and U.S. data by Corneo (2001) or for the OECD by Corneo and Grüner (2002). Alternative models assume that people infer on the future through their experience of past income mobility (Piketty, 1995). Since subjec-tive assessments of social mobility can be biased, Alesina and La Ferrara (2005) further develop objective measures of income mobility. They …nd that an in-dividual’s predicted probability to reach at least the 7th percentile in the U.S. income distribution clearly lowers her demand for redistribution. The degree of risk aversion also clearly a¤ects people’s demand for redistribution, which in fact acts as insurance against negative future income shocks (Sinn, 1995).
Besides these economic arguments, cultural factors matter. Older people and women are known to demand more redistribution, more educated people redistribution if immigration is diverse. This e¤ect varies considerably with preferences for immigration and disappears in natives with negative views on immigrants.
1 3For a survey of the literature, see Alesina and Giuliano (2010) and Stichnoth and Van der Straeten (2013).
do so much less, even conditional on income.15 Compared with atheists, reli-gious people in the U.S. support redistribution (largely irrespective of relireli-gious a¢ liation, Alesina and Giuliano, 2010), but these results do not hold in exper-imental contexts (Fong, 2001). Besides religion, general beliefs about the poor elicit strong responses in terms of support for redistribution. Americans who believe that economic success in life depends more on own hard work rather than luck or fate are less willing to support the poor (Alesina and La Ferrara, 2005). These beliefs can be the result of indoctrination. Alesina and Fuchs-Schündeln (2007) use the natural experiment of German uni…cation and show that former East-Germans, especially older age cohorts, have a relatively higher preference for state interventions and income redistribution. Such beliefs are also remarkably stable. Using data from the European Social Survey, Luttmer and Singhal (2011) show that …rst and even second-generation immigrants from countries with more positive general attitudes to redistribution largely maintain their preferences in their new social environments.
2.2
Race, ethnicity, birthplace and redistribution
Cultural beliefs correlate with race, especially in the United States. In many studies, representatives of the (white) American majority are found to be much less supportive of redistribution than members of minority groups (Alesina and La Ferrara, 2005). This is typically interpreted not only as heterogeneity in cultural preferences, but as sign of racial prejudices. Using individual data for the U.S., Luttmer (2001) shows evidence for “group loyalty e¤ects”, namely that support for redistribution increases if members of the respondent’s own ethnic group are over-represented among welfare recipients. Using experimental data, Luttmer and Fong (2009) study actual self- reported attitudes as well as charitable giving in a dictator game (where respondents choose which fraction of income to allocate to a charity dedicated to Hurricane Katrina victims). The authors …nd no direct e¤ect of race (of respondent or victim presented in the experiments) in the experimental setting, but do so for people who identify strongly as whites or blacks. Whites who identify strongly as such give less to victims portrayed as black, blacks who identify strongly with their own group give more. According to this research, social identity a¤ects attitudes, but race in itself (without being a marker of identity) does not. This illustrates that redistribution does not travel racial boundaries easily. The mechanism can go through di¤erent speci…c channels. Besides social identity, a lower degree of altruism or a lower demand for insurance (when the poor are disproportionately minorities) can play a role.
Empirical evidence for the U.S. shows that lower attitudes to redistribution due to racial heterogeneity even extend to lower actual levels of redistribution. Alesina, Baqir and Easterly (1999) show that U.S. cities and metropolitan ar-eas with higher racial heterogeneity provide fewer productive public goods (e.g. 1 5This result for education is still – to some extent – an empirical puzzle (Alesina and Giuliano, 2010).
public schools). Alesina, Baqir and Hoxby (2004) demonstrate that U.S. juris-dictions form endogenously in response to a trade-o¤ between scale bene…ts and costs of racial heterogeneity. Using data on welfare spending for families with dependent children, Alesina and Glaeser (2004) show that the share of African-Americans in the population correlates highly negatively with maximum welfare allowances across U.S. states. These empirical studies for the U.S. have in com-mon that they …nd racial, not ethnic, linguistic or birthplace di¤erences, to be the politically salient margin with respect to attitudes and welfare spending.
Empirical evidence for other countries, like Canada or Europe, is compar-atively sparse. For Canada, Soroka et al. 2006 analyze Canadian community surveys and …nd that a comprehensive measure of diversity (racial, ethnic and birthplace di¤erences) correlates negatively with trust, but …nd only very weak evidence for attitudes to redistribution.
For Europe, Senik, Stichnoth and van der Straeten (2009) use European Social Survey data for 22 countries and …nd only a weakly negative link be-tween people’s perception of immigrants’ presence and attitudes. This link grows stronger for people who express a dislike of immigrants and are con-cerned about the economic e¤ects of immigration. Finseraas (2009) …nds that people who perceive the presence of immigrants to be welfare state burden are also less open to redistribution in general. Lately, Magni-Berton (2013) …nds that immigration a¤ects attitudes not via xenophobia or group loyalties, but via labor market concerns.16 Burgoon, Koster and Egmond (2012) show that the e¤ect of immigration on attitudes can even be positive at the occupational level. Also using European Social Survey data, Burgoon (2014) …nds that the national level link between immigration and attitudes is mediated by the degree of economic integration (e.g. dependency on unemployment bene…ts).17
For Germany, Stichnoth (2012) tests a similar hypothesis using socioeco-nomic panel data for 1997 and 2002. He …nds only weak evidence for a link between regional di¤erences in terms of immigrants’ employment status and attitudes to redistribution in Germany. For Sweden, Dahlberg, Edmark and Lundquist (2012) use exogenous variation in refugee placement in the late 1980s and early 1990s and …nd a strongly negative causal relationship between the share of (non-OECD) foreigners in Swedish municipalities and attitudes to re-distribution.
Overall, we conclude that race and attitudes to redistribution seem intri-cately linked in the U.S., but not so much in Europe. While the evidence for Europe is generally sparse, the salient margin of diversity to a¤ect such attitudes is more likely to be that between natives and immigrants. Preceding studies vary in terms of their approach regarding endogeneity (in terms of reverse causality and country level heterogeneity) and in terms of their coverage regarding the salient margins of diversity (studies mostly focus on the share of immigration only). Our empirical strategy aims to take both issues into account.
1 6All these studies use survey-based attitudes perceptions towards immigrants to infer on the e¤ect of immigration on redistribution, not actual levels of immigration.
1 7To isolate country level variables, these studies assume those latent variables to be or-thogonal to other covariates and rely on random intercept models.
3
Empirical strategy and data
3.1
Data
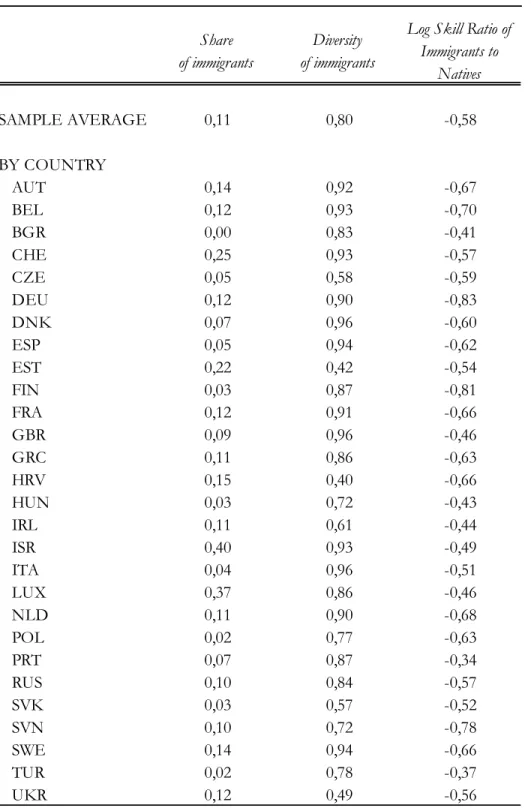
We are interested in the e¤ect of immigration on natives’ demand for redis-tribution. The demand for redistribution is usually derived from answers to individual level surveys questions. The European Social Survey is the largest such survey and contains information on a wide range of socioeconomic and po-litical values for individuals in 28 European countries (including Israel, Turkey and other former Soviet Republics). Data is available for six biannual survey waves starting in 2001 and has been widely used in the study of preferences (see e.g. Card, Dustmann, Preston, 2005 or Ortega and Polavieja, 2012). Our assessment of preferences to redistribution relies on answers to the statement “The government should take measures to reduce di¤ erences in income levels”. Table 1 shows answers options by country and year for our sample. The distribution of answers is clearly skewed to the right, with a mean well above the median. In all countries, a majority of individuals “agrees”or “strongly agrees” with the statement. Countries with lowest overall preference for reduction in income di¤erences (share of population that at least “agrees”) are – among others –Denmark (0.40), the Netherlands (0.56) and Great Britain (0.60). Most in favor of lower income inequality are –among others –Portugal (0.91), Spain (0.82), Italy (0.81), France (0.81) as well as Turkey (0.91) and Greece (0.90).18 This pattern serves as reminder that attitudes to redistribution are a good proxy for a country’s position on many policy related questions. Descriptive statistics for all other individual socioeconomic variables we extract from ESS can be found in the appendix.
For immigration, we draw on the Database on Immigrants in OECD coun-tries (Dumont et al., 2010) that provides immigration stocks (above age 15) for all OECD countries in 2000, disaggregated by gender, education, labor force status and occupation. We use this rich dataset to construct shares of immigra-tion, birthplace diversity and the relative skill ratio of natives to immigrants. Refer to the appendix for details on the construction of these variables.
Table 1 also displays some features of immigration in European countries. The (unweighted) average European country had a population of 11 percent foreign-born residents. Above-average countries are – among others – Israel, Luxembourg and Switzerland, but also Estonia and Germany. Countries with fewer immigrants are many Southern and Eastern European ones. Variance in the diversity of immigrants seems mostly driven by neighboring country ef-fects or speci…c immigration histories, such as the presence of Polish and Turkish immigrants in Germany or Russian-born citizens in Eastern Europe.19 All Euro-pean countries attract immigrants that are, on average, less skilled than natives (with a skill ratio of immigrants to natives’level of education below one). We 1 8Interestingly, the Scandinavian countries mostly lie below the European average, suggest-ing that respondents take the prevailsuggest-ing level of redistribution into account.
1 9We take the potential endogeneity of country borders into account in our robustness checks.
merge the ESS data for six waves (2001/2-2011/12) with OECD immigration data for 2000. In line with the literature on attitudes to immigration, we re-strict our analysis to individuals within the labor force aged 18-64 (Ortega and Polavieja, 2012). We obtain a repeated cross section that contains data for 28 countries and 96.958 individuals.
3.2
Descriptive analysis
In a next step, we look at simple correlations for an indication of patterns in the data - irrespective of potential endogeneity.
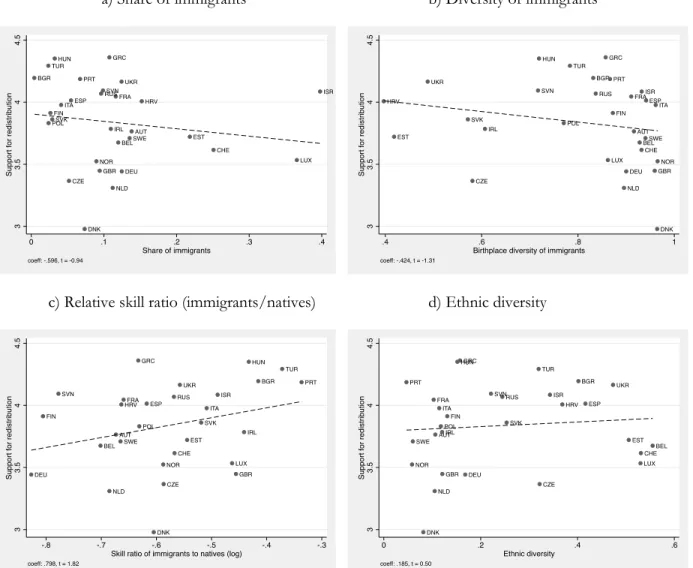
Figure 1 shows bilateral correlations for immigration as well as ethnic diver-sity and preferences to redistribution. In 1a) we see a somewhat negative but not very robust correlation between the share of immigrants and preferences. In 1b), we …nd a similar relationship with birthplace diversity, which seems more robust but potentially driven by few Eastern European countries. In 1c) we see a clearly positive and quite robust link between immigrants’ skill level relative to natives and preferences. The more skilled the average immigrant, the more open the society towards redistribution.20 In 1d), we see ethnic diver-sity (capturing not only recent immigration but deeper ethnic cleavages), which does not correlate much with attitudes at all (unlike within the United States). Needless to say, we have to remain cognizant of endogeneity since these bilateral relationships are likely to be jointly determined by others factors.
3.3
Empirical strategy
The literature review and the descriptive analysis suggest that the e¤ect of migration on public attitudes may go in either direction and even may be en-dogenous to preferences. Our empirical strategy addresses these issues.
In a …rst step, we start with a standard model of redistribution policy pref-erences that takes into account a wide range of individual level factors. We assume that preferences for redistribution Yikt of individual i living in country k in year t can be characterized by the following model:
Yikt = Xikt+ M igk Iikt+ Kk+ "ikt (1) where Xikt is a vector of individual characteristics such as age, gender, educational attainment, household income, political orientation etc.21 M ig
k is a vector of migration variables (share of immigration, birthplace diversity and relative skill ratio) that is estimated for interaction terms with individual level factors Iikt. Iikt is a vector of selected individual characteristics such as EDU CAT ION (formal educational attainment in 5 categories going from pri-mary to completed tertiary education), SKILL (using ISCO four-digit level variables for the skill intensity of occupations) and N AT IV E (a dummy for in-dividuals born in the country of residence). Kk is a vector of country-year …xed 2 0Note that reverse causality seems unlikely here as more redistributive countries should attract more unskilled immigrants.
e¤ects to capture unobserved heterogeneity between country-year pairs, "ikt is an error term.22 , , are parameters to be estimated in our empirical model. We do not estimate the base terms for M igk directly since we are interested in
and estimated from within-country variation, following Mayda (2006). We also do not observe Yiktbut a variable that takes values 1 to 5 increasing in support for redistribution. This variable is ordinal such that Yikt = 1 if Yikt 1 , Yikt = 2 if 1 < Yikt 2, Yikt = 3 if 2 < Yikt 3, Yikt = 4 if 3< Yikt 4and Yikt= 5 if 4> Yikt where 1- 4 are unknown parameters estimated with ; ; : For a more intuitive interpretation of the marginal e¤ects to be estimated, we dichotomize this ordinal variable and create a dummy Yikt that takes on values of 0 if Yikt 3 and 1 if Yikt > 3.23 This implies that we model the probability that an individual i "agrees" or "agrees strongly" with the statement "The government should take measures to reduce di¤ erences in income levels" such that
P (Yikt= 1 j Xikt; M igk; Kk) = ( Xikt+ M igk Iikt+ K) (2) where ( ) is the cumulative distribution function of the standard normal distribution. We assume that the error terms "ikt follow a standard normal distribution, but allow for intra-group correlation within countries via clustering of standard errors on that level. We then proceed to estimating the key model coe¢ cients and :
In a second step, we modify the baseline model to exploit occupation-level variation in immigration. The extended model describes preferences for redis-tribution Yikot of individual i working in occupation o living in country k at time t as follows:
Yikot= Xikot+ M igko Iikot+ Kkt+ Lko+ "ikot (3) Xikot is still the same vector of individual level characteristics. M igok is a vector of our three dimensions of immigration (size, diversity, skill) now de…ned for each country k’s ISCO-88 occupation (o) at the ISCO one-digit level. To the previous Kkt …xed e¤ects we now also add Lko country/ISCO one-digit occupation …xed e¤ects. We thus now identify M igko solely on the basis of variation within a country’s occupational cells. This model setup allows us to account for some endogeneity from omitted variables at the country and also at the ISCO one-digit occupational level.
4
Results
Our objective is to test for the presence of group loyalty, labor market and preference e¤ects of immigration with respect to attitudes to redistribution.
2 2This term thus absorbs time persistent country level characteristics such as di¤erences in labor market institutions (minium wage, trade union density), ethnic diversity, the unemploy-ment rate or income.
2 3In a robustness check, we also estimate this model using ordered probit estimation (avail-able upon request).
4.1
Results for native citizens vs. non-native citizens
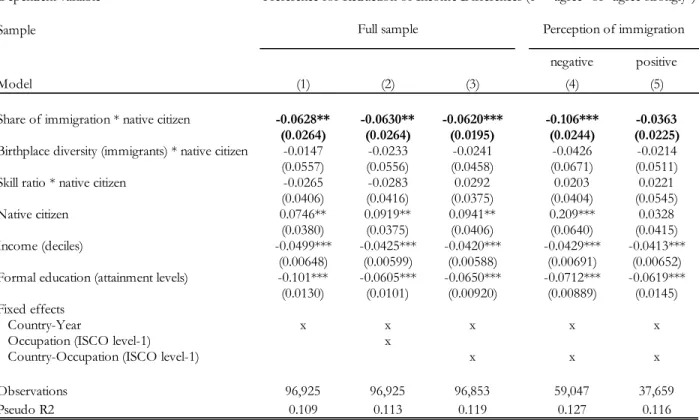
We …rst test for the presence of group loyalty e¤ects. We interact the three dimensions of immigration (size, diversity and skill ratio) with a dummy for native citizens and expect the interaction of M ig with native to capture the marginal e¤ect of being a native citizen in a country/occupation with high im-migration. Table 2 shows results for our full sample of workers aged 18-64 who are part of the labor force. Overall, the model seems appropriately speci…ed. The individual control variables such as gender (1=male), income, education show the expected negative signs, controls like age, age-squared, past/current experience of unemployment are estimated to a¤ect attitudes to redistribution positively.24 Interestingly, the dummy for native citizens (1 if respondent native citizen) is positive, suggesting that nativeborn workers prefer on average -more redistribution than immigrants. This stands in some contrast to empirical results from the U.S. where the white majority has lower preferences for re-distribution than other minorities (notably blacks).25 This di¤erence, however, is clearly not surprising. Native workers tend to have better access to public redistribution schemes than immigrants (depending on citizenship status).
We now turn to an interpretation of the key coe¢ cients in our model, the interactions of native and M ig variables. The interaction with the share of immigration is estimated negatively at 5% statistical signi…cance (model 1). A one-standard deviation increase in the share of foreigners is associated with a decrease in natives’ average attitudes to redistribution by close to 2 percent (based on marginal e¤ects at the mean in the sample).26 The estimates for the interactions with Divmig and the SkillRatio are statistically insigni…cant from zero. This suggests that the diversity of immigrants and the skill ratio of immigrants to natives do not a¤ect natives’attitudes on average. In models (2) and (3), we repeat our analysis using the same model but focusing in on a much more constrained source of variation. Model (2) adds ISCO one-digit occupation …xed e¤ects for 10 broad categories of occupations. This model thus allows us to abstract from any non time varying general characteristics that uniformly a¤ect workers within each occupation across all countries.27 Our estimate for native sf remains negative and highly signi…cant. In a third step, we further restrict the source of variation in preferences (model 3). We now identify an e¤ect solely within country-year and country-occupation (ISCO one-digit) cells.28 Our estimate for native sf remains signi…cant at the 1% level. Overall, the estimates are very robust across the three models, suggesting 2 4All of these estimates are signi…cant at the 1% level (except for partner currently unem-ployed at 5%).
2 5See Alesina and Glaeser (2004).
2 6The standard deviation of sf in our sample is about 10 percentage points - the drop in redistributive preferences for a 1 percentage point increase in the share of foreigners is thus about 0.2.
2 7For example, the higher average education level in management and administrative oc-cupations (ISCO-1) compared to more manufacturing-intensive ococ-cupations (e.g. ISCO-9) is accounted for by this strategy - to the extent that this e¤ect is uniform across countries.
2 8Obviously, this allows us to abstract from country-speci…c di¤erences in average workers’ attitudes per occupation.
that occupation level endogeneities do not substantially bias our basic results. We interpret these results as …rst indication of group loyalty e¤ects between natives and immigrants (Luttmer, 2001). In other words, native workers express a dislike for redistribution in the presence of higher immigration, since such im-migrants tend to rely to a larger degree on the redistributive system.29 We test this interpretation by splitting our sample into workers that hold more negative and more positive view on the economic e¤ects of immigration. Intuitively, we …nd that workers who tend towards the view that "immigrants make [my coun-try] a worse place to live" are less inclined to extend the redistributive system. For this group, the magnitude of such e¤ects increases substantially, whereas it converges to zero for those natives holding a generally more favourably view on immigration.
4.2
Heterogeneity in education and skills
We proceed by extending our analysis to the subsample of native citizens only. We now interact our variables of interest with indicators of individual labor market skill. In line with the previous literature (Scheve and Slaughter, 2001, Mayda, 2006, O’Rourke and Sinnot, 2006) we interpret an individual’s formal education as proxy for labor market relevant skills.30 We expect our interactions of education with immigration (size, diversity, skill ratio) to capture potential labor market e¤ects.
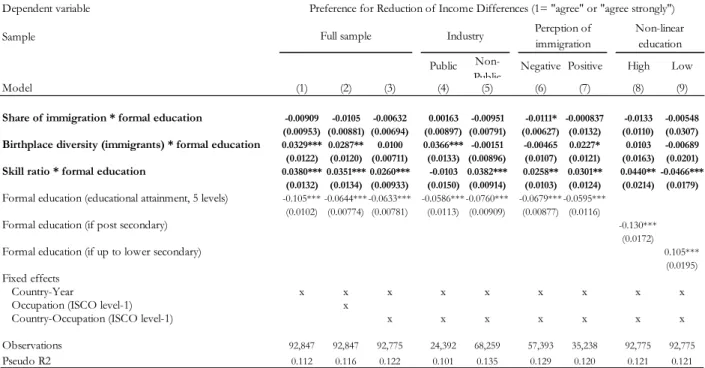
Table 3 shows results for our full model (including all covariates, not shown) on our full sample restricted to native citizens. The table follows the same set-up as Table 2, sequentially introducing …xed e¤ects (models 1-3) and testing for subsample heterogeneity (models 4-5). We …nd that although educated natives on average demand less redistribution, they want more redistribution if immigration is relatively more skilled. More precisely, the interaction of native workers’ education with the skill ratio (of immigrants to natives) is positive (estimated at the 1% level). An increase in educational attainment by one category (e.g. from secondary to some tertiary education) is associated with a 1.1% higher probability to support redistribution (based on marginal e¤ects at the sample mean).31 Very tellingly, this e¤ect is stronger in subsamples of workers (models 4-5) who do not work in the public sector, where they tend to be shielded mostly from competition by outsiders. This association could be driven by labor market competition, but also by preference e¤ects. Educated natives may simply hold a generally more favorable view on immigration, which also lowers they feelings of national group loyalty. We thus re-run our model using a split sample approach. We con…rm the robustness of our estimates in subsamples for both natives with positive and those with negative general 2 9Note that in terms of magnitude, this e¤ect is much smaller than what Dahlberg et al. (2012) have found for native citizens in Sweden.
3 0This is an assumption that has been challenged frequently, e.g. by Hainmueller and Hiscox (2007) and Ortega and Polavieja (2012), among many others. We later relax this assumption. 3 1The strength of this e¤ect is remarkable since statistical discrimination of immigrants in labor markets would imply a relatively low degree of competition for skilled natives (Dequied and Zenou, 2013).
views on immigration (models 6 and 7). Furthermore, we test if our estimate is driven primarily by highly educated workers (thus being non-linear along the distribution of skill). We …nd no evidence for such non-linearity.32 Both …ndings suggest that this e¤ect along the distribution of skill in the native population is driven by perceived labor market competition between skilled natives and skilled immigrants.33
Besides immigrants’relative skill, the diversity of immigrants also matters: Here, simple preference e¤ects seem likely, since the e¤ect is driven purely by those natives who view immigration favourably (model 7), e.g. due to a pref-erence for a diversi…ed set of consumption amenities, see Card, Dustmann and Preston (2012).
Table 4 extends the analysis of labor market e¤ects by replacing our measure of native worker skill, former education, by more speci…c measures of human capital. This strategy allows us to abstract even more clearly from potential endogenous preferences correlated with formal education. Panel 1 shows results for a measure of ISCO four-digit level occupation-speci…c human capital, derived from a question in the second and …fth round of the European Social Survey. This question asks people to specify how long it would take a third person to learn the skills required to perform the same job.34 Higher values indicate higher levels of speci…c experience and human capital. Panels 2 and 3 show results for measures of task skill intensities as popularized by Peri and Sparber (2009), among others. We follow these authors to draw upon the O*Net data-base that provides data on the importance of a full set detailed communicative, cognitive and manual abilities for more than 400 highly detailed occupations in the United States.35 We obtain ISCO four-digit level indicators of the im-portance of communication and manual skills following the de…nition outlined in Peri and Sparber (2009). We now use these indicators to approximate labor market relevant skills that are - to some extent - less correlated with potential other preference-forming e¤ects of higher formal education (e.g. lower levels of ethnocentricity).36 Throughout our estimations, we obtain very similar results. Our estimates for the interaction of skill with immigrants’ skill ratio remain with the expected sign and signi…cance at the 5% level. These estimates are robust to the inclusion of occupation-level …xed e¤ects but lose some (but not always all) signi…cance once we further restrict our identi…cation to country-occupation cells. This is not surprising, since in that latter case we now identify 3 2In models of attitudes to immigration, higher e¤ects for individuals with more than 12 years of education are often interpreted as "preference e¤ects" rather than pure labor market e¤ects (Ortega and Polavieja, 2012).
3 3This interpretation is further supported by the lack of signi…cance for the interaction of share of immigrants and education (see table 3).
3 4We follow Ortega and Polavieja (2012) in linearizing the ordinal answers into years of experience.
3 5We follow the standard assumption in this literature that the task intensities for occupa-tions in the United States are comparable to those in European countries. This allows us to use these indicators in our dataset.
3 6The correlation between educational attainment and these variables in our sample is +.28 (job speci…c human capital), +.44 (communication tasks) and -.41 (manual tasks).
within country/ISCO-1 digit categories and use variation in natives’skills based on ISCO-4 levels (assuming all natives within an ISCO-4 digit cell have same levelof skills). This reduces all variation in natives’ education substantially to variation in skills between ISCO-4 digit level occupations.
Overall, we interpret these results as further evidence for labor market e¤ects of immigration which a¤ect attitudes to redistribution through perceived labor market competition between skilled natives and skilled immigrants.
4.3
Extensions and robustness
4.3.1 Genetic distance, income at origin and group loyalties
We return to our results for native citizens which we interpret as suggestive of group loyalties. It seems reasonable to assume that these e¤ects are stronger where political group identities are formed along the dividing lines between natives and immigrants (see Luttmer and Fong, 2009, on the role of identify formation). Immigrants that are - on some measures - more dissimilar to natives should thus drive such an e¤ect.
We test this hypothesis by conducting a simulation exercise in the spirit of Desmet, Ortuño-Ortin and Wacziarg (2012) and use the methodology employed in Alesina, Harnoss and Rapoport (2013). Essentially, we augment our sf mea-sure by adding group weights djk and ejk to each bilateral share of immigrants (sj) from origin country j to destination k.
sf;augmented= J X j=1
sjk djk ejk (4)
This allows us to weight immigrants by genetic distance and income per capita at origin, using bilateral population-weighted genetic distance (Spolaore and Wacziarg, 2009 based on Alesina et. al, 2003, and Cavalli-Sforza et al., 1994) and a unilateral measure of GDP per capita (PPP) at origin (PWT 8.0, by Feenstra et al., 2013) as inputs.37 We map genetic distance and income at origin into the two group weights djk and ejkusing a logistic function
djk; ejk=
2
1 + e ( xjk) (5)
where is a parameter that ranges from -10 to +10 and xjk takes on stan-dardized values of genetic distance (for djk) and GDP/capita (for ejk): This function is convenient for our purpose.38 It assigns d
jk and ejk values between 0 and 2 (centered on 1 for the theoretical case that all immigrant groups are equidistant to natives). djkand ejkthen act as group weights in the calculation 3 7We standardize these inputs for each destination country and obtain vectors of genetic distance as well as GDP at origin that range from 0 (min) to 1 (max).
3 8It can be centered easily on e.g. djk= 1for groups at average genetic proximity (income) from the natives of a given country and set to converge to two bounds 0 and 2. In addition, by varying a single parameter , we can vary both the slope of the function and the spread between genetically closer (poorer) and more distant (richer) groups.
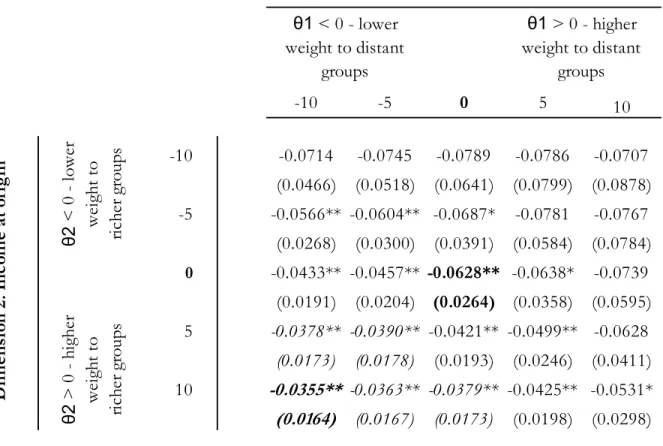
of sf;augmented. Larger absolute values of indicate a higher degree of relative over/under-weighting. Augmented sf indices based on > 0 overweight groups with higher genetic distance (richer origins), those based on < 0 overweight closer groups (poorer origins). The intuition is the following: if, say, genetically more distant (richer) groups were more valuable in terms of explaining group loyalty e¤ects, weighting these groups with djk > 1 and correspondingly giving a lower weight of djk < 1 to genetically closer (poorer) groups should result in an index of sf that has higher explanatory power in our model than its inverse index, one where we overweight closer groups.
Table 5 shows results for these weighting schemes applied jointly. The table shows the coe¢ cients on our augmented share of immigration (sf) interacted with a dummy for native citizens based on model (1) in Table 2. When holding GDP/capita constant (at 2= 0), giving more weight to genetically (culturally) closer immigrants ( 1 < 0) lowers the estimated coe¢ cients for group loyalty e¤ects slightly - in turn, overweighting those groups increases the coe¢ cient (before measurement error a¤ects the results).39 When holding genetic distance constant at ( 1= 0), the estimates on sf native decrease as income at origin increases ( 2> 0).
These simulation exercise results suggest that the e¤ect of immigration on natives’attitudes to redistribution varies somewhat with cultural distance and income at origin (a proxy for many other variables). We interpret these results as giving more weight to our interpretation of group loyalty e¤ects for native citizens vis-a-vis immigrants. 40
4.3.2 Robustness to restricted samples
We conduct a range of robustness checks regarding the de…nition of immigrants and potential outliers in our sample.
First, we re-compute our measures for M ig using country borders pre 1989 to avoid potential biases from counting indigenous people as immigrants (e.g. in the Czech Republic where Slovak inhabitants would be counted as immigrants). We thus re-run the computation of all M ig variables. Our results are fully robust to the use of such alternative de…nitions of origin countries. All estimates of interest remain fully robust at 1% statistical signi…cance and retain their magnitudes, suggesting no strong prior bias from such endogenous border e¤ects. Still, we rely on our standard measures for migration since these post Soviet or Eastern European countries tend to have split along traditional cleavages in the population, making a group distinction along these lines relevant for our analysis.41
Second, we run our basic model restricting our dataset to the …rst two waves (2002 and 2004) of the European Social Survey to check if our results are driven 3 9We follow Spolaore and Wacziarg (2009) in interpreting genetic distance as composite measure of cultural distance.
4 0Still, we are cautious not to over-emphasize these results since these di¤erences are statis-tically signi…cant from the baseline coe¢ cient only for a subset of genestatis-tically closer and also richer immigrants.
not by the stock of immigrants in 2000 but by later subsequent immigration that happened in the 2000s, say after the EU enlargement round that took e¤ect in 2004. Our estimates of group loyalty e¤ects remain robust at the 5% and 1% signi…cance level and even - as expected - increase slightly in magnitude.42
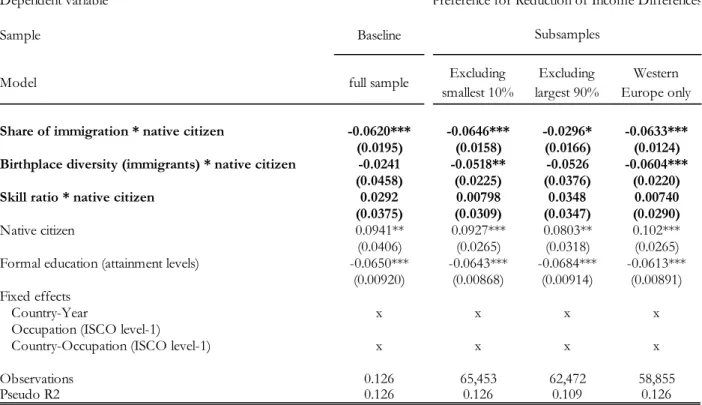
Third, we restrict our sample to various subsets to account for potential outliers in the distribution of M ig variables. Table 6 shows results. We cut our sample …rst by dropping the lowest 10% of observations on the share of immigrants, the diversity of immigrants and the skill ratio, and subsequently do so for the largest 10% of observations. Our results for group loyalty and labor market e¤ects remain fully robust in the …rst case and lose some - but not all - signi…cance for group loyalty e¤ects in the second.43 Lastly, we restrict our sample to Western European countries.44 Our results remain fully robust at very comparable magnitudes and statistical signi…cance.
4.4
Addressing reverse causality
Our empirical strategy so far accounts for omitted variables at the country and country/occupation level, but not for reverse causality. Reverse causality could bias our estimates if e.g. occupations with workers that tend to demand more redistribution attract more (or relatively less skilled) immigrants. We thus proceed with an instrumental variable strategy based on a gravity model of migration. Our objective is to predict sf, Divmig and SkillRatio solely as a function of bilateral geographic and cultural factors that are exogenous to attitudes to redistribution.45 We proceed in this vein. Speci…cally, we use the following model to predict bilateral migration stocks. These in turn are the basis for the calculation of predicted sf, Divmig and SkillRatio variables that serve as instruments.
mjkos = + 1 P OP U LAT IONkos+ 2 DIST AN CEjk + 3 BORDERjk+ 4 OF F:LAN GU AGEjk+
+ 5 COLON Yjk+ j+ ejkos (6) mijks is the bilateral immigration stock from origin country j to destina-tion country k in ISCO one-digit occupadestina-tion level o for immigrants of skill level s. The choice of our model determinants follows the canonical literature set-up (e.g. Mayda, 2010, Grogger and Hanson, 2011, Beine, Docquier and Schi¤, 2013, Ortega and Peri, 2009 and 2014) but is purposefully limited to variables that do not directly a¤ect attitudes, such as native population size per ISCO one-digit occupation (from Dumont et al., 2010), bilateral distance, common border, com-mon o¢ cial language, and comcom-mon colonial history (all from CEPII availably
4 2Results are available upon request.
4 3This is driven more by the omission of countries with high diversity than by the omission of countries with high share of immigration.
4 4Precisely, we limit the sample to countries that were part of the European Union as of 1.1.2000.
4 5Similar gravity models have been used to predict the share of immigration (Ortega and Peri, 2014) and birthplace diversity (Alesina et al., 2014).
from Head et al., 2010). We also include origin country …xed e¤ects ( j) to ac-count for common origin shocks to migration which in‡uence migrants’location decision across destinations. Our instrumentation approach thus is valid to the extent that bilateral variables do not a¤ect attitudes to redistribution within ISCO-1 occupations othan than through immigration.
We then estimate our gravity model using the PPML estimator.46 Ta-ble 7 shows results for our gravity model. As expected, all covariates a¤ect occupation-level migration positively, with the exception of bilateral distance (as a proxy for migration costs, this term enters negatively - border contiguity picks up the main part of this e¤ect in our model). The migration of skilled workers is less a¤ected by distance and border contiguity (which absorbs much of the variation in distance), but facilitated by a shared language.
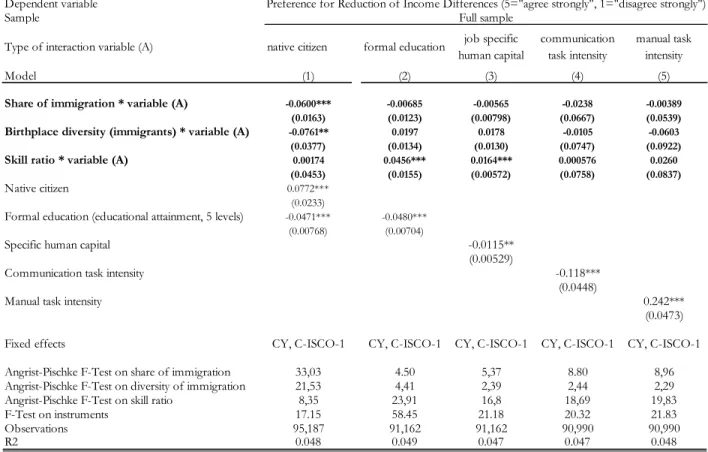
Table 8 shows IV results using a 2SLS estimator on our basic model using the full distribution of answer options as dependent variable. We instrument all three margins of immigration, the share, the diversity and the skill ratio of immigrants to natives within each country’s ISCO one-digit level occupation. Model (1) shows our full model for group loyalty e¤ects, where we interact our instrumented migration variables with a dummy for native citizens. The interac-tion with share of immigrainterac-tion, which we interpret as indicative of group loyalty e¤ects, remains negative and highly signi…cant (at 1% level).47 We also …nd that natives respond negatively to increased diversity of immigrants.48 Overall, the model is based on su¢ ciently strong instruments, the joint instrument strength clearly lies above a critical value of F>10.49 We now turn to our models to illustrate education/skill heterogeneities (2)-(5). We con…rm our previous pro-bit model …ndings for formal education and also for job speci…c human capital (both at 1%). This suggests that more skilled natives respond to more skilled immigration in part by increasing their demand for redistribution. Lastly, we turn to our models with task skill intensities. Like in our probit models, the variation in ISCO four-digit level task skill variables is not su¢ cient to identify an e¤ect on attitudes within the narrowly de…ned country-ISCO one-digit cells. Overall, we conclude that our main results that we interpret as indicative evidence for group loyalties and labor market e¤ects appear robust to instru-mentation and are thus unlikely to be a¤ected by ISCO one-digit occupation level reverse causality.
4 6The pseudo poisson maximum likelihood (PPML) estimator has been suggested by Santos Silva and Tenreyro (2006) for applications in this context since it is does not feature the bias arising from log-linearization of the gravity equation (as is the case for OLS).
4 7The magnitudes between OLS and IV are not directly comparable due to di¤erent depen-dent variables and estimators used.
4 8In the context of group loyalties, this may imply that more diverse immigrants tend to hail from more (and more diverse origins), which in itself tends to magnify group loyalty e¤ects (see our preceding discussion on cultural distance).
4 9Here, we note that Stock and Yogo (2002) do not provide critical values for models with three instruments. Critical values for models with two instruments lie at F between 4 and 7.
5
Conclusion
We analyze the relationship between immigration and attitudes to redistribution in Europe. Empirical studies mainly for the U.S. show that racial and ethnic di¤erences within a community lower average preferences for redistribution and lead to lower levels of public spending.50 Strikingly, empirical evidence for Europe is very limited. We hope to …ll this gap. Using European Social Survey and OECD migration data for individuals in 28 European countries, we …nd evidence consistent with two potential channels: Group loyalty and labor market e¤ects.
First, a 1 percentage point increase in the share of immigrants lowers natives’ preferences in favor of redistribution by about 0.2 percent (up to 0.3 percent for those with negative attitudes to immigration). This suggests that the presence of immigrants directly a¤ects natives’preferences for redistribution. While this is true, the magnitudes are signi…cantly smaller than those measured for the United States. We also show that these group loyalty e¤ects increase with cultural distance between immigrants and natives and decrease in origin country income per capita - consistent with an interpretation of group loyalties.
Second, we …nd that immigrants’relative education level a¤ects preferences for redistribution along the distribution of natives’skill level. College-educated natives are more likely to support redistribution if immigration is also more highly educated. Highly skilled native citizens have thus a 0.1 percent higher likelihood to demand more redistribution if the skill level of immigrants increases by 1 percentage point (relative to natives). Tellingly, these results are weaker for public sector workers, robust to using indicators of self-assessed job-speci…c human capital and robust to potential confounding preference e¤ects. They also hold to a large extent when using measures of communication and manual task intensity (Peri and Sparber, 2009). We interpret these …ndings as indica-tive of labor market competition e¤ects, namely that labor market exposure to skilled immigrants and perception of labor market competition makes edu-cated/highly skilled natives demand more redistribution. The overall e¤ect of these two compensating e¤ects (group loyalties and labor market competition) on redistribution policy depends on the level of education of the median voter. We conclude that birthplace diversity - not racial/ethnic diversity - is the politically salient margin of diversity in Europe. Immigrants - unlike ethnic mi-norities per se - a¤ect natives’actual and perceived labor market outcomes. As a result, attitudes to redistribution in Europe are not purely shapred by nega-tive group loyalty e¤ects, but also by partly compensating posinega-tive labor market e¤ects. Overall, the magnitude of these e¤ects is quite low - the 2008/2009 re-cession in Europe had much larger e¤ects on attitudes to redistribution.51 This suggests that while immigration to Europe does a¤ect support for the welfare state in Europe, its e¤ect should not be overstated.
5 0See Alesina and La Ferrara (2005) for a literature review.
5 1Support for redistribution increased on average by 3 percentage points throughout Europe - about 10-15x of the e¤ects we measure for a 1% point increase in immigration.
6
References
Adema, W., P. Fron and M. Ladaique (2011), "Is the European Welfare State Really More Expensive. Indicators on Social Spending, 1980-2012 and a Manual to the OECD Social Expenditure Database (SOCX)." OECD Social, Employment and Migration Working Paper No. 124.
Alesina, A., R. Baqir and W. Easterly (1999), "Public Goods and Ethnic Divisions." Quarterly Journal of Economics, 114(4): 1243-1284.
Alesina, A., R. Baqir and C. Hoxby (2004), "Political Jurisdictions in Het-erogeneous Communities." Journal of Political Economy, 112(2): 348-396.
Alesina, A., A. Devleeschauwer, W. Easterly, S. Kurlat and R. Wacziarg (2003), "Fractionalization." Journal of Economic Growth, 8(2): 155-194.
Alesina, A. and E. La Ferrara (2005), "Preferences for Redistribution in the Land of Opportunities." Journal of Public Economics, 89(5): 897-931.
Alesina, A. and N. Fuchs-Schündeln (2007), "Goodbye Lenin (or Not?): The E¤ect of Communism on People." American Economic Review, 97(4): 1507-1528.
Alesina, A. and P. Giuliano (2010), "Preferences for Redistribution." in J. Benhabib, M. Jackson and A. Bisin (eds.): Handbook of Social Economics, Vol. 1A, The Netherlands: North Holland: 93-131.
Alesina, A. and E. Glaeser (2004), "Fighting Poverty in the U.S. and Europe: A World of Di¤erence." Oxford: Oxford University Press.
Alesina, A., J. Harnoss and H. Rapoport (2014), "Birthplace Diversity and Economic Prosperity." Journal of Economic Growth 21(2): 101-138.
Beine, M., F. Docquier and M. Schi¤ (2013), "Migration, Transfer of Norms and Home Country Fertility." Canadian Journal of Economics, 46(4): 1406-1430.
Benabou, R. and E. Ok (2001), "Social Mobility and the Demand for Redis-tribution: The POUM Hypothesis." Quarterly Journal of Economics, 116(2): 447-487.
Boeri, T. (2010), Immigration to the Land of Redistribution. Economica 77(308): 651-687.
Borjas, G. (1999), "Immigration and Welfare Magnets." Journal of Labor Economics, 17(4): 607-637.
Burgoon, B., F. Koster and M. van Egmond (2012), "Support for Redistri-bution and the Paradox of Immigration." Journal of European Social Policy, 22(3): 288-304.
Burgoon, B. (2014), "Immigration, Integration and Support for Redistribu-tion in Europe." World Politics, 66(3): 365-405.
Card, D., C. Dustmann and I. Preston (2005), "Understanding Attitudes to Immigration: The Migration and Minority Module of the …rst European Social Survey." CDP Working Paper No 03/05.
Card, D., C. Dustmann and I. Preston (2012), "Immigration, Wages, and Compositional Amenities." Journal of the European Economic Association, 10(1): 78-119.
Cavalli-Sforza, L., P. Menozzi and A. Piazza (1994), "The History and Ge-ography of Human Genes." Princeton University Press, Princeton.
Collier, P. (2013): Exodus. Immigration and Multiculturalism in the 21st Century, Oxford: Oxford University Press.
Corneo, G. (2001), "Inequality and the State: Comparing U.S. and German Preferences." Annales d’Economie et de Statistique, 63-64: 283-296.
Corneo, G., and H. Grüner (2002), "Individual Preferences for Political Re-distribution." Journal of Public Economics, 83(1), 83-107.
Dahlberg, M., K. Edmark and H. Lundqvist (2012), "Ethnic Diversity and Preferences for Redistribution." Journal of Political Economy, 120(1): 41-76.
Desmet, K., I. Ortuño-Ortín and R. Wacziarg (2012), "The Political Econ-omy of Ethnolinguistic Cleavages." Journal of Development Economics, 97(2): 322-338.
Dequied, V. and Y. Zenou (2013), "International Migration, Imperfect In-formation and Brain Drain." Journal of Development Eocnomics, 101: 117-132. Dumont, J.-P., G. Spielvogel and S. Widmaier (2010), "International Mi-grants in Developed, Emerging and Developing Countries: an Extended Pro…le." OECD Social, Employment and Migration Working Papers No. 114.
Finseraas, H. (2009), "Income Inequality and Demand for Redistribution: A Multilevel Analysis of European Public Opinion." Scandinavian Political Stud-ies, 32(1): 94-119.
Fong, C. (2001), "Social Preferences, Self-interest and the Demand for Re-distribution." Journal of Public Economics, 82(2): 225-246.
Fong, C. and E. Luttmer (2009), "What Determines Giving to Hurricane Katrina Victims? Experimental Evidence on Racial Group Loyalty." American Economic Journal: Applied Economics, 1(2): 64-87.
Grogger, J. and G. Hanson (2011), "Income Maximization and the Selection and Sorting of International Migrants." Journal of Development Economics, 95: 42-57.
Guillaud, E. (2011), "Preferences for Redistribution: An Empirical Analysis over 33 Countries." Journal of Economic Inequality, 11(1): 57-78.
Hainmueller, J. and M. Hiscox (2007), "Educated Preferences: Explaining Attitudes Toward Immigration in Europe." International Organization, 61(2): 399-442.
Harnoss, J. (2013), "Birthplace Diversity and Attitudes to Immigration." Mimeo.
Harnoss, J. (2014), "Essays on the Economics of Immigration and Birthplace Diversity", Economies and …nances. Université Panthéon-Sorbonne - Paris I, 2014.
Head, K., T. Mayer and J. Ries (2010), "The Erosion of Colonial Trade Linkages after Independence." Journal of International Economics, 81(1): 1-14. Feenstra, R., R. Inklaar and M. Timmer (2013), "The Next Generation of The Penn World Table." Available for download at www.ggdc.net/pwt.
Lazear, E. (1999), "Culture and Language." Journal of Political Economy 107(6): 95-126.
Luttmer, E. (2001), "Group Loyalty and the Taste for Redistribution." Jour-nal of Political Economy, 109(3): 500-528.
Luttmer, E. and M. Singhal (2011), "Culture, Context, and the Taste for Redistribution." American Economic Journal: Economic Policy, 3(1): 157-179. Magni-Berton, R. (2013), "Immigration, Redistribution, and Universal Suf-frage." Public Choice: 1-19.
Mayda, A. (2006), "Who Is Against Immigration? A Cross–country Investi-gation of Individual–level Attitudes toward Immigrants." Review of Economics and Statistics, 88(3): 510–530.
Mayda, A. (2010), "International Migration: A Panel Data Analysis of the Determinants of Bilateral Flows." Journal of Population Economics, 23(4): 1249-1274.
Meltzer, A. and S. Richard (1981), "A Rational Theory of the Size of Gov-ernment." Journal of Political Economy, 89(5): 914-927.
Muñoz, J. and S. Pardos (2017), "Immigration and Support for the Welfare State: An Experimental Comparison of Universal and Means-Tested Policies." Political Science Research and Methods: 1-19.
O’Rourke, K. and R. Sinnott (2006), "The determinants of individual at-titudes towards immigration." European Journal of Political Economy, 22(4): 838-861.
Ortega, F. and G. Peri (2009), "The Causes and E¤ects of International Migrations: Evidence from OECD countries 1980-2005." NBER Working Paper 14833.
Ortega, F. and G. Peri (2014), "Openness and Income: The Roles of Trade and Migration." Journal of International Economics 92(2): 231-251.
Ortega, F. and J. Polavieja (2012), "Labor Market Exposure as Determinant of Attitudes toward Immigration." Labour Economics, 19(3): 298-311.
Peri, G. and C. Sparber (2009), "Task Specialization, Immigration, and Wages." American Economic Journal: Applied Economics, 1(3): 135-69.
Piketty, T. (1995), "Social Mobility and Redistributive Politics." Quarterly Journal of Economics, 110(3): 551-584.
Putnam, R. (1995), "Bowling Alone: America’s Declining Social Capital." Journal of Democracy, 6(1): 65-78.
Santos Silva, J. and S. Tenreyro (2006), "The Log of Gravity." The Review of Economics and Statistics, 88(4): 641-658.
Scheve, K. and M. Slaughter (2001), "Labor Market Competition and Indi-vidual Preferences Over Immigration Policy." Review of Economics and Statis-tics, 83(1): 133-145.
Senik, C., H. Stichnoth and K. Van der Straeten (2009), "Immigration and Natives’ Attitudes towards the Welfare State: Evidence from the European Social Survey." Social Indicators Research, 91(3): 345-370.
Sinn, H.-W. (1995), "A Theory of the Welfare State." Scandinavian Journal of Economics, 95(4): 495-526.
Sorkoa, S., Johnston, R. and K. Banting (2006), "Ties that Bind: Social Cohesion and Diversity in Canada." In K. Banting, T. Courchene and F. Seidle,
eds., The Art of the State III: Belonging? Diversity, Recognition and Shared Citizenship in Canada. Montreal: Institute for Research in Public Policy.
Spolaore, E. and R. Wacziarg (2009), "The Di¤usion of Development." Quar-terly Journal of Economics, 124(2): 469-529.
Stichnoth, H. (2012), "Does Immigration Weaken Natives’ Support for the Unemployed? Evidence from Germany." Public Choice, 151(3/4): 631-654.
Stichnoth, H. and K. Van der Straeten (2013), "Ethnic Diversity, Public Spending and Individual Support for the Welfare State: A Review of the Em-pirical Literature." Journal of Economic Surveys, 27: 364-389.
Stock, J. and M. Yogo (2002), "Testing for Weak Instruments in Linear IV Regression." In Donald Andrews and James H. Stock, eds. Identi…cation and Inference for Econometric Models: Essays in Honor of Thomas Rothenberg, New York, NY: Cambridge University Press.
7
Appendix
7.1
Construction of immigration variables
Using the DIOC-E 2000 (release 3.0) dataset provided by the OECD (Du-mont, Spielvogel and Widmaier, 2010), we calculate three immigration variables (share, diversity and relative skill ratio) on two levels of aggregation, the country of destination and the ISCO 88 one-digit level occupation.
These standard literature variables allows us to characterizing the size sf, origin-mix DivM ig, and relative skill ratio SkillRatio of the foreign-born pop-ulation per countryk (or country-occupation cell ko), where sj is the share of immigrants of origin j in terms of all immigrants:
Sf;sk= immigrantssk immigrantssk+ nativessk (7) Divsk= J X j=1 h sj (1 sj) i (8) Alesina et. al. 2013 decompose the standard Her…ndahl index of population birthplace diversity and show that these two variables can be interpreted as the size (sf) and variety (DivM ig) margins of birthplace diversity. The relative skill ratio of immigrants to natives follows Mayda (2006) and is de…ned as the log of the ratio of the share of skilled to unskilled immigrants over the ratio of the share of skilled (index s = s) to unskilled (index s = u) natives (e.g., at SkillRatiokt= 1, both populations have the same level of education).
SkillRatiok= ln immigrantssk immigrantsu;k nativessk nativesuk ! (9) The input data is based on country-level census and (for some countries) additional survey data. The data covers 32 OECD destination countries and
immigrants from all OECD origins as well as 68 further non OECD-countries of origin. Population is de…ned as age 15 and above, immigrants are de…ned as residents who are not born in their respective country of residence.
While the overall dataset is very rich, some observations su¤er from missing information. The calculation of our immigration variables is mostly a¤ected by lack of information on the country of origin. This applies only to few ob-servations, mainly limited to Germany and Slovenia. We decide to disregard these observations since an arbitrary classi…cation as native or foreign yields unrealistic results. Missing data on educational attainment are less problematic and relate mostly to the relative skill ratio. We keep these observations (where we don’t make use of this dimension) for sf and DivM igbut consequently drop them when calculating SkillRatio. A last issue relates to people with origins that are clearly foreign but cannot be assigned to a country of birth. The DIOC database assigns these to regions or, if impossible, to a last bucket “other origins”. This issue relates mostly to the measure of immigrant birthplace di-versity and mostly adds white noise. We keep thus keep these observations in the dataset.
For occupation level data, we further standardize the occupational classi-…cation to ISCO 88 for countries where national classiclassi-…cations are used (only Turkey in our case) and aggregate data by the one-digit level. We drop ob-servations with missing occupational status information. in line with the ISCO classi…cation system, we keep members of the Armed Forces separate from other occupational categories.
We thus end up with three variables (share, diversity and relative skill ratio) per country and per country/one-digit ISCO occupation combination for the year 2000.