Publisher’s version / Version de l'éditeur:
Proceedings of the 24th International Congress on Sound and Vibration, 2017-07-27
READ THESE TERMS AND CONDITIONS CAREFULLY BEFORE USING THIS WEBSITE.
https://nrc-publications.canada.ca/eng/copyright
Vous avez des questions? Nous pouvons vous aider. Pour communiquer directement avec un auteur, consultez la
première page de la revue dans laquelle son article a été publié afin de trouver ses coordonnées. Si vous n’arrivez pas à les repérer, communiquez avec nous à [email protected].
Questions? Contact the NRC Publications Archive team at
[email protected]. If you wish to email the authors directly, please see the first page of the publication for their contact information.
NRC Publications Archive
Archives des publications du CNRC
This publication could be one of several versions: author’s original, accepted manuscript or the publisher’s version. / La version de cette publication peut être l’une des suivantes : la version prépublication de l’auteur, la version acceptée du manuscrit ou la version de l’éditeur.
Access and use of this website and the material on it are subject to the Terms and Conditions set forth at Low-frequency structure-borne sound power measurements using heavyweight reception plates
Reinhold, Steffi; Hopkins, Carl; Zeitler, Berndt
https://publications-cnrc.canada.ca/fra/droits
L’accès à ce site Web et l’utilisation de son contenu sont assujettis aux conditions présentées dans le site LISEZ CES CONDITIONS ATTENTIVEMENT AVANT D’UTILISER CE SITE WEB.
NRC Publications Record / Notice d'Archives des publications de CNRC: https://nrc-publications.canada.ca/eng/view/object/?id=ae76339b-d2f5-4bee-a54b-34ac348871e2 https://publications-cnrc.canada.ca/fra/voir/objet/?id=ae76339b-d2f5-4bee-a54b-34ac348871e2
LOW-FREQUENCY STRUCTURE-BORNE SOUND POWER
MEASUREMENTS USING HEAVYWEIGHT RECEPTION
PLATES
Steffi Reinhold
Acoustics Research Unit, School of Architecture, University of Liverpool, Liverpool, UK and University of Applied Sciences Stuttgart, Building Physics, Acoustics Unit, Stuttgart, Germany email: [email protected]
Carl Hopkins
Acoustics Research Unit, School of Architecture, University of Liverpool, Liverpool, UK
Berndt Zeitler
University of Applied Sciences Stuttgart, Building Physics, Acoustics Unit, Stuttgart, Germany
To quantify the structure-borne sound power injected by building machinery into heavyweight buildings the reception plate method according to EN 15657-1 can be used to provide input data for the prediction model described in EN 12354-5. This paper concerns the assessment of different sampling strategies for vibration measurements that are needed to determine the reception plate power. This is carried out using a validated finite element model for a heavyweight reception plate with viscoelastic material around its boundaries. The lowest differences between the direct injected power and reception plate power are obtained by using a regular grid of sampling posi-tions over the whole reception plate. These investigaposi-tions are based on harmonic force excitation of randomly distributed single-contact sources. A numerical approach to estimate the structural behaviour of harmonic point force excitations is compared with measurements on a laboratory heavyweight reception plate. Building machinery have usually more than one contact point to the structure, where they are connected. Therefore, multiple-contact sources such as white goods are also determined. The resulting effects of harmonic multiple-force excitations with different posi-tions on the validated reception plate model are discussed.
Keywords: structure-borne sound power, reception plate, FEM
1. Introduction
In heavyweight buildings, machinery can cause vibration of the structure which is transmitted to other connected walls and floors causing noise to be radiated into other rooms. To predict sound pressure levels in these rooms it is necessary to know the structure-borne sound power that is injected by a machine into the wall and/or floor to which it is connected. This can be measured using an isolated reception plate [1] as specified in EN 15657-1 [2]. However, this approach cannot always be used for a wall/floor in a real building because significant errors occur due to energy returning from other connected walls and floors [3,4]. With knowledge of the structure-borne sound power it is pos-sible to use the prediction model EN 12354-5 [5] to estimate the room sound pressure levels.
In this paper a validated FEM model of a heavyweight reception plate is used to compare the reception plate power with the direct injected power for harmonic point force excitation. This vali-dated model is used to estimate the structure-borne sound power of single-contact sources when com-pared with measurements on the laboratory heavyweight reception plate. The FEM model is then
ICSV24, London, 23-27 July 2017
2 ICSV24, London, 23-27 July 2017
used to assess different sampling strategies for vibration measurements on a reception plate with a weighting factor to minimise errors and reduce the number of measurement positions. In the real world, building machinery rarely has only one contact point. Hence, multiple-contact sources repre-senting white goods were also considered using different positions on the FEM reception plate.
2. Reception plate test rig
In the laboratory at Stuttgart the heavyweight reception plate test rig consists of three decoupled 100 mm concrete plates (areas between 5.34 m² and 6.85 m²) that are perpendicular to each other. The damping of the plates is altered by using viscoelastic layers (Sylomer HD 30) around the edges which has a high internal loss factor. This paper only considers the horizontal reception plate.
2.1 Finite Element Method (FEM)
Direct steady-state dynamic analysis in ABAQUS software is used to solve the in vacuo plate response with single or multiple point forces using a frequency resolution of 1 Hz. The concrete re-ception plate was created using thin triangular shell elements (STRI3) with element sizes < B/8 over
the frequency range of interest (20 to 2k Hz). Material properties of the concrete plate were deter-mined in previous work [2,6,7]. The viscoelastic material around the boundaries was modelled as spring-dashpot elements with grounded connections. The FEM model of the horizontal reception plate was successfully validated against experimental results as described in [7,8].
Figure 1: FEM model of the horizontal reception plate.
2.2 Structure-borne sound power characterisation
The structure-borne sound power of a source can be quantified using the reception plate method according to [2]. This allows a practical characterisation of structure-borne sound sources under steady-state conditions with any number of contact points located at arbitrary positions when the plate is energized into bending vibration only. The total structure-borne sound power injected to a reception plate is given by:
2 rec
W m
v
. (1)where
is the angular frequency, m is the plate mass, is the total loss factor of the plate and 2v
is the spatial-average mean-square plate velocity.For a perpendicular force at a single contact point, the real part of the complex structure-borne sound power injected to the receiver is given by:
* inj 1 Re 2 W F v. (2)
where F is the complex force, v is the complex velocity at the driving-point, * indicates the com-plex conjugate. For perpendicular forces at N contact points the structure-borne sound power is [9]:
2 H H H inj 1 1 1 1 1 Re Re Re 2 2 2 2 N n n n W F v F Y F
. (3)where F and v are complex vectors at the driving-points, Y is the real, symmetric and non-negative mobility matrix of the receiving structure and the superscript H denotes the complex conjugate trans-pose (Hermitian transtrans-pose) value. The term F Y FH can be re-expressed into H using orthogo-nal transformation where is the diagonal matrix of the real eigenvalues n of Y and is the corresponding complex force vector [9,10]. In this paper, the direct injected power (Eqs. (2) and (3)) are used to validate the results of the reception plate power (Eq. (1)).
3. Single-contact sources
3.1 Numerical investigations with FEM
In Figure 2 the direct injected power is compared with the reception plate power using the average velocity from all 2337 elements for each of five randomly positioned point forces. There is close agreement (± 1 dB) between 20 and 2k Hz. Although there are no bending modes predicted in the 63 and 80 Hz bands, the errors are low due to the highly damped modes in adjacent bands. Note that there is still close agreement in the 20 and 25 Hz bands where only whole body modes occur.
Figure 2: Direct injected power – solid lines, reception plate power – dashed lines (upper graph); direct in-jected power minus reception plate power (lower graph).
3.2 Comparison of simulation results against measurements
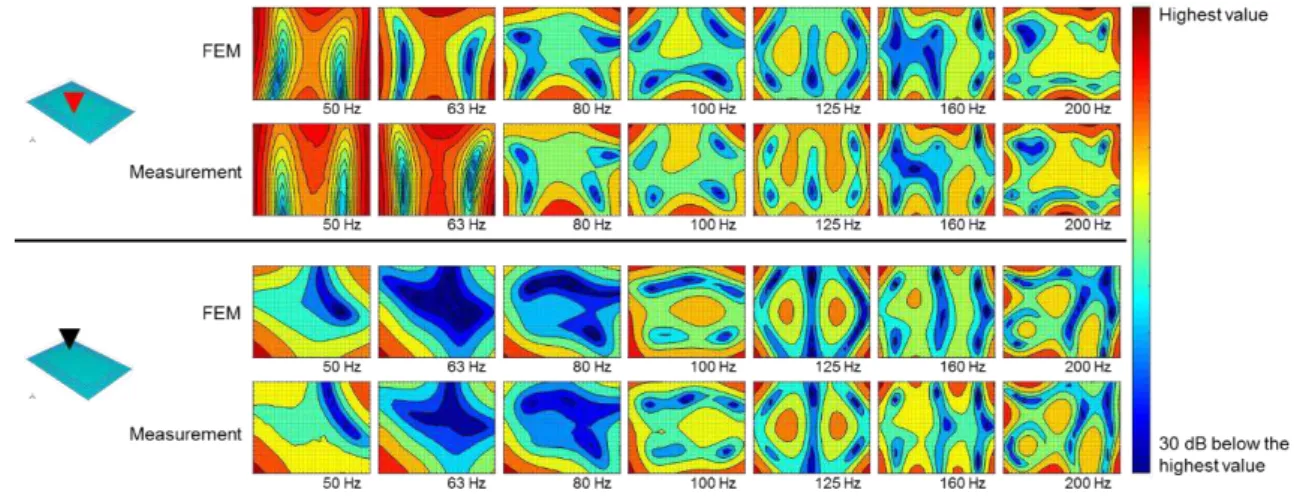
A grid with 0.1 m spacing is used on the reception plate giving a total of 609 points. The excitation signal is broadband noise for both FEM and measurements. Figure 3 shows the contour plots of the velocity levels in one third octave bands over the entire plate surface for two different point excitation positions. FEM and experimental plots show close agreement for the seven amplitude shapes between 50 and 200 Hz.
ICSV24, London, 23-27 July 2017
4 ICSV24, London, 23-27 July 2017
To allow comparison of FEM results with measurements the velocity levels are normalised to the direct injected power. Normalised central zone velocity values (≥ 0.5 m away from edges) from FEM and measurements are shown in Figure 4 and show reasonably close agreement (within 3 dB).
Figure 4: Normalised velocity levels: FEM – solid lines and measurement – dashed lines (upper graph); devi-ation of normalised velocity levels between FEM and measurement (lower graph).
3.3 Proposed sampling strategy for reception plate method
In previous sections, the velocity levels were energetically averaged over a fine regular grid. For measurements, it is not practical to measure at many grid positions. Therefore, a sampling strategy is sought to estimate the spatial-average velocity over the entire surface using only a few positions. Referring back to Figure 3 it can be seen that the velocity levels near corners tend to be larger than velocity levels in the central zone of the plate, even though the plate is supported by viscoelastic material around the boundaries. Similar issues were previously identified with field measurements of airborne sound insulation between rooms at low frequencies [11]. The same approach is applied here with the reception plate by defining a weighting factor, X, to combine velocity measurements from each of the four corners and the central zone (≥ 0.5 m away from edges) of the plate. The combined spatial-average velocity level giving an estimate of the plate average velocity level is defined by:
CentralZone/10 Corner/10 v 10 10 10 lg 1 L L X L X . (4)
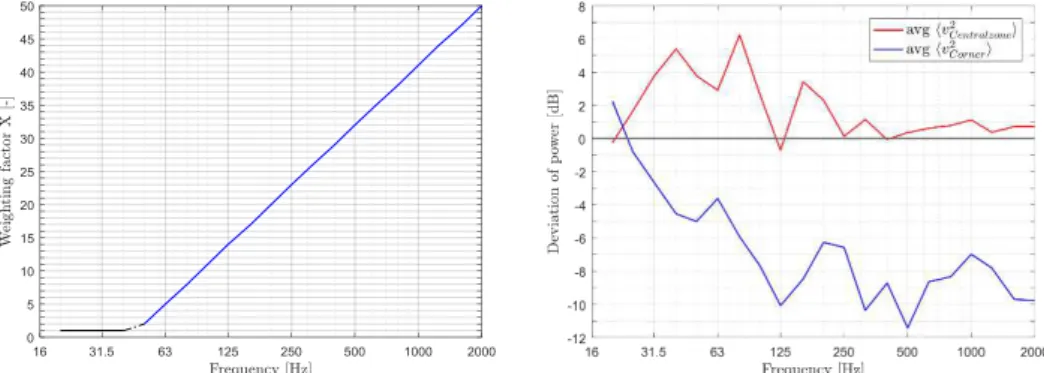
The proposed empirical weighting factor X is shown in Figure 5. X = 1 at frequencies up to 40 Hz which indicates that corners and central zone are equally important. At 50 Hz, X = 2 and then in-creases by a factor of three per doubling of frequency band because the corners become less important with increasing frequency. Using this empirical weighting, Figure 6 shows good agreement (± 3 dB) between the direct injected and reception plate power between 20 and 125 Hz where mode counts are low. Above 125 Hz the mode counts increase and the agreement improves to ± 1.5 dB.
Figure 5: (Left) Weighting factor X for the reception plate power. (Right) Direct injected power minus recep-tion plate power for central zone and corner posirecep-tions.
Figure 6: Direct injected power minus reception plate power using weighting factor X.
4. Multiple-contact sources
4.1 Numerical experiments with FEM
In practice, machinery rarely has one contact point; hence, numerical experiments with FEM are now used to investigate sources with four contacts in a 60 x 60 cm square representing typical white goods. Harmonic point forces are applied at the contacts with either zero or random phase between them. All elements are used to calculate the spatial-average velocity for the reception plate power.
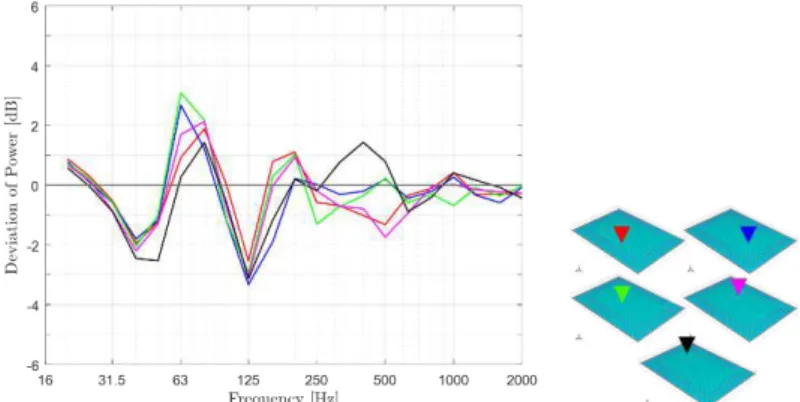
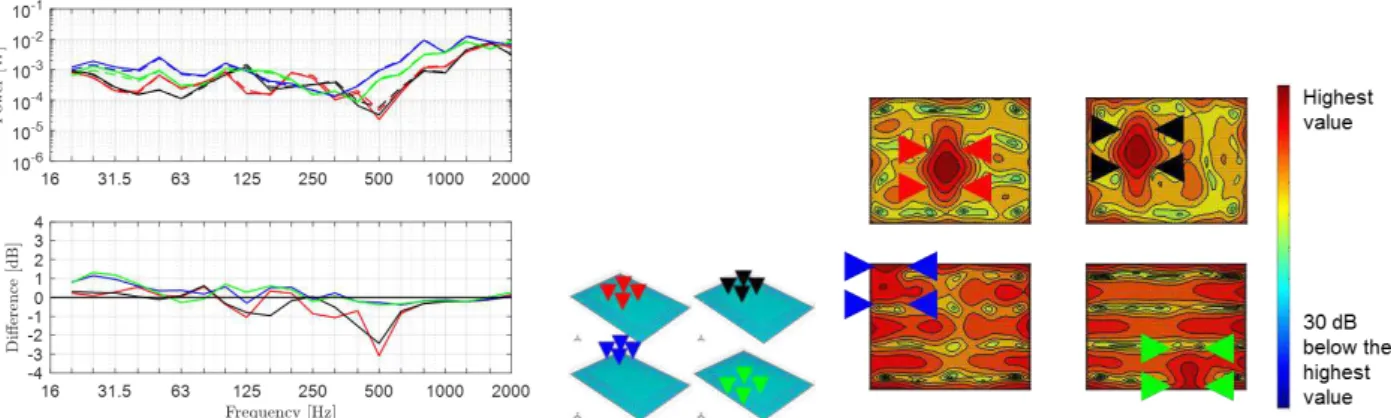
The first step is to place the sources parallel to the reception plate edges with the zero-phase as-sumption. Figure 7 shows that close agreement (± 1 dB) is achieved between the direct injected power and the reception plate power for excitation positons that have at least two or more contact points close to corners/edges. However, for source locations in the central zone (i.e. no contact points close to corners/edges) a difference of 2 to 3 dB occurs at 500 Hz. At this frequency, the distance between the contact points on each side (i.e. 60 cm) corresponds to nearly one-half of the bending wavelength of the plate. Contour plots of velocity levels at 500 Hz over the plate surface are shown in Figure 7. These show that the highest velocity levels occur underneath the source when the source location is in the central zone. The four zero-phase contacts ‘force’ the plate to have a high response by imposing a half-wavelength response between the contacts; this leads to overestimation of the reception plate power. This issue doesn’t occur when the source is near corners/edges because (a) the magnitude and phase of the driving-point mobility at each of the four contacts are sufficiently different, (b) there is usually a high response near excited corners/edges and (c) modes are excited which have a high re-sponse near corners/edges. Figure 8 shows that this effect is still present when all elements are ex-cluded within a radius of the excitation positions in the central zone for the reception plate power determination. However, for sources at corner and edge positions this approach tends to underesti-mate reception plate power. This problem can be avoided for all sources in the central zone of the plate by excluding all elements underneath the source and up to 0.1 m away from all contacts (see Figure 8). However, the reception plate power is underestimated at frequencies up to 500 Hz for sources which have at least two contact points on corners/edges of the plate.
In Figure 9 it is considered that the white goods source uses the same four excitation conditions (zero-phase forces) but is rotated at an angle to the plate boundaries. The same results occur as de-scribed before in this section. The difference between the powers is smaller than with sources orien-tated parallel to the plate edges.
The same multiple-contact sources aligned parallel to the plate perimeter are now excited with random-phase forces (see Figure 10). When the sources are placed in the central zone of the plate, the comparison of the direct injected power and the reception plate power (all elements and excluding all elements underneath the source and up to 0.1 m away from all excitation positions) shows close agreement with ± 1 dB over the frequency range of interest (20 to 2k Hz). When two or three contacts are located near corners/edges of the plate there is close agreement with a difference of ± 1 dB over
ICSV24, London, 23-27 July 2017
6 ICSV24, London, 23-27 July 2017
reception plate power. By excluding all elements underneath the source and up to 0.1 m away from all contacts, the difference increases up to 2 dB in the low-frequency range.
The results indicate that for sources such as white goods some tentative rules could be defined to avoid problems with structure-borne sound characterisation using the reception plate. If the forces have a zero-phase difference (more likely to occur at low-frequencies) the reception plate power can be overestimated at a frequency where the distance between the contacts corresponds to one-half of the bending wavelength of the plate when the source is located in the central zone parallel/angle to the plate edges. In the absence of detailed information on the phase difference between the contact forces, errors could be avoided by placing white goods in the central zone of the plate (i.e. not near corners/edges of the plate edges) and excluding measurement positions underneath the machine and up to 0.1 m from all contact positions.
The advantage of validated FEM models is that they can be used to identify and avoid potential errors before using a power substitution method which might be time-consuming especially when sources have many contacts.
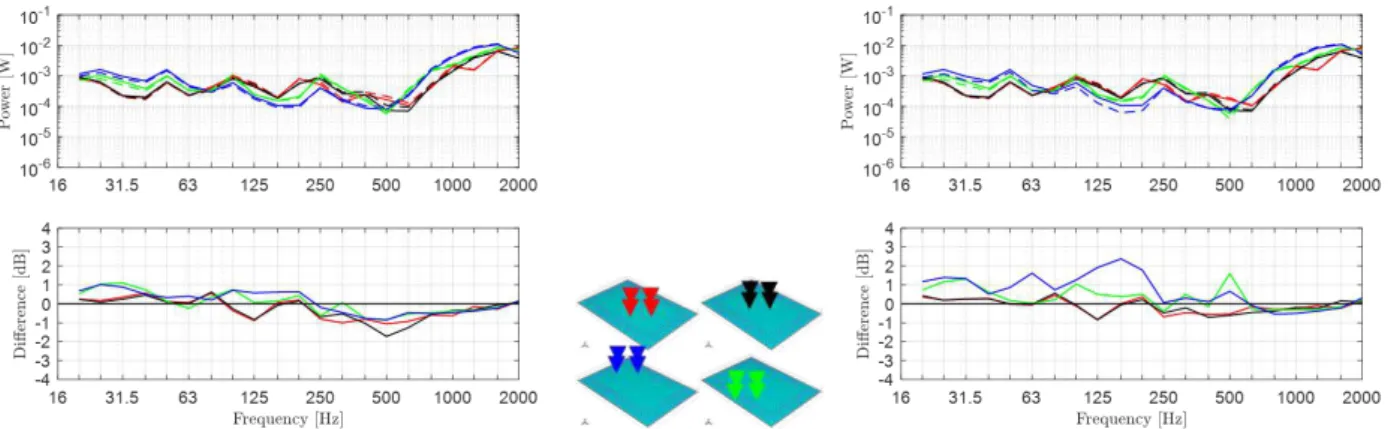
Figure 7: White goods aligned parallel to plate edges assuming zero-phase forces: (Left) Direct injected power – solid lines, reception plate power with all elements – dashed lines (upper graph); direct injected power minus reception plate power (lower graph). (Right) Contour plots of velocity levels over the plate
sur-face at 500 Hz.
Figure 8: White goods aligned parallel to plate edges assuming zero-phase forces: Direct injected power – solid lines, reception plate power – dashed lines (upper graph); direct injected power minus reception plate power (lower graph). (Left) Excluding elements within 0.1 m radius of each contact. (Right) Excluding all
Figure 9: White goods aligned at an angle to plate edges assuming zero-phase forces: Direct injected power – solid lines, reception plate power – dashed lines (upper graph); direct injected power minus reception plate power (lower graph). (Left) All elements. (Right) Excluding all elements underneath the machine and up to
0.1 m away from all four contacts.
Figure 10: White goods aligned parallel to plate edges assuming random-phase forces: Direct injected power – solid lines, reception plate power – dashed lines (upper graph); direct injected power minus recep-tion plate power (lower graph). (Left) All elements. (Right) Excluding all elements underneath the
ma-chine and up to 0.1 m away from all four contacts.
4.2 Assessment of sampling strategy
The reception plate power is now obtained using the empirical weighting based on the average mean-square velocity at four corners and the central zone (777 points), excluding elements under-neath the source and up to 0.1 m away from all four contacts. Figure 11 shows reasonable agreement (± 4 dB) for zero-phase forces in the central zone. For sources located close to corners/edges the reception plate power still tends to be underestimated. Hence, it is preferable to position sources in the central zone when using the sampling strategy. For random-phase forces there is reasonable agree-ment (± 3 dB) in the central zone which increases to ± 4 dB for sources near corners/edges.
Figure 11: White goods: Direct injected power minus reception plate power when using weighting factor X to determine reception plate power. (Left) Zero-phase forces and parallel to plate edges. (Middle) Zero-phase
ICSV24, London, 23-27 July 2017
8 ICSV24, London, 23-27 July 2017
5. Conclusions
This paper concerns the numerical determination of the reception plate power of single- and mul-tiple-contact sources using a validated FEM model for a concrete reception plate. For single-contact sources there is close agreement between the direct injected and reception plate power when the spa-tial-average velocity is obtained from all elements over the entire plate. The comparison between numerical and experimental data have confirmed the good quality of the FEM model. In order to minimise the number of measurement positions the model was used to assess a sampling strategy with an empirical weighting based on measuring the average velocity from the four plate corners and the central zone of the plate. For multiple-contact sources such as white goods it was shown that in the absence of sufficiently detailed knowledge of the phase difference between the forces at the con-tact points, the source should be placed in the central zone of the plate and not near corners/edges of the plate.
For future research, the sampling strategy will be refined in case of the central zone positions by sampling elements from the FEM model. Furthermore, the effects of multiple in-line contact and framed sources will be investigated.
REFERENCES
1 Späh, M. M. and Gibbs, B. M. Reception plate method for characterisation of structure-borne sound sources in buildings: Assumptions and application, Applied Acoustics, 70, 361–368, (2009).
2 EN 15657-1. Acoustic properties of building elements and of buildings – Laboratory measurement of airborne and structure borne sound from building equipment – Part 1: Simplified cases where the equip-ment mobilities are much higher than the receiver mobilities, taking whirlpool baths as an example, (2009).
3 Hopkins, C. and Robinson, M. Using transient and steady-state SEA to assess potential errors in the meas-urement of structure-sound power input from machinery on coupled reception plates, Applied Acoustics, 99, 35–41, (2014).
4 Höller, C. and Gibbs, B. M. A substitution method for structure-borne source power in heavyweight con-structions, Proceedings of the 19th International Congress on Sound and Vibrations, Vilnius, Lithuania, 8–12 July, (2012).
5 EN 12354-5. Building acoustics – Estimation of acoustic performance of building from the performance of elements – Part 5: Sounds levels due to the service equipment, (2009).
6 Hopkins, C. Sound insulation, Butterworth-Heinemann, ISBN 978-0-7506-6526-1, (2007).
7 Reinhold, S., Hopkins, C. and Zeitler, B. Finite element simulation of a laboratory reception plate for structure-borne sound power measurements, Proceedings of the 45th International Congress and Exposi-tion of Noise Control Engineering, Hamburg, Germany, 21–24 August, (2016).
8 Reinhold, S., Hopkins, C. and Zeitler, B. Numerical simulation of a laboratory reception plate using finite elements, Proceedings of the German Annual Conference on Acoustics (DAGA), Kiel, Germany, 6–9 March, (2017).
9 Ji, L., Mace, B. R. and Pinnington, R. J. A power mode approach to estimating vibrational power trans-mitted by multiple sources, Journal of Sound and Vibration, 265, 387–399, (2003).
10 Jianxin, S., Moorhouse, A. T. and Gibbs, B. M. Towards a practical characterisation for structure-borne sound sources based on mobility techniques, Journal of Sound and Vibration, 185(4), 737–741, (1995). 11 Hopkins, C. and Turner, P. Field measurements of airborne sound insulation between rooms with
non-diffuse sound fields at low frequencies, Applied Acoustics, 66, 1339–1382, (2005).
View publication stats View publication stats