HAL Id: hal-02529712
https://hal.inrae.fr/hal-02529712
Submitted on 2 Apr 2020HAL is a multi-disciplinary open access archive for the deposit and dissemination of sci-entific research documents, whether they are pub-lished or not. The documents may come from teaching and research institutions in France or abroad, or from public or private research centers.
L’archive ouverte pluridisciplinaire HAL, est destinée au dépôt et à la diffusion de documents scientifiques de niveau recherche, publiés ou non, émanant des établissements d’enseignement et de recherche français ou étrangers, des laboratoires publics ou privés.
Multipartite Virus in Host Plant Cells
Marie-Stéphanie Vernerey, Elodie Pirolles, Stéphane Blanc, Anne Sicard
To cite this version:
Marie-Stéphanie Vernerey, Elodie Pirolles, Stéphane Blanc, Anne Sicard. Localizing Genome Segments and Protein Products of a Multipartite Virus in Host Plant Cells. Bio-protocol , Bio-protocol LCC, 2019, 9 (23), pp.1-14. �10.21769/BioProtoc.3443�. �hal-02529712�
1 Localizing Genome Segments and Protein Products of a Multipartite Virus in Host Plant Cells
Marie-Stephanie Vernerey*, Elodie Pirolles, Stephane Blanc and Anne Sicard BGPI, INRA, CIRAD, Montpellier SupAgro, Université de Montpellier, Montpellier, France *For correspondence: marie-stephanie.vernerey@inra.fr
[Abstract] A founding paradigm in virology is that the spatial unit of the viral replication cycle is an individual cell. This concept applied to multipartite viruses–which have a genome composed of two or more nucleic acid segments, each individually encapsulated–implies that all segments constituting a viral genome need to coinfect the same host cell for replication to occur. Would this requirement be verified, it would constitute a major cost for extreme cases of multipartition such as the Faba bean
necrotic stunt virus (FBNSV, nanovirus) whose genome is composed of eight complementary segments,
each encoding a single gene (Grigoras et al., 2009). To address this question, we followed the distribution of the FBNSV genome segments by fluorescence in situ hybridization combined to immunolocalization of the replication-controlling viral protein within the cells of the host plant: Vicia Faba. A rapid and efficient protocol to localize viral transcripts in plant and insect hosts has been developed earlier (Ghanim et al., 2009). We here improve this method by using random-primed labeled probes and apply it to the detection and quantification of the individual segments composing the FBNSV genome. Moreover, we combine this technique with immunolocalization so that both viral segments and proteins can be visualized within the same samples.
Keywords: In situ hybridization (ISH), Immunolocalization, Plant, Virus, Multipartite virus, FBNSV, Fluorescence microscopy, Nanovirus, Vicia Faba
[Background] Fluorescence in situ hybridization (FISH) and immunolocalization are essential techniques to localize specific nucleic acids and proteins respectively. These techniques have been successfully used either separately or in combination in a number of studies. Generally, in situ hybridization protocols include numerous steps, resulting in a cumbersome and time-consuming technique. The protocol developed by Ghanim et al. has considerably simplified this technique (Ghanim
et al., 2009). When applied to our pathosystem (FBNSV, Vicia faba), however, this protocol yielded poor
and/or non-specific signals. Although FBNSV is a circular single-stranded DNA phytovirus like the
Tomato yellow leaf curl virus (TYLCV) on which Ghanim and coauthors tested their protocol, the FBNSV
genome is composed of eight molecules of around 1 kb each, sharing common regions which sometimes correspond to the almost quasi-totality of their non-coding regions (Grigoras et al., 2010). We thus sought to improve this protocol for the detection of individual FBNSV genomic segments by using, instead of fluorescent oligonucleotides, random primed probes generally used for in situ localization experiments on chromosomes. We were able to couple it with immunolocalization for visualization of nucleic acid and proteins i.e., covisualization of genetic information and translation products within the same cells.
By combining these two methods, we showed (i) that the FBNSV genomic segments do not colocalize in individual host cells, and (ii) that the viral protein involved in the replication of all segments is often found within cells lacking the segment encoding it; suggesting that viral expression products are able to move away from the cells where they are produced. We believe that our methodology could easily be adapted to locate and quantify (single-stranded) nucleic acids in different tissues with great specificity. For instance, this protocol has also been successfully used to locate the FBNSV segments within gut cells of its aphid vector and TYLCV genome within host plants.
Materials and Reagents
Note: Some of the reagents and materials described below are optional depending on the targeted sequence and tissue (see Procedure below for further details).
1. Microscopy slides (Dutscher, catalog number: 068763) 2. Coverslips (Dutscher, catalog number: 100031)
3. Nylon membrane 0.45 µm pore size (Sigma, catalog number: GERPN203T) 4. Whatman paper
5. 24-well plate (Dutscher, catalog number: 353226) 6. Microcentrifuge tube (Dutscher, catalog number: 033297)
7. Embryo dish 30 mm (Delta microscopies, Ems, catalog number: 70543-30) 8. Wizard SV Gel PCR Clean-Up System (Promega, catalog number: A9282) 9. GoTag DNA polymerase kit (Promega, catalog number: M3001)
10. Paraformaldehyde (Delta microscopies, Ems, catalog number: 15713), store at room temperature
11. PBS buffer 10x pH 7.4 (Dutscher, biosolve, catalog number: 91549), store at room temperature 12. Tween 20 (Merck, Sigma-Aldrich, catalog number: P1379), store at room temperature
13. Glycine (Merck, Sigma-Aldrich, catalog number: G8898), store at room temperature 14. Ethanol (AnalyticLab, Honeywell, catalog number: 32221), store at room temperature 15. Chloroform (Merck, Sigma-Aldrich, catalog number: 32211), store at room temperature 16. Acetic acid (Merck, Sigma-Aldrich, catalog number: 33209), store at room temperature
17. Low melting agarose (Ozyme, Lonza, catalog number: LON50080), store at room temperature 18. RNase (Merck, Sigma-Aldrich, catalog number: R6513), store at -20 °C
19. Tris (Carl roth, Pufferan, catalog number: AE15.3), store at room temperature
20. NaCl 5 M (Merck, Sigma-Aldrich, catalog number: S3014), store at room temperature
21. Sodium dodecyl sulfate (SDS) 10% (Dutscher, Biosolve, catalog number: 19812323), store at room temperature
22. Deionized Formamide (Eurobio, catalog number: GHYFOR01-01), aliquot and store at -20 °C after opening
23. BioPrime DNA labeling system (Fisher Scientific, Invitrogen, catalog number: 18094-011), store at -20 °C
3 24. Chromatide Alexa Fluor 488-5-dUTP (Fisher Scientific, Molecular probes, catalog number:
10173952), store at -20 °C
25. Chromatide Alexa Fluor 568-5-dUTP (Fisher Scientific, Molecular probes, catalog number: 10413222), store at -20 °C
26. Herring sperm DNA (Sigma, catalog number: D3159), store at -20 °C 27. Bovine serum albumin (Carl Roth, catalog number: 8076.4), store at 4 °C
28. Goat anti rabbit Alexa Fluor 488 IgG (H+L) (Fisher Scientific, Invitrogen, catalog number: 10082502), store in 50 % glycerol at -20 °C
29. Goat anti rabbit Alexa Fluor 594 IgG Conjugate (Fisher Scientific, Invitrogen, catalog number: 10266352), store in 50 % glycerol at -20 °C
30. Vectashield mounting medium with DAPI (Eurobio, Vector, catalog number: H-1200), store at 4 °C
31. Carnoy 6:3:1 (Recipe 1)
32. RNase solution 100 µg/ml (Recipe 2)
33. dNTP fluo mix for the Bioprime DNA labeling (Recipe 3) 34. Hybridisation buffer (Hb Buffer) (Recipe 4)
35. 1 M Tris-HCl, pH 8 (Recipe 5) 36. 5 M NaCl (Recipe 6)
37. 0.1 M glycine in PBS 1x (Recipe 7)
38. 5% Bovine Serum Albumin (BSA) (Recipe 8) Equipment
1. Vibratome (MICROM, model HM650V) 2. Confocal microscope (ZEISS, model LSM700) 3. Phosphorimager (Typhoon FLA 9000)
4. UV light (254 nm) (UVllite, UVItec CL-E508.G) 5. 37 °C oven
6. Water bath 7. Rotator Software
1. Zeiss Efficient Navigation (ZEN) (ZEISS, version 2009)
2. Image J (National Institutes of Health, version 1.50 c, https://imagej.nih.gov/ij/download.html) 3. JMP (version 13.2.0, https://www.jmp.com/fr_fr/home.html)
Procedure
A. Samples preparation 1. Samples fixation
a. Collect samples (see the note* below for the choice of samples) in PBS 1x and add paraformaldehyde (PFA) right after sampling to obtain a solution of PFA at 4% in PBS 1x with 0.2% Tween-20**. We recommend taking at least one sample from at least 10-12 individual plants coming from three different inoculation trials. For comparison purposes, samples should be collected from plants at the same development and infection stages. Incubate under agitation overnight at 4 °C.
Notes:
i. *Choose the samples to collect carefully by thinking in which parts you are most likely
to find virus accumulations. In our case, we choose to work on petioles.
ii. **Pay attention to use a volume of fixator high enough to completely cover the fragment
collected: use at least 2/3 volume of fixator for 1/3 volume of sample.
b. On the next day, neutralize PFA with a PBS 1x solution containing 0.1 M glycine (Recipe 7). Incubate for 15 min at room temperature (RT).
Note: The volume of “PBS 1x solution containing 0.1 M glycine” should be adapted to the sample you are working with (petioles, leaves, roots…); samples must always be entirely covered by the liquid.
c. Rinse the samples for 5 min with PBS 1x. Replace PBS with a 70% ethanol solution. Samples can be stored in this solution at 4 °C for up to a month.
2. Samples sectioning
Note: Depending on the localization of the nucleic acid of interest, and on the tissue or organ analyzed, this step could be optional.
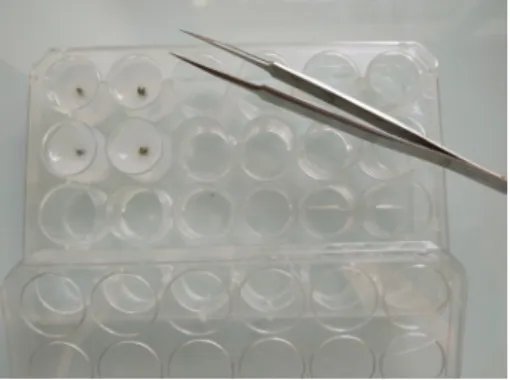
a. Embed the fixed samples in 8% low melting agarose (diluted in either distilled water or PBS 1x). Pour the liquid agarose in a 24-well plate, or anything else convenient for the samples, until the agarose completely covers the sample. Place the tissue fragments straight in the middle of the well and let the agarose solidify at 4 °C for at least 4 h (Figure 1).
5 Figure 1. Embedded samples. Vicia faba petioles embedded in 8% low melting agarose in a 24-well plate before sectioning.
b. Proceed to the sectioning with a vibratome. For instance, the following parameters were used to section Vicia faba petioles using the MICROM vibratome:
thickness: 100 µm frequency: 100 Hertz program: 50
amplitude: 0.6 mm
method: one cut after another speed: 23 mm/s
All of the above parameters–including the percentage of agarose–should be adjusted according to the hardness of the sample. For example, in the case of a softer sample, decrease the percentage of agarose. Based on our experience, 8% is around the limit of agarose solubility.
3. Samples discoloration
For plant samples, bleach them by incubating them under gentle agitation at RT in a Carnoy 6:3:1 solution (Recipe 1). As soon as the samples have totally lost their green color (step unnecessary for tissues such as roots explants), stop the reaction by replacing the Carnoy solution with a PBS 1x solution. For instance, bleaching of Vicia faba petiole’s sections takes an hour (Figure 2).
Figure 2. Effect of Carnoy 6:3:1 discoloration on sectioned samples. Vicia faba sectioned petioles before (left) and after (right) discoloration using the Carnoy solution.
4. RNase or DNase treatment
Depending on the nature of the genetic material you want to localize, you can proceed to an RNase or DNase treatment. Since FBNSV is a single-stranded DNA virus and because we were
interested in localizing its genomic segments only, we RNase-treated our samples.
a. Immerge the samples in 500 µl of a 100 µg/ml RNase solution (Recipe 2) for 45 min at 37 °C. b. Rinse 1 time for 5 min in PBS 1x.
B. Probes preparation
DNA amplicons (Table 1) corresponding to the coding regions of each genomic segments were amplified by PCR using the GoTaq Polymerase kit (Promega) and the conditions summarized in Table 2. PCR products were then run on a 1% agarose gel and gel purified using the Wizard SV Gel and PCR Clean-Up System (Promega). These amplicons were then used as templates to produce segment-specific probes. DNA labeling was performed using the Bioprime DNA labeling Kit of Invitrogen. Two modifications were made to the kit protocol based on the recommendations of the Plant molecular cytogenetic platform of Rennes (INRA) and of the Cytogenetic and the imaging center of UMR AGAP, Montpellier CIRAD (Personal communications). First, for direct labeling, Biotine molecules were replaced with Alexa Fluor enabling a direct labeling. Second, the incubation time was increased to allow enhanced labeling.
Below is the kit labeling procedure with the two changes made (in bold font). All of the reagents are included in the kit–except for the dNTP Fluo mix (Recipe 3).
1. Dissolve 25 to 500 ng (we used 200 ng of PCR product) of DNA in 5-20 μl of dilute buffer in a microcentrifuge tube. On ice, add 20 μl of 2.5x Random Primers Solution. Denature by heating for 10 min in a boiling water bath. Immediately cool on ice for 15 min.
2. On ice, add (to the DNA and primers mixture prepared in Step B1):
a. 10 μl of dNTP Fluo mix (instead of the 10x Biotine dNTP mixture, see Recipe 3 for preparation).
b. And distilled Water to a total volume of 49 μl. 3. Mix briefly by vortexing or pipetting.
4. Add 1 μl of Klenow Fragment. Mix gently but thoroughly. Centrifuge at maximum speed (no specific recommendation is included in the manufacturer notice, when we proceed to it, we do it at maximum speed of a bench centrifuge) for 15-30 s.
5. Incubate at 37 °C for at least 12 h. 6. Add 5 μl of Stop Buffer and mix.
The probes can be stored at -20 °C for months. The probes chosen must be specific of the DNA or RNA sequence you want to localize. The specificity of the probe can be checked following the procedure detailed in the next section.
7 Table 1. Primers used to prepare segment-specific fluorescent probes (from Sicard et al., 2019)
Name Primer sequence Size Segment
NV C-297 F ATGGGTCTGAAATATTTCTC
510nt C
NV C-806 R TTAATTAATTACAATCTCC
M ORF For2 GCTGCGTATCAAGACGAC
268nt M
M ORF Rev2 TTCTAGCATCCCAATTCC
N ORF For TGGCAGATTGGTTTTCTAGT
450nt N N ORF Rev TTCTGAGTGAATGTACAATAAACATTT
R ORF For ACATTAAATAATCCTCTCTCTCCTA
810nt R
R ORF Rev CCTATCATCACTAAACATGCC
S ORF For AAATGGTGAGCAATTGGAA
350nt S S ORF Rev GCCTATGATAGTAATCATATCTTGACA
U1 ORF For TTGGTCGATTATTTGTTGGTT
455nt U1 U1 ORF Rev AATATCTCATTAGCATTAATTACATTTGAA
U2 ORF For TTATGGATGCCGGCTTT
361nt U2 U2 ORF Rev CATGAAGTATTAGAATAACGAACTTGA
U4 ORF For AGCAGGTTATGGAATGTAGG
313nt U4
U4 ORF Rev ATAGATTCCCACAATCGCT
R1 For ACATTAAATAATCCTCTCTCTCCTA 282nt R R1 Rev CTCTAAGCGTACTTGCAG R2 For GAAGAAAGCTATTGCTACTTGG 406nt R2 Rev CCTATCATCACTAAACATGCC Nmys2-Red TTACATCATAAGTGCTGTAAGTATAATAAGGCACAACTAA 40 nt N Nmys7-Green TTACATCATATTATACCAACTGTTGCTATCCCACAACTAA 40 nt N Smys1-Red GTTTTTCATTAACTTCTCACTATAATAACTGCCCACAGTG 40 nt S Smys8-Green GTTTTTCATTAATATAAGTCATAATTCCTGCTCCACAGTG 40 nt S
Table 2. PCR conditions followed to prepare the segment-specific fluorescent probes. Note that these conditions need to be adjusted according to the polymerase used, the primers and the size of the amplicons.
Reagents Procedure
Components Final concentrations Step Temperature Time GoTaq reaction buffer 1x Initial Denaturation 95 °C 2 min GoTaq DNA polymerase 0.5 unit 40 Cycles 95 °C 45 s
dNTP 0.2 mM each 59 °C 45 s
Primers Forward + Reverse 0.5 μM 72 °C 45 s
Template DNA Final Extension 72 °C 5 min
C. Specificity of the probe
1. First denature samples (mandatory when starting with double-stranded nucleic acid) by incubating them at 95 °C (or in boiling water) for 10 min immediately followed by placing them on ice.
2. Each of the denatured samples is pipetted on a nylon membrane and allowed to dry. The edges and names of each drop are penciled directly on the membrane (Figure 3).
The samples may include DNA extracted from the tissue of interest containing or not the targeted nucleic acid as well as some purified DNA containing (or not) the targeted nucleic acid (e.g., a plasmid containing the gene of interest). For instance, we spotted 1 μg of each of the eight plasmids, each containing one of the eight FBNSV segments, separately on the membrane. 1 μl of DNA extract from FBNSV infected and uninfected plants were also added to the membrane. Each sample should contain at least 45 ng of the target in order to be detected. 3. Fix the DNA onto the membrane using ultraviolets for a few seconds (UV linker, UVllite, UVItec). 4. Pre-hybridize the nylon membranes for 2 h at 37 °C on a rotator using Hb buffer (Recipe 4)
containing 1% (w/v) of BSA and 2 mg of denatured herring sperm DNA.
5. Add 10 μl of the denatured probe previously obtained (Procedure B). Denature samples by heating for 10 min at 95 °C (or in boiling water) followed by an immediate cooling on ice for 15 min.
6. Incubate for at least 2 h at 37 °C on a rotator. This incubation step can also be done overnight. 7. Rinse the membranes three times using hybridization buffer, for 5 min each, and once with PBS
1x for 5 min. Do the rinse steps at room temperature. 8. Dry the membranes with Whatman paper.
9. Results can be visualized using a phosphorimager.
Figure 3. Results obtained using the R1 probe (upper picture) and the R2 probe (lower picture) after revelation with the phosphorimager. 1 μg of each purified plasmid DNA containing one of the eight FBNSV genomic segments (C, M, N, R, S, U1, U2, U4) were spotted on a nylon membrane. 200 ng of PCR purified product corresponding to two different regions of the segment R (R1 and R2) were also spotted on the membrane. Finally, 1 μl of DNA extracted from a healthy plant (Vfs) and 1 μl of DNA extracted from an FBNSV-infected plant (Vfi) were used. The upper and lower membranes were incubated with the R1 and R2 probes respectively. The results obtained confirm the high specificity of each probe. Note that no signal was obtained
9 here for the FBNSV-infected plant sample when using either of the two R probes due to the very low concentration of the segment R in the amount of plant DNA used.
D. In situ hybridization
1. Rinse the samples obtained in Procedure A for 5 min, 3 times with Hybridisation Buffer (Hb buffer, Recipe 4).
2. Dilute 20 µl of labeled DNA probe (with Alexa Fluor 488 or/and Alexa Fluor 568) in Hb buffer in a total volume of 600 µl. Adjust the volume to the amount of material. For example, we used 300 µl of this solution in an embryo dish of 30 mm.
3. Since the labeled probes obtained by Random priming (Procedure B) are double-stranded, denature the solution for 10 min at 95 °C or in boiling water and cool immediately for 15 min on ice. Incubate the samples with the probe solution overnight at 37 °C in a dark place (e.g., incubator). As a general rule, since the fluorochromes are light-sensitive, avoid prolonged exposure to light.
4. Recover the probe solution. In our hands, this solution could be used up to 4 times with no significant decrease of the intensity of the signal. Store the solution at -20 °C in a tube protected from light.
5. Rinse the samples for 5 min 3 times in Hb Buffer (Recipe 4). 6. Rinse 2 times more with PBS 1x for 5 min.
Note: If no other experiment is foreseen, prepare slides for microscopy observations (Procedure F).
E. Immunolocalization
Immunolocalization protocol can immediately follow in situ hybridization (Figure 4).
1. Incubate the samples in BSA 5% in PBS 1x solution (Recipe 8) for 1.5 h at room temperature (RT) to block aspecific sites.
2. Split samples into two batches. Incubate one batch with a fresh PBS-BSA 5% solution containing the primary antibody (diluted at the ad hoc concentration). For the second batch, simply replace the PBS-BSA 5 % with a fresh solution (this represents the negative control). Incubate overnight at 4 °C.
Note: Regarding the immunolocalization experiment, you can first try using the primary antibody at a concentration 10x higher than the one used in Western blots. Then, adjust accordingly.
3. Rinse all samples 3 times each for 10 min in PBS 1x + 0.05% Tween-20.
4. Replace the solution by a PBS-BSA 5% solution containing the secondary antibody–diluted at the required concentration (see manufacturer instruction). In our experiments, we used a goat anti-rabbit IgG Conjugate Alexa Fluor 488 at a concentration of 2 µg/ml and a goat anti-rabbit IgG Conjugate Alexa Fluor 594 at 5 µg/ml. Incubate for 1 h at 37 °C.
Figure 4. Confocal microscopy pictures of double labeling (FISH/Immuno) experiment obtained following our protocol. Cross sections of infected faba bean petioles stained with DAPI (in blue) and hybridized with the S-A488 probe in green and M-Rep protein antibody in red. A. Green channel (S probe = part of the segment encoding the capsid protein) merged with the blue channel (DAPI). B. Red channel (M-Rep protein localization = immunolabeling of the movement protein) merged with the blue channel (DAPI). C. Merged image of the three channels. D. Merged picture of the three channels of the control sample (petiole of non-infected faba bean plant) taken in the same conditions as Figure 4C; only autofluorescence of the tissue and blue signal of the DAPI nuclei staining could be observed.
F. Preparation of microscopy slides
For microscopy observations, mount samples in Vectashield with DAPI (if interested in localizing cell nuclei) or any other mounting media (e.g., glycerol…, Figure 5).
Figure 5. Microscopy slide ready to be observed and mounted as described in the note below. A Vaseline chamber was made prior to adding the mounting medium and the cross section to avoid movement of the preparation during long image captures.
11
Note: For microscopy slides, depending on the thickness of your samples, you can use Vaseline to make a kind of “incubation chamber” on the slide before adding the mounting media and the coverslip.
G. Microscopy observations
All observations were made using an LSM700 Confocal Microscope (ZEISS) with the ZEN Software. Parameters were adjusted to obtain sufficient resolution and fluorescence intensity signal recovery-in a chosen series of recovery-infected plant exhibitrecovery-ing a high recovery-intensity of fluorescence-without saturation points. Once these parameters were set, all of the images were acquired using the same parameters so that they could easily be compared with one another.
In our case, images were taken with a 40x water immersion objective with a resolution of at least 512 x 512 and with a pinhole aperture of 1 Airy Unit so as to work in confocal mode.
We set on a configuration with 3 sequential tracks, one for each fluorochrome used. 1. Excitation parameters were as followed:
laser 405 nm for DAPI
laser 488 nm for Alexa Fluor 488 laser 555 nm for Alexa Fluor 568
Fluorescence emission was collected on the photomultiplicator 1 and the variable secondary dichroic beam splitter was set so as to recover fluorescence up to:
2. 490 nm for DAPI 3. 535 nm for Alexa 488 4. 615 nm for Alexa 568 Data analysis
Analyses were run using maximum intensity projections so that all the fluorescence emitted in the whole nuclei was accounted for. These microscopic images were analyzed using Image J software. 1. First of all, in order to minimize the signal caused by the autofluorescence of the tissues–either natural or induced by fixation, grey level intensities coming from the green and red tracks were decreased independently on each photo until no green or red fluorescence could be visually detected in tissues where the FBNSV is known to be absent (i.e., in xylem and mesophyll; the FBNSV being a phloem restricted virus). This computer process was done in the exact same way for all pictures and applied equally to the whole surface of the image (Figure 6).
Note: The aim of this step was to simply distinguish infected cells from non-infected ones with a high level of background autofluorescence. As a consequence, only cells in which green or red fluorescence levels exceeded the level of background fluorescence were considered for further analysis. As we were mainly interested in the cells in which our ssDNA virus can replicate, we focused our analyses on phloem nucleated cells; nuclei stained using DAPI.
Figure 6. Confocal microscopy pictures obtained following our protocol. Cross sections of infected faba bean petioles stained with DAPI (in blue) and hybridized with the R-A488 probe in green and N-A568 probe in red. A. Green channel (R probe = part of the segment encoding the replication protein) merged with the blue channel (DAPI). B. Red channel (N probe = part of the segment encoding the nuclear shuttle protein) merged with the blue channel (DAPI). C. Merged image of the three channels. D. Merged picture of the three channels of the control sample (petiole of non-infected faba bean plant) taken in the same conditions as picture C; only autofluorescence of the tissue and blue signal of the DAPI nuclei staining could be observed. 2. On the images, we manually delineated the DAPI stained area (corresponding to the nucleus in
each cell) using a cursor and quantified intensity of grey level values for each pixel using the ImageJ software. The intensity of grey level was also determined for both green and red fluorescence.
3. We then calculated the average pixel fluorescence intensity value for each nucleus and each fluorochrome. We thus obtained an average intensity value (in arbitrary fluorescence unit) for both green and red fluorescence for each selected individual cell within an infected petiole (the FBNSV replicate and accumulate in the nucleus of infected cells).
4. In order to check the reliability of our analysis, we produced two probes respectively targeting the two moieties of the same segment R: “probe-R1” and “probe-R2”, one labeled green and the other red. In such a control experiment, we could confirm that absolutely all nuclei with a significant red signal also had a significant green signal. When quantifying these green and red fluorescence, we observed a highly significant correlation, logically showing that the accumulation of one part of a genome segment within a cell is clearly correlated to that of the other part of the same segment. Around 50 infected cells were analyzed by condition.
5. Images acquired from the same slide with different resolutions (512 x 512 and 1024 x 1024) and at different times post labeling (2 weeks between the two-time points) were analyzed and led to the same results.
13 All details of the data analysis can be found in the original research article (Sicard et al., 2019). Notes
1. Always use both infected tissues and uninfected tissues as controls. 2. A minimum of 3 repetitions per condition should be run.
Recipes 1. Carnoy 6:3:1 6 ml chloroform 3 ml ethanol 1 ml acetic acid 2. 100 µg/ml RNase solution
Dilute your RNase solution with PBS 1x so as to obtain a 100 µg/ml solution 3. dNTP fluo mix for the Bioprime DNA labeling
Dilute dNTP solutions in H2O so as to obtain 1 mM solution of dATP, dGTP, dCTP and 0.5 mM
of dTTP and dUTP-Alexa For example, mix: 5 µl of 10 mM dATP 5 µl of 10 mM dGTP 5 µl of 10 mM dCTP 2.5 µl of 10 mM dTTP
25 µl of 1 mM dUTP-Alexa (Alexa 488, 568 or others depending on the microscope equipment) 7.5 µl of H2O
4. Hb Buffer (Ghanim et al., 2009) 20 mM Tris HCl, pH 8 0.9 M NaCl 0.01% (w/v) SDS 30% (v/v) deionized formamide pH = 8 For a volume of 100 ml: 2 ml Tris HCl pH8 1 M 18 ml NaCl 5 M 100 µl SDS 10% 30 ml deionized formamide 50 ml H2O 5. 1 M Tris-HCl, pH 8 121.1 g of Tris base
a. Complete with water to 800 ml
b. Adjust to pH 8 by adding concentrated HCl (around 42 ml) c. Adjust the volume of the solution to 1 L with H2O
6. 5 M NaCl 292.2 g NaCl
Complete with water to 1 L 7. 0.1 M glycine in PBS 1x
Dissolve 7.5 g of glycine in PBS 1x to a final volume of 1 L 8. Bovine Serum Albumin (BSA) 5%
Dissolve 5 g of BSA in 10 ml of PBS 1x Acknowledgments
We are thankful to the PHIV platform (CIRAD, Montpellier, France) for sharing their immunolocalization protocol.
Competing interests
No competing interests to declare. References
1. Ghanim, M., Brumin, M. and Popovski, S. (2009). A simple, rapid and inexpensive method for localization of Tomato yellow leaf curl virus and Potato leafroll virus in plant and insect vectors. J Virol Methods 159(2): 311-314.
2. Grigoras, I., Timchenko, T., Katul, L., Grande-Perez, A., Vetten, H. J. and Gronenborn, B. (2009).
Reconstitution of authentic nanovirus from multiple cloned DNAs. J Virol 83(20): 10778-10787. 3. Grigoras, I., Timchenko, T., Grande-Perez, A., Katul, L., Vetten, H. J. and Gronenborn, B. (2010).
High variability and rapid evolution of a nanovirus. J Virol 84(18): 9105-9117.
4. Sicard, A., Pirolles, E., Gallet, R., Vernerey, M. S., Yvon, M., Urbino, C., Peterschmitt, M., Gutierrez, S., Michalakis, Y. and Blanc, S. (2019). A multicellular way of life for a multipartite virus. Elife 8: e43599.