HAL Id: hal-01212170
https://hal.inria.fr/hal-01212170
Submitted on 6 Oct 2015HAL is a multi-disciplinary open access archive for the deposit and dissemination of sci-entific research documents, whether they are pub-lished or not. The documents may come from
L’archive ouverte pluridisciplinaire HAL, est destinée au dépôt et à la diffusion de documents scientifiques de niveau recherche, publiés ou non, émanant des établissements d’enseignement et de
A viewer tool for multi-active object
Pavlo Khvorostov
To cite this version:
Pavlo Khvorostov. A viewer tool for multi-active object. Computation and Language [cs.CL]. 2015. �hal-01212170�
University of Nice Sophia Antipolis
Master IFI - Ubinet track
Master thesis
A viewer tool for multi-active object
Student
Pavlo Khvorostov
Internship Supervisors
Ludovic Henrio
Justine Rochas
Academic Supervisor
Guillame Urvoy-Keller
Research Lab
INRIA-I3S-CNRS-UNS
Research Project team
Scale
Abstract
Active object is a concurrency design pattern, which is based on allocating a single thread and control for each independent activity. However today in the era of multicore machines using one thread is a great disadvantage. Using a single thread may also cause deadlocks during the execution. That is why solution called multiactive object was presented and implemented in a java library called ProActive. The core idea of this solution is to make these activities multithreaded. In this work I will present a tool, which demonstrates the behavior of the multiactive objects based on the logs made by the library. The main purpose of the tool is to help users to debug their applications. Several use cases will be presented revealing main features of the tool and the way user should use them.
Table of Contents
Chapter 1. Introduction ... 3
1.1 Motivations ... 3
1.2 Organization of the report ... 4
Chapter 2. Background ... 5 2.1 Active object ... 5 2.2 ProActive ... 6 2.3 Master-‐Slave example ... 7 2.4 Multi-‐active object ... 8 2.6 Objectives ... 12 Chapter 3. Implementation ... 13 3.1 General Workflow ... 13 3.1.1 Logging ... 14
3.1.2 Parsing of the logs ... 15
3.2 Functionality of the viewer tool ... 16
3.3 Most common use-‐cases ... 21
3.3.1 Deadlock ... 21
3.3.2 Race condition ... 22
3.4 Performance evaluation ... 23
Chapter 4. Related works ... 25
4.1 IC2D ... 25 4.2 XPVM ... 26 4.3 Summary ... 26 Chapter 5. Conclusion ... 27 5.1 Future work ... 27 5.1.1 Optimization ... 28
5.1.2 Real time support ... 28
Chapter 6. References ... 29
Chapter 1. Introduction
1.1 Motivations
Writing distributed application is a very difficult task. Developer of the distributed application has to think in a more complex way than a usual developer with challenges like localization handling, communication between execution nodes, concurrency issues, timing, etc. In the past few years different solutions were proposed to ease the way of developing distributed applications by providing special middleware frameworks. These frameworks have a purpose to hide low-level features like remoteness of the nodes and to help developer to write distributed applications at a higher programming level – with object oriented languages.
One of the models, which simplify the way developer creates distributed applications is called active object model. It is object-oriented based model in which each active object is an independent entity and has its own single execution thread. Active object communicate through asynchronous calls and the model hides remoteness of the active object. Communication implementation and distribution are hidden inside the active object making it easier for the user to write distributed applications.
Multi-active object is an extension built on the top of the active object by making an active object multithreaded. This solution makes it easier for the developer to support parallelism inside active object. Developer builds the rules for the multi-active object by defining which methods can be executed in parallel. This approach is much handier than locks handling and keeps it very simple for developer to develop distributed applications. Active object model, its extension – multi-active object and other extensions have been developed in the Java framework called ProActive. Later we will focus on the way these models are implemented inside ProActive.
As we said before these models ease the way to develop and configure the distributed application however we do not have a nice way for debugging this kind of applications. Having a debugging tool for distributed applications would be a good hand for the developers. It will help developer to fix issues and to better understand the programing model and behavior of his program. The main goal of this internship is to build such tool. Here are the contributions made during the internship:
• Make the analysis of the multi-active object model, investigate issues happening during the execution of distributed application
• Implement logging mechanism inside ProActive, which provides all necessary information for the tool.
• Create a debugging tool, which parses the logs and visualize time based execution flow of the distributed application. The tool also allows the developer to track compatibility rules between multi-active objects and to check their correctness. The user has a rich set of configuration of the environment options as well.
• Test the tool on the most common use cases to check the correctness of the execution and to improve user experience.
1.2 Organization of the report
The report is organized in the following way. In the second chapter we will overview the background of our work, particularly we will speak about active objects and their multithreaded extension – multi-active objects and its main features implemented with annotation mechanism in ProActive. We are finishing the chapter 2 with defining the goals of our internship.
Chapter 3 starts by the detailed description of the core of the viewer tool and the logging mechanism inside ProActive. We will see how the tool works from the within. Then the main features of the tool will be presented and we will show how the user can arrange the environment inside the tool. After that, we will introduce several common use-cases aiming to show how debugging can be done. Finally at the end of the chapter we will discuss the performance of the tool, how it scales with the distributed applications.
In the Chapter 4 we will look at the related works and see how other debuggers are implemented, their features and compare them with our tool.
In the last chapter we will conclude what has been done and look at possible upgrades, which can be done in future releases.
Chapter 2. Background
In this chapter we will speak about Active Objects[1] and its implementation called ASP - language for running applications using Active Objects. After that multithreaded solution called Multi-active Objects will be presented. At the end of the chapter we will consider the implementation of multi-active objects in ProActive library based on java and define objectives of this internship.
2.1 Active object
Active object is a design pattern aiming to facilitate writing of distributed applications. It is universal concurrency pattern and does not require specific environment, it can be applied to any object oriented language. Object is called an active object if it provides a single access point for a set of objects and a single thread. Active object can be accessed from other objects not associated with this active object through the remote method call, which is called request.
There are three main pillars holding an active object.
• Asynchronous communication between active objects through requests. • Absence of local concurrency
• Memory is not shared between active objects
Requests don’t block the calling program, instead program continues execution
Active object
Executionthread Received requests Execution queue Passive objects
Figure 1. Active object
model
class AO1{
m1(){
ao2.m2();
}
m3(){}
}
class AO2{
m2(){
ao1.m3();
}
}
Figure 2. Active object deadlock example when calling m1
needed. Future object can be sent to other remote entities in most of the active object languages, these kinds of futures are called first-class future.
When request arrives to the active object it is put to the request queue. The model guarantees that all requests arrived to the active object are put in the queue and executed sequentially. Only one request is executed at each moment. The thread of the active object takes a request from the queue and executes it. The next request in the queue will not be executed while the previous is executing.
Due to the fact that active object uses single thread we can easily conclude that problems with local concurrency such as race condition are impossible. Race condition is a state of the system in which value of the object becomes inconsistent due to the concurrent access to the resource. For example if two methods execute write value to a variable at the same time then we cannot say for sure what value has been written to the variable. However by the same reason we can face the problem of a deadlock. Any recursive request call of the Active object causes a deadlock if the active object library does not take care of the situation. In the example from the figure 2 there are 2 active objects classes. AO1 with methods m1() and m3() and AO2 with method m2(). For example we have an instance of each class and make a call on the method m1 it calls m2, which calls m3 and this is where deadlock appear as the thread of the active object AO1 already busy executing method m1.
Each active object has its own set of local objects, which cannot be accessed by the other active objects. And each local object can only be accessed by one active object. Local objects of active object can be transmitted to other active objects through requests, but then they just receive the copy of the original object.
Active object model provides a simple and fast way to write distributed applications without caring about locks and concurrency. But as we saw before mono-threaded system may easily cause a deadlock. Another disadvantage of the active object is that it doesn’t use the advantages of the multithreaded processors, memory is not shared between active objects, i.e. memory assigned to active object can only be accessed by only one thread at a time and can be not efficient.
Asynchronous Sequential Processes (ASP) is a formalization language, which follows the definition of the active object we gave before: memory is not shared between active objects, each active object has its own request queue and a single thread executing requests from the queue. Requests in the queue executed sequentially without any overlapping in the FIFO order.
2.2 ProActive
ProActive is an open source library implementing ASP in Java made by Scale team for writing distributed applications with Active Object pattern. ProActive uses ASP as formalization language and provides formal semantics of the program execution. The core element of the ProActive as it is shown on Figure 3 framework is Active Object and several extensions including multi-active objects. User that writes distributed application with ProActive does not need neither to implement special code for making remote calls, it is handled by the language and futures mechanism, nor to create locks and handle concurrency inside active object.
Figure 3. Scheme of the ProActive library
In the example on Figure 4 method bar() was called on active object a, however the program doesn’t wait for the result of function execution and moves forward. gee(v) doesn’t cause problems as gee method execution treats v as a future. Finally we cannot run method f(…) until the future v updated with the result of bar() method execution, so the application is blocked and we have to wait.
Figure 4. Example of typical futures usage. [1]
2.3 Master-‐Slave example
To illustrate the way active object works lets look at the following example. Lets suppose we have a system in which there is a single Master object – manager which coordinates the work. Master has a set of jobs to be done and a set of ‘Slaves’ objects, which will execute these jobs. All the jobs are independent thus any two of the jobs can be executed simultaneously. Each Slave has its own speed of the execution, and as soon as one of the Slaves finishes its job it asks others if they need help and then executes part of their job if the answer is ‘Yes’. Beforehand we don’t know how much time it takes to execute each of the jobs nor the speed of the Slave. As a natural solution comes the idea to divide all the jobs into the groups, each group bound to a Slave. We cannot decide wisely how to divide jobs into groups, as we don’t know the speed of the Slave and the size of each job, that is the reason we need a solution for ‘cooperation’ between the Slaves.
A a = (A) ProActive.newActive("A", params, Node1); // active object creation V v = a.bar (...); // Asynchronous call, no wait, v gets a future
o.gee (v); // No wait, even if o is a remote active object and v is still awaited ...
Figure 5. Execution cycle of Master-Slave example
On the figure 5 the scheme of the application is shown. As the first step Master assigns jobs to the Slaves, then periodically he collects information about business of the Slaves. In case one of the Slaves says he is free and another one says he is busy then busy one sends his job to the Master and the Master reassigns the job to the free Slave.
Active object model is a perfect match for the presented example, as memory and tasks on the data can be divided into several independent entities which don’t share memory between other entities, these entities need a way to communicate asynchronously and this is what active object offers.
If we look at the Master-Slave example presented before from the other perspective we will see that with a single thread in each active object we will have to wait a lot for requests to execute. For example Master checking the status of the Slave has to wait the end of the execution of the current request. This overhead causes inconvenience and need for the user to keep an eye on the execution queue. Usage of a single thread means that all the other cores of our CPU are staying idle which is not a performance we want to observe. To overcome this limitations we are going to present a multithreaded solution in the next section.
2.4 Multi-‐active object
Now we will look on the extension of active object, which is called a multi-active object. This extension allows multi-active object to be multithreaded. The main motivation standing behind multi-active object is to use advantages of modern multicore systems and also to. Smart ways [2,4,5,6,7] of scheduling implemented in other active object languages don’t change the fact that only one thread is used. To overcome this
Master
Slave
①
Job
s
①
Job
s
②
I a
m
fre
e
②
Do
y
ou
n
ee
d
he
lp
?
③
I
ne
ed
h
el
p
(JO
B)
④
Wo
rk
on
(JO
B)
Slave
limitation multi-active object uses true parallelism. Instead of presenting a new solution we can use several active objects for each execution sequence but it causes other problems like overusing of memory and making heavy remote request calls instead of making local method call and sharing parameters.
To specify which requests can be executed in parallel we have to specify the meta language which will handle multithreaded execution, decide which requests are compatible and can be executed in parallel, schedule the threads. It is still up to the user to build this rules, however as our meta language operates on the higher level so developer doesn’t need to operate with locks or synchronization blocks. Specifying rules for requests inside active object is much easier than implementing all low-level concurrency mechanisms. With the growth of the complexity of the system we see that proposed solution is even handier.
For implementing meta language we described before, java annotations mechanism[8] was used in the current implementation of the multi-active object in an extension of ProActive. Annotation is a sort of syntactic metadata, which can be added to Java source files. Annotations can be applied to classes, methods, variables and say to the JVM to treat them in the specified way. Annotations can be applied during the compilation or in the runtime. Annotations used to describe rules for multi-active applications are handled in the runtime to be able to define dynamic rules between compatible classes. A multi-active object without any annotations behaves in the same way as a simple active object which is important for the compatibility with old fashioned active object applications without multithreading.
Let’s speak more about the annotations used to describe current implementation of multi-active object. We will use the Master-Slave example presented before.
• @Group annotation. The purpose of the group annotation is to divide all the requests, into disjoint sets. Groups are later used to define the compatibility between the requests inside active object. If two groups are marked compatible it means that requests from these two groups can be executed in parallel. @DefineGroups annotation is applied to the class and consists of the list of @Group annotations defining the groups. First parameter of the group annotation is the name of the group and the second one is a Boolean field called selfCompatibility. If this value is set to true then, all the requests inside this group are compatible with all the other requests from this group and can be executed simultaneously.
Figure 6. Example of group annotation usage for Master class
From the example on Figure 6 we can see that group "assign_help" containing requests assigning jobs to the slaves and "start_action" requests starting these jobs are not self compatible. However "collect_statistics" group is self compatible as collecting statistics methods can be executed in parallel.
@DefineGroups({
@Group(name = "assign_help", selfCompatible = false), @Group(name = "start_action", selfCompatible = false), @Group(name = "collect_statistics", selfCompatible = true) })
• @MemberOf annotation. After defining the groups we need to add annotations to the methods to define to which of the groups request belongs. In the example from Figure 7 we can see how methods are assigned to the groups.
Figure 7. MemberOf example
• @Compatible annotation. And finally to complete our multi-active object we need to define compatibility rules between the groups if there are any. @DefineRules annotation is applied to the class and consists of the list of @Compatible annotations defining the compatibility. @Compatible annotation has two attributes, each of the attribute is the name of the group defined under the @Group annotation. Two groups are considered as compatible in case there is a @Compatible rule with these two groups as params. On Figure 8 we can see the definition of the compatibility rules for the Slave class. From this simple example we can deduce that “getters” group is compatible with all the other groups.
Figure 8. Definition of the compatibility rules between groups
@MemberOf("assign_work")
public void addJobs(List<Job> jobs){…}
@MemberOf("assign_work") public void addJob(Job job){…}
@MemberOf("assign_work")
public Job assignDelegatedWork(){…}
@MemberOf("help_slave")
public BooleanWrapper helpAnotherSlave(Slave slave){…}
@MemberOf("getters")
public BooleanWrapper needsHelp(){…}
@MemberOf("getters")
public List<IntWrapper> amountOfWorkLeft(){…}
@DefineRules({ @Compatible({"perform_computation", "getters"}), @Compatible({"perform_computation", "assign_work"}), @Compatible({"assign_work", "getters"}), @Compatible({"help_slave", "getters"}) })
2.5 Queuing policies
To apply compatibility rules described before we need to declare a smart way of scheduling of the requests. The solution, which is called First Compatible First Out defines the one and only scheduling rule: the request, which is waiting in the delivery queue will be executed if it is compatible with all currently executed requests and all the requests preceding it in the queue. [1]
Lets consider the example from Figure 9. It is a multi-active object with 3 groups, group2 and group3 are selfCompatible. From compatibility rules we can conclude that group2 is compatible with everyone and groups group1 and group3 are not compatible with each other. Lets suppose we have methods m1 and m2 currently executing and the queue: m3, m1, m2, … We check requests from the queue one by one until we find the requests satisfying the rule we wrote before. We can’t run m3 – it is not compatible with request m1 currently executing. We also can’t run method m1, it is true that it is compatible with m1 and m2 currently executing but it is not compatible with m3 preceding it in the queue. Finally we can execute m2, as it is compatible with every other request.
Figure 9. Example of multi-active object definition
When new request is selected as ready-to-execute it is assigned to an execution thread. To avoid creating many threads, the user can limit the number of the threads by defining @DefineThreadConfig annotation applied to the class and consists two params: threadPoolSize – the number of threads and hardLimit – Boolean value showing if threads are hard or soft limited, explained below:
@DefineGroups({
@Group(name = "group1", selfCompatible = false), @Group(name = "group2", selfCompatible = true) @Group(name = "group3", selfCompatible = true) }) @DefineRules({ @Compatible({”group1", ”group2"}) @Compatible({”group2", ”group3"}) }) class C { @MemberOf("group1") m1(){…} @MemberOf("group2”) m2(){…} @MemberOf("group3") m3(){…} }
Hard limit = true restricts the number of currently running threads by threadPoolSize value. In this case program can easily face a deadlock in case we need to create extra thread and all the other threads are in wait-by-necessity state. We cannot create a new thread as we reached our limit and all the threads wait for some other thread.
Hard limit = false means that the limit is soft which means that the number of threads executing something is restricted. If the thread is in wait-by-necessity state it is not counted as executing. If the limit is soft then we are safe from most of the deadlocks, however we are not safe from having a huge number of threads in the memory, even if just some of them are executing.
Figure 10. Queuing/scheduling of the requests[2]
On Figure 10 we can see the path which request has to pass to be executed. First of all a request arrives to the delivery queue, then by applying compatibility rules to the requests in the queue we decide which requests can be executed and those ones move to the ready queue. In case number of running threads reaches its limit, request in the ready queue is waiting until one of the running requests finishes. Otherwise it is moved directly to the scheduler, which selects or creates a thread for the request.
2.6 Objectives
The main objective of the internship is to help developers to debug their distributed applications written with active objects. To do that we are going to present a tool, which will provide flow-based view of the multi-active application on the time line. The goal is to provide the developer with a deep understanding of the flow of its concurrent and distributed application. The internship consists of following steps:
• Implement logging mechanism inside the current implementation of multi-active objects inside ProActive. We need to log the information about active objects, threads, requests and all the timestamps describing the lifecycle of the request: start/end of the
request, when the request was sent/delivered. Allow the users to deploy the logging mechanism without recompiling the whole application through technical service.
• Create the tool from scratch, which will read the logs, parse the data and collect all needed information, collect statistics and build a handy, user-friendly view. The presented view has to show different active objects separately with the threads attached to them. Requests have to be shown in the thread in which they were executed and user can demand to show the connections between the requests. The user can also track compatibility information inside active object and other statistic information concerning application he wants to debug.
• Make some use cases demonstrating the way tool can be used by the developer. The other motivation of creating these use cases is to check if the presented view is correct and our solution is scalable. Also to prove the ability of the tool to tackle the most common bugs in the concurrent application.
Chapter 3. Implementation
In this chapter we will observe our contribution in the debugging of distributed applications by presenting a viewer tool for multi-active objects, which is a mechanism for developer to debug his distributed applications. We will first look at the logging mechanism through ProActive technical service (a specific way of dynamically adding deployment requirements), then the parsing of the logs and the viewer tool itself. Technical specifications of the tool as well as functional features will be presented. At the end of the chapter we will speak about performance and scalability of the tool.
3.1 General Workflow
On Figure 11 we see a sequence of actions, which the user has to do to be able to use the presented tool. First of all he must configure logging through the configuration file called technical service. We have added a specific technical service for logging. Then he runs his ProActive application, we are not focusing on what kind of application user runs. The thing important for us is that this application will generate valid logs. In fact user may run neither active object nor multi-active object application but other kind of distributed application producing similar logs. Then user runs the tool we are presenting in this paper, specifies the path to the produced logs and by pressing “Parse logs and build execution tree” button, tool reads the logs, parse them and visualize the execution of the distributed application.
Figure 11. Execution cycle
This section contains technical information about the tool, the way logging mechanism works, then we will look how logs are read and how parsing is done.
3.1.1 Logging
Before speaking about the way logging implemented we need to speak about what a technical service is. Technical service is an abstraction materialized with a Java class, which helps developer of the active object application to specify non-functional aspects of their programs. This mechanism allows user to update some properties of the application at the runtime without recompiling the whole application. Technical service consists of two parts: xml file containing key-value pairs needed by the application and the implementation of the technical service class inside ProActive library reading this xml file.
Figure 12. Technical service xml source for logging
On figure 12 technical service for logging is specified. As we can see there are two key-value properties set inside xml file, one marking if the technical service is enabled, the other one is a destination path of the logs. Those specifications can be easily retrieved in the Java code thanks to the generic technical service design.
The tool requires 3 types of logs; each log has its own purpose and collected in its own logger.
First logger collects general information about the request: • name of the corresponding active object,
<virtualNode id='activeObjectName' capacity='1'> <technicalServices>
<class name='TechnicalServiceLoggingClass'> <property name='url_to_log_file' value='URL' /> <property name='is_enabled' value='true' /> </class>
</technicalServices> </virtualNode>
• identifier of the corresponding thread, • method name,
• sequence number of the request, • id of the sender active-object, • request start/stop timestamps
The second logging class collects information related to the lifecycle of the request. We extend the callback inside ProActive firing as something change in the status of the request. For example when the request moved/removed from the queue, or right after/before delivery of the request the callback will be fired. We need two values from this callback: timestamps about when the request was sent and delivered.
One of the challenges in the logging part is that we need a mechanism to uniquely identify request. Each active object after creating a request gives a unique sequence number to the request. However each request has its own sequence counter, so the requests executed inside one active object can have the same sequence number given by different active objects. The solution is to take a tuple of sequence number and the identifier of the calling active object and use it as identifier of the request. Both of the loggers described before log request identifier information.
The third logger collects logs just once – right after initialization of the active object. This log contains the data from the multi-active object annotations about groups, memberships of methods and compatibility connections between the groups.
So in general for each instance of active object we create 3 log files, each of them correspond to the type of logs described before. We will wee after for which purpose each category of logs is needed.
3.1.2 Parsing of the logs
After configuring technical service and running developers’ multi-active application logs are created in the specified folder. Right after running the tool and before building the result view there is a parsing stage in which logs are read and the data is transformed in the destination objects treated later by the tool. This step is likening to an in memory loading of serialized data.
Let us look in details how data model of the tool is built. Parsing of the logs stage can be figuratively divided into 2 phases.
First phase reads the data from the files and converts the information into wrapped objects. Wrapped object in our case is an object, which contains just the properties taken from the log file; these wrapped objects further will be merged into consistent data structures. Each file is read in its own thread in parallel with other files. We do not require any ordering for file reading. However, care must be taken when modifying the global data structures – synchronization, that is why all the data sets accessed by the threads which are treated in a safe way. No matter what kind of logs we read at the moment, it will be transformed into wrapped object and handled later by the next phase. Logs are read line-by-line avoiding over using of the memory. On the second phase we have to deal with wrapped objects and transform them
Figure 13. Logs parsing implementation
We take the basic information about the request from the first type of logs and create an instance of Request class. Then we feed the Request object with information about shipping/delivery of the request from the second type of the logs. We can make a match between two different wrapped requests by the global ID of the request. Besides information about request the set of arrows created. Each arrow represents dependency between a caller request and the recipient. Third type of the logs fills the information about the request compatibility inside each active object.
After the logs parsed and the data model is built we move on to build the view representing the distributed application. Technical details of how the view was built are not the focus of this paper and they will be skipped. In the next section we will speak about functional aspects of the tool, the information we selected relevant for the user. We will also have a look at the developed view demonstrating the flow of the distributed app and also how to configure the tool in order to have the best user experience.
3.2 Functionality of the viewer tool
The main window of the tool is shown on Figure 14. ‘File’ menu at the top left corner of the screen allows user to open preferences and statistics window. To define the path a user has to fill the text field at the top of the window with URL to the destination log folder with pop up window helper. After that he has to click on the “Parse logs and build execution tree” to build the view at the central part of the layout.
Figure 14. Layout of the main window
In case there are some errors during the execution “Error Window” will appear. Each error message provides the path to the file in which error has happened. There are several kinds of errors handled by the tool:
WrongFileFormat – presented file does not follow any of existing patterns. WreckedFileFormat – format of the file is correct, however the content of the file was wrecked. This error can happen in the case of the crash of the application. The active object for this file will not be built.
RequestNeverEnds – this error means that presented request will never end. This may happen in two cases: the application crashed or there is a deadlock, the request is blocked by waiting for the other threads (typically awaiting for a future to be resolved). Active object for this file will be built and deadlocked thread will be marked on the view.
“?” button from the menu bar at the top of the screen loads html page with a brief documentation about the tool and how to use it.
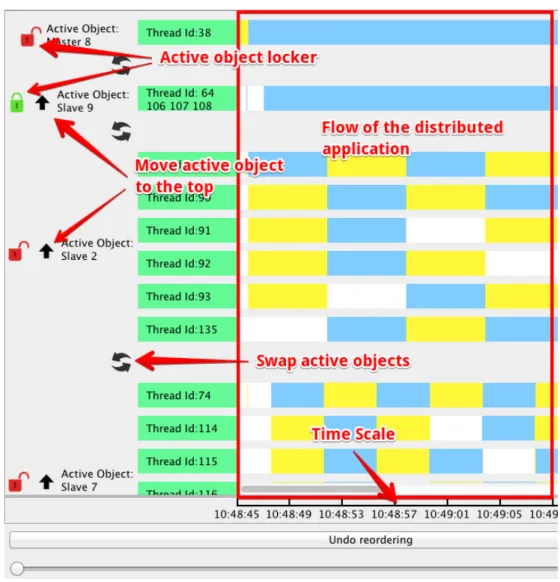
On Figure 15 we can see the layout of the tool right after building the view. The view is corresponding to the Master-Slave example presented before. On the left part of the drawing there is a list of multi-active object names and list of the threads attached to each active object. On the right part of the layout there are yellow, blue, white and red rectangles and each color has its own meaning. Yellow and blue rectangles correspond to the requests. In the case requests are executed fast it is difficult to distinguish two neighbor requests that is why we decided to differentiate them by alternating different colors for neighbor requests. White color corresponds to the idle time of the thread. And occurrence of the red rectangle means that the request will never stop its execution and the thread is blocked. Time scale at the bottom helps user to check the time when the events have happened according to the local current
time of each machine (we suppose that a cluster of machines is synchronized with the NTP network time protocol).
The lock button on the left of the name of every active object allows shrinking the threads of the active object in case it is not needed to be displayed at the moment. It is made for the convenience of the user, for better organization of the workplace.
Besides that the tool proposes the instruments for the user to change the order of the active objects. Swap button between each two neighbor active objects swaps them. Up-arrow button moves selected active object to the top point of the list. Upon moving, currently displayed communications are preserved and updated as well. Application holds the history of the changes of the order of the objects. Before each reordering the tool makes a checkpoint holding the order of active objects and puts it in the queue. At the bottom of the screen there is an “Undo reordering” button, which makes one step undo ordering action by popping the last added checkpoint from the queue. This way we can infinitely undo actions, which is a crucial feature.
Figure 15. Main layout of the viewer tool
When the mouse overlaps the request a small context dialog appears containing the information about the request: requestID, name of the Active object, which triggered the request and the time spent to execute the request.
By making a right mouse button click on the request a context menu appears with several menu items:
• “Show dependencies” button will cause a bunch of changes in the view. 1 Several arrows appear on the screen and each arrow out of this
group corresponds to the request call. One of these arrows is an arrow between the caller of the selected request and the selected request itself. Some requests can be called from within the same active object, which holds the selected request, and in that case the arrow will be shown as well. If the object, which is not the part of any active object, called the selected request then arrow will not be shown as our tool is focusing on the active objects only. Besides this arrow all the arrows connecting selected request and all the requests triggered by the selected request will also be shown.
2 All the requests, which are either the source or the destination of the arrow, are highlighted in the orange color.
3 Active objects are reordered in the way that all the active objects containing the requests depending on the selected request are grouped together in the list. This reordering checkpoint also goes to the ordering queue and can be undo in the future.
• “Show compatibility info” button clicking causes the highlighting of all the compatible requests inside selected active object in green color. In case it is already highlighted as a dependent request with orange color then the highlight color changes to purple.
Screenshot from Figure 16 demonstrates features presented before. In this example we decided to see dependency information for two requests colored in purple. Besides that we have decided to show compatibilities of the request, which is colored into blue color at the top left corner. As we see from the image compatible requests are highlighted either in green or purple colors. Requests highlighted in orange are either were selected by us to show the dependencies or these requests were dependent on the selected request. Purple requests are both compatible with selected or dependent on selected.
Figure 16. Dependencies and compatibility representation
• After showing compatible requests of the selected request the new option named “Remove compatibility highlight” appears in the context menu. This option removes all the compatibility-highlighted requests from the selected active object. Compatibility highlighting can be made just for a single request at a time; any new
• “Clear” button at the bottom right corner of the screen removes all the arrows and highlighting for every active object.
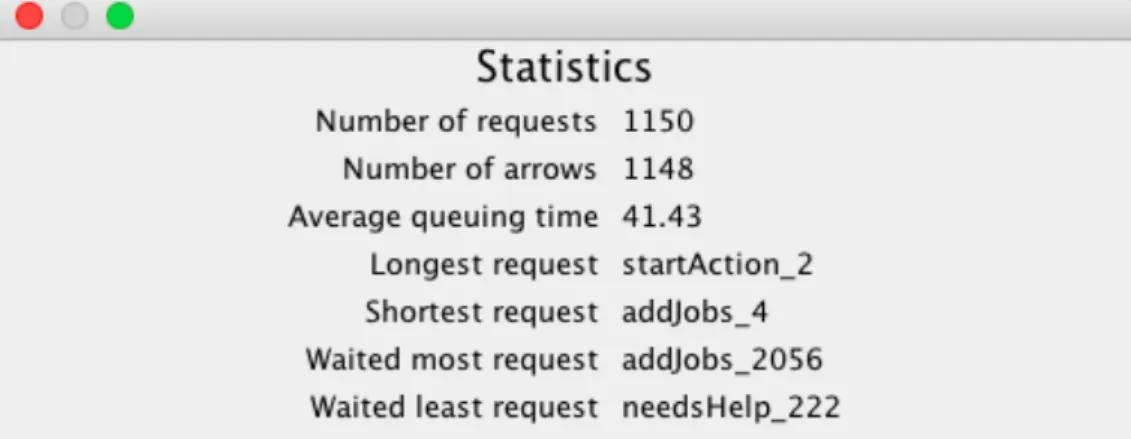
Statistic window on figure 17 exposes the measured properties of the application like the number of requests, connections between the requests and other statistic values.
Figure 17. Statistics window
Preferences window shown on Figure 18 has several options for customizing the performance of the tool.
“Allow view moving after event selection” checkbox is responsible for the view position of scrollable area after selecting a request. In case it is checked after selecting a request the view will scroll to the position where the user can see the starting point of the arrow calling selected object. Otherwise, no scrolling will be done.
“Allow automatic reordering” checkbox enables/disables automatic reordering described before.
Figure 18. Preferences window
By checking “Enable dialog” checkbox, text field appears inside preferences window asking the maximum number of the dialogs. Checking this checkbox and selecting the maximum number of the dialogs set to more than 0 enables following functionality:
When the user clicks at any point of any thread then the window shown on Figure 19 appears with all the requests and their statuses for the selected active object. List of the requests is sorted by the delivery time to the queue. Depending on a selected time each row represents a request and it is colored in a way based on the following rules:
• Red colored row means that request already has been executed
• Green colored row means that request has been started but not yet finished, the event is in progress of the execution.
• Cyan colored row means that request is in the queue but not yet started. It is waiting for being executed.
• White requests are not yet delivered to the queue.
The number of dialog windows cannot exceed the value selected in the preference window. In the case the user reaches the maximum number of opened dialogs then the oldest dialog window will be closed and the newly created dialog will be opened.
Besides that in the last column in each row there is a button “Show compatibility information”. By pressing this button the title of the button changes to “Hide compatibility information” and all the other buttons are replaced with the compatibility state related to selected request.
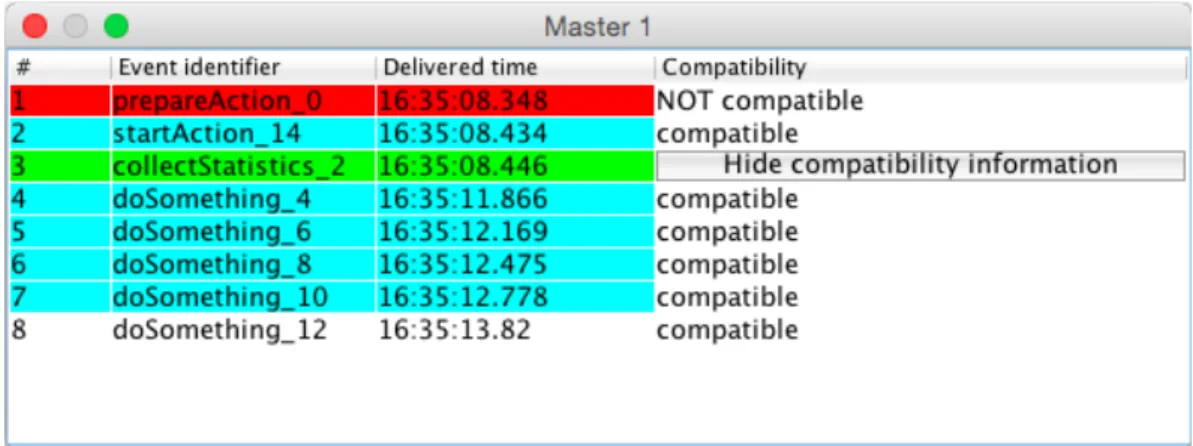
To summarize what was said before lets take a look at the figure 20. In the presented example we see the list of requests of Active object Master1. Taking into account the colors of the rows we can state that at the selected moment prepareAction_0, has already finished the execution, collectStatistics_2 is executing and all the other requests except the last one are in the queue and waiting to be scheduled. The last request is not yet in the queue. For this example we check the compatibility of the method collectStatistics_2 and we can see that it is compatible with all the other requests except prepareAction_0. By pressing “Hide compatibility inforamtion” the table moves to the previous state.
Figure 19. Request queue dialog
3.3 Most common use-‐cases
In this section we will take a look at some usual use cases of the concurrent and distributed applications. More precisely we will take a look at deadlock and race-condition examples.
3.3.1 Deadlock
Deadlock is a state of the multithreaded application in which all the threads wait for the response or some resources from other threads inside that system. So the whole process is stuck. In our case deadlock happens when two active objects wait for
deadlock is the most important feature a debugger of multithreaded application has to provide.
Figure 20a. Deadlock on a single threaded active object
Figure 20b. No deadlock with multithreading
On the figure 20a we can see the representation of the deadlocked application inside our tool. On the screenshot both of the requests are colored in red and as it was defined before red color means that the request never ends. In this example the maximum number of threads of each active object is equal to 1. So the multi-active object behaves like multi-active object. Active object First 17 makes a request call on the active object Second 16 which tries to make a request on active object First 17. First 17 cannot execute incoming request as it is already busy with request it sent before. So we have a deadlock, each active object waits the response from another one.
On this small simple example we can see the pattern of the deadlock. On the bigger scale this pattern will look the same and the developer will easily conclude that deadlock appeared and will try to fix the issue.
Figure 20b. shows the solution of the deadlock problem from figure 20a. By using multi-active objects instead of active objects and increasing the limit of threads we fix deadlock problem. We can see that active object with name First 22 creates extra thread when needed which solves the problem.
3.3.2 Race condition
Race condition is a state of the system in which the output is dependent on a sequence of uncontrollable events[12]. Common example of the race condition is the situation in which there is a single variable, which can be accessed concurrently by many threads.
Figure 21. Race condition
Race condition example is presented on the figure 21. DataHolder is an object which contains a variable and two methods accessing this variable: read() – returning the value of the variable and write(value) – writing value to the variable. MainDataRace object launches several RaceExecutors, each RaceExecutor object makes some computations and writes data to the DataHolder object. At some point of the execution MainDataRace object reads the value of the variable from the DataHolder object. By analyzing figure 21 we can easily follow the state of the variable inside DataHolder1 object. First RaceExecutor6 wrote the value to the variable then MainDataRace4 object decided to read the value and finally RaceExecutor7 and RaceExecutor3 write the result of the execution to the variable inside DataHolder1. From the screenshot of the debugger on the figure 21 we can conclude that MainDataRace4 will read the value, which was earlier updated by RaceExecutor6 and will never read values written by other RaceExecutors. Knowing a sequence of actions in the concurrent systems is very helpful for the developer.
These simple examples show how the user can debug his concurrent and distributed applications and based on this knowledge to improve their performance.
3.4 Performance evaluation
One of the most important questions coming along with developing of any application is what will be the complexity of the execution. It is important to know if result can be obtained in the reasonable time for the given environment and initial data. In our case we need to know if the tool will be able to display an application execution in a reasonable time as the size of our application grows
For the presented tool we have the complexity which equals O(n), where n is the total number of the requests. Parsing stage takes most of the execution time as on this stage we collect all the data from the files make all the needed computations and merging. Logs reading phase requires O(n) time to execute, merging of the logs takes O(n) as well. For wrapped objects we used dataset based on the hash table, access to the values from this dataset is fast with the constant complexity.
Figure 22. Performance of the tool
The chart from figure 22 shows the dependency between the number of the requests and execution time of the tool to build a view. We can see that dependency is linear and our solution is scalable as complexity is not exponential. The tests were made on the 1Gb dataset and the tool spent around 15 seconds to read the logs, parse them and present the result. We can predict that with the growing datasets dependency will be linear as long as we have some free memory to hold the data we need. For this part we can conclude that the performance of the tool is acceptable by the developers debugging their applications.
In this chapter we were looking deep inside the debugging tool for distributed application. We covered the most important aspects of the implementation and considered the ways the user can interact with application. Finally we analyzed the performance of the tool and stated that our solution is scalable.
Chapter 4. Related works
4.1 IC2D
IC2D is a debugging tool developed by the OASIS team to remotely monitor and steer the applications based on the active objects model and made with the help of ProActive framework. It enables to visualize dynamically the state of ProActive application in the runtime.
Figure 23 shows how the tool behaves during the execution of ProActive distributed application. On the top of the screen the user can arrange the nodes, active objects and Virtual Machines. Besides these entities the view provides the set of currently used connections between them. The width of the line depends on the amount of traffic going through the connection. At the bottom of the screen there is a message flow bound to selected active object. All the requests executed inside this active object will be shown in the message flow.
In contrast to the tool presented in this paper IC2D supports real time monitoring of the active objects. However it does not support flow based view of the application as well as it does not support multithreading provided by multi-active objects. Instead it is more focused on the distribution of active objects and on low-level settings, e.g. the number of JVM.
4.2 XPVM
XPVM is a debugging tool for the PVM (Parallel Virtual Machine). PVM is a software tool which binds together a group of machines into the network allowing user to develop distributed application as it is made on a single big parallel
computer.[12] As we see from Figure 24 the tool is quite rich. In the left top corner there is a network view showing dependencies between the hosts. In the bottom left corner there is a flow-based view showing connections between threads. Utilization view at the top right corner showing when one or another thread was busy. Below this chart there is a trace log of the execution showing the way distributed application evolved. In spite of such a rich functionality the tool does not support active objects or multi-active objects just simple threads. The tool does not allow also distinguishing requests inside the threads.
Figure 24. Main view of XPVM debugging tool
4.3 Summary
Other tools like [14,15,17,18,19] are either old or not support active object applications or both that is why we will not further focus on these tools. Solutions presented before provide very rich functionality, however they cannot help developers to debug their multi-active objects applications. IC2D is focused more on the dependencies between the objects rather than on the time-based flow of the applications and XPVM was not build for active objects in spite of its richness.
Chapter 5. Conclusion
In this paper we presented a viewer tool for multi-active object – the debugging tool aiming to simplify the way user can unscramble a distributed and concurrent application. Introduced solution display flow based view on the time scale of the distributed application. Debugging process with the presented tool is very easy to execute. The only thing the developer has to do is to configure the path to the log folder and that is it, you are ready to run the tool. Tool is also user friendly provides rich amount of the information about the distributed application like active objects, threads, requests, connections between the requests and also some useful statistic information. The environment of the tool is configurable; the performance of the tool is smooth and fast. Execution of the tool is scaling with scaling amount of data inside the logs.
The things that have been done during the internship are following:
• Active object and multi-active object models were deeply studied to investigate what kind of problems may happen inside distributed applications. Knowing that helps to understand what problems does developer face and how to make the most convenient way for him to debug the application.
• Logging mechanism developed inside ProActive framework. Created loggers provide all the necessary information concerning Active Objects, compatibility between them, lifecycle of the request, etc. Developer has to specify the path to the destination logs folder in the configuration file and that is it. Log files will be put to the specified place without recompilation of his distributed application.
• Debugging tool for multi-active objects has been created from scratch. The tool builds the time-based visualization of the distributed application based on the logs created before. The tool allows observing all the entities like active objects, threads and requests of the distributed application and dependencies between them, which are represented with arrows. Besides that user can track compatibility between the requests inside a multi-active object. Tool provides a lot of preferences options to update the environment.
• Several tests were made to check most common use-cases and to find possible bugs inside the debugging tool. The purpose of these tests was also to adjust our tool the possible errors, which may happen during the development of the distributed applications. Master-Slave example created to cover the basic functionality with tests.
Comparing with other debuggers for the distributed applications we can conclude that presented tool is a unique instrument for the debugging of multi-active object applications. Other solutions are either very old and cannot be adapted for the active object model or do not provide the required functionality.
Presented tool can be applied not just to active object or multi-active object. The tool itself just requires logs following required pattern and does not need to know from which type of distributed applications they come from.
Two members of the Scale team already use the tool to solve research related problems and are going to use it further.
5.1 Future work
5.1.1 Optimization
Logging mechanism inside ProActive can be improved. In current implementation for collecting third type of logs, which is compatibility log, we do create a log file for each instance of the active object not for a class. If we consider the Master-Slave example presented in the paper and lets suppose we have 1 Master and 100 Slaves then current logger will create log compatibility file once for the Master and 100 times for a Slave. Compatibility definition does not change from one instance of Slave to another; it is the same for all the Slaves. Logically it is nice to log it once and to have in total 2 compatibility log files, one for Master one for Slave, instead of 101 log files. Unfortunately this update requires changes inside the core of the framework and because of that was not the part of the internship.
5.1.2 Real time support
Tool can be updated to support real time tracking of the running application. It can be easily done because of two reasons:
• Performance of the application is scalable; reading extra logs without re-reading will not be an issue.
• No need to read all the logs again each time we have to update the view. Instead we can just make a checkpoint in the log file and when it is needed to update the view we can just start reading log file from this checkpoint.
Live tracking of the performance of the distributed application may be very useful. In case application is huge and requires hours to be executed developer may be interested in following what is going on and in case something goes not in the way he expects he can just make the necessary changes into the application without waiting the end of the execution. In the current version of the tool the user can rebuild the view during the execution of the distributed application. However this solution will not be automatic, it has to be forced by the user and does not use checkpoint mechanism allowing reading just fresh log.
Chapter 6. References
[1] Ludovic Henrio, Fabrice Huet, and Zsolt István. Multi-threaded active objects. Coordi- nation Models and Languages, 2013.
[2] Einar Broch Johnsen, Reiner Hähnle, Jan Schäfer, Rudolf Schlatte, and Martin Steffen. Abs: A core language for abstract behavioral specification. Formal Methods for Components and Objects, 2012.
[3] Françoise Baude, Alexandre Bergel, Denis Caromel, Fabrice Huet, Olivier Nano, and Julien Vayssière. IC2D: Interactive Control and Debugging of Distribution, 2001. [4] D. Caromel, L. Henrio, and B. Serpette. Asynchronous and deterministic objects. In Proceedings of the 31st ACM SIGPLAN-SIGACT symposium on Principles of programming languages, pages 123–134. ACM Press, 2004.
[5] D. Caromel, L. Henrio, and B. P. Serpette. Asynchronous sequential processes. Information and Computation, 207(4):459–495, 2009.
[6] E. B. Johnsen, O. Owe, and I. C. Yu. Creol: A type-safe object-oriented model for distributed concurrent systems. Theoretical Computer Science, 365(1–2):23–66, November 2006.
[7] J. Schafer and A. Poetzsch-Heffter. JCoBox: Generalizing active objects to concurrent components. ECOOP 2010–Object-Oriented Programming, pages 275– 299, 2010.
[8] Annotations in java.
http://docs.oracle.com/javase/tutorial/java/annotations/ [9] ProActive framework source project
https://github.com/scale-ProActive
[10] R. Greg Lavender, Douglas C. Schmidt: Active Object – An Object Behavioral Pattern for Concurrent Programming, 1996.
[11] Race condition definition.
https://en.wikipedia.org/wiki/Race_condition [12] PVM homepage http://www.csm.ornl.gov/pvm/
[13] A. Geist, A. Beguelin, J. Dongarra, W. Jiang, R. Manchek, and V. Sunderam. PVM: Parallel Virtual Machine. A Users’ Guide and Tutorial for Networked Parallel Computing, MIT Press.
[14] G. von Laszewski, I. Foster, J. Gawor, W. Smith, and S. Tuecke. Cog kits: A bridge between commodity distributed computing and high-performance grids, in ACM Java Grande Conference, http://www.extreme.indiana.edu/java00., San Francisco, California, June 2000.
[15] G.Allen,W.Benger,T.Goodale,H-C.Hege,G.Lanfermann,A.Merzky,T.Radke, and E. Seidel. The Cactus Code: A problem solving environment for the grid, in Proceedings of the Ninth IEEE International Symposium on High Performance Distributed Computing (HPDC9), 2000.
[17] S. Sekiguchi, M. Sato, H. Nakada, S. Matsuoka, and U. Nagashima. Ninf: Network-based information library for globally high performance computing, Paral lel
Object-Oriented Methods and Applications (POOMA), 39–48, 1996.
http://ninf.etl.go.jp.
[18] G. von Laszewski, K. Shudo, and Y. Muraoka. Grid-based asynchronous migra- tion of execution context in Java virtual machines, in R. Wismu ̈ller, A. Bode, Th. Ludwig, (eds.), Euro-Par 2000 - Parallel Processing, LNCS, Springer-Verlag, 1900. [19] C. Lee, S. Matsuoka, D. Talia, A. Sussman, N. Karonis, G. Allen, and M. Thomas. A grid programming primer, Draft 2.4 of the Programming Models Working Group presented at the Global Grid Forum 1, March 2001.