Analyzing and Improving Throughput of Automated Storage and
Retrieval Systems in Personal Computer Manufacturing
by
G. Thomas Heaps-Nelson
B.S. General Engineering, Harvey Mudd College, 1995 B.S. Chemical Engineering, Iowa State University, 1997
Submitted to the Sloan School of Management and the Department of Chemical Engineering
In Partial Fulfillment of the Requirements for the Degrees of Master of Business Administration
and
Master of Science in Chemical Engineering
In conjunction with the Leaders for Manufacturing Program at the Massachusetts Institute of Technology. June 2005
@ 2005 Massachusetts Institute of Technology. All rights reserved.
Signature of Author_
Sloan School of Maragement Department of Chemical Engineering May 6, 2005 Certified by Certified by Certified by Accepted by Accepted b
Professor Stephen C. Graves Sloan School of Management Thesis Supervisor
Professor David Simchi-Levi Department of Civil and Environmental Engineering
Thesis Supervisor
A. A.
Professor Gregory J. McRae Department of Chemical Engineering Thesis Reader
Margaret C. Andrews Sloan School of Management Executive Director f Master's Program y ASSA- US n fNSTIrtJT MASSACHUSETTS INSTITTE OF TECHNOLOGY
SP 01205
LIBRARIES
Daniel D. Blankschtein Department of Chemical Engineering Graduate Committee ChairmanAnalyzing and Improving Throughput of Automated Storage and Retrieval Systems in Personal Computer Manufacturing
By
G. Thomas Heaps-Nelson
Submitted to the Sloan School of Management and the Department of Chemical Engineering on May 6, 2005 In Partial Fulfillment of the Requirements for the Degrees of
Master of Business Administration and Master of Science in Chemical Engineering
ABSTRACT
The content of this thesis draws heavily on work completed during a 6.5 month MIT Leaders for Manufacturing (LFM) internship at Dell Corporation's personal computer manufacturing facility in Lebanon, Tennessee (EGI) from June 2004 to December 2004. This work relates primarily to efforts to analyze and improve the throughput of the Automated Storage and Retrieval System (ASRS) in that factory. Wherever possible, the thesis abstracts from the EGI factory case study to provide lessons for improving the throughput of ASRSs and accumulative manufacturing systems in general.
In addition to this core of the thesis, specific implementation challenges encountered during the EGI case study are addressed. Finally, general cultural observations about Dell's manufacturing environment are discussed.
The author believes the two most unique aspects of this work are the Crane Frontier framework developed for analyzing ASRS throughput (Section 2.6) and the range and taxonomy of ASRS throughput improvement solutions (Chapter 3).
Thesis Supervisors:
Stephen C. Graves
Abraham J. Siegel Professor of Management, MIT Sloan School of Management
David Simchi-Levi
Professor, MIT Department of Civil and Environmental Engineering Thesis Reader:
Gregory McRae
ACKNOWLEDGMENTS
I am very thankful for Dell's gracious openness and support of me and my internship
project. I'd like to specifically thank several people at Dell for a wonderful LFM experience.
Steve Cook was tremendously helpful in getting me the support and resources I needed during my internship. His strong executive sponsorship of the project was also
instrumental in allowing me to push forward the implementation of my team's
improvement ideas. In a very real sense his commitment to the partnership between Dell and LFM was what really made possible this exciting project.
Rick Anthony was a great mentor to me who helped me navigate the waters of Dell's culture to get results and make impact. He was very generous with his time and attention despite me being a "side project" for him. He was great at giving thesis feedback and helping me keep on top of the LFM logistics since they were fresh in his mind from the year before.
I could not have asked for a better project teammate than Michael Hoag - he was vital to
our team's success. His imprint is unmistakable throughout the whole project including analysis, solution generation, and implementation. His technical ability and
manufacturing knowledge coupled with his intense energy and enthusiasm truly set him apart. His expert engagement in the project also made my project passdown infinitely easier than it would have been otherwise.
James Enright was a great project teammate also. He was very helpful during the data collection/analysis phases and in introducing me to many of the associates on the floor. His knowledge and insights of Dell's manufacturing processes (especially burn) added richly to the project.
I would also like to thank Jen Felch and Vida Killian for their encouragement and moral
support during the project.
From the MIT side, I can't thank Professor Steve Graves enough for his guidance; his active engagement with the project and thesis writing added tremendous value. I'd also like to thank my engineering advisor Professor David Simchi-Levi and my engineering reader Professor Greg McRae.
I want to thank Intel for their generous sponsorship of me during LFM. Specifically,
Frank See and Venky Patil have had the most direct involvement with making my two years in the program a success.
Last, but certainly not least, I want to acknowledge the deep love and tireless support that my mother, Marilyn, and my brother, Jim, have given me along the road of my life's pursuits. I can never fully express the love and gratitude I feel for them.
-3-Table of Contents Abstract...2 Acknowledgments...3 Table of Contents...4 Table of Figures...6 Table of Tables...6
Chapter 1: Background Information about Dell and this Project...7
1.1 D ell's B usiness M odel ... 7
1.2 The Context of Dell's Manufacturing Improvements...9
1.3 What is GeoManufacturing?... . . . .. . . 11
1.4 How GeoManufacturing Gives Rise to this Project...13
1.5 Problem Statem ent...17
Chapter 2: Data Collection and Problem Analysis...18
2.1 Introduction to Data Collection and Problem Analysis...18
2.2 What is an Automated Storage and Retrieval System and H ow D oes it W ork? ... . . . .18
2.3 Thinking about ASRS Throughput and ASRS Storage Capacity... 25
2.4 Variability of Hourly EGI Crane Usage Data...29
2.5 Timing Studies of the Cranes...34
2.6 T he C rane Frontier...39
2.7 Chapter Summary...44
Chapter 3: ASRS Improvement Recommendations and Implementation...46
3.1 Context of ASRS Throughput Improvement Decisions...46
3.2 Solution Category 1: Improvements to the Cranes' Physical Capabilities...49
3.2.1 Dual Box Placement...50
3.2.2 B in O ptim ization ... 55
3.2.3 Intelligent ASRS Input Buffering...59
3.2.4 Expansion of the Existing ASRS...59
3.3 Solution Category 2: Operational Changes which Improve "Use" of the Region Inside the Crane Frontier...60
3.3.1 Split-Shift Team ... 61
3.3.2 Almost-Ready-To-Ship WIP Staging... 63
3.3.3 Pulling WIP Differently from Operations Upstream of the ASRS...64
3.4 Solution Category 3: Improvements Which Reduce the Need for ASRS A ccum ulation... 65
3.5 Other Solution Ideas...69
3.6 EGl Implementation Lessons...71
3.6.1 Lessons from Implementation of Intelligent Input Buffering...72
3.6.2 Lessons from Piloting of the Recirculation Loop...73
3.6.3 Lessons from the Planning of the Split-Shift Team...74
Chapter 4: Cultural Observations and Lessons Learned...76
4.1 How Dell Embraces Speed...76
4.2 The Value of a "Fresh Set of Eyes" ... 78
4.3 The Nature of Communications at Dell ... 78
4.4 Relationship between Manufacturing and Engineering at Dell...79
4.5 Relationship between Technology Development Site and Satellite M anufacturing Facility...80
4.6 Tension between Functionally-Aligned and Geographically-Aligned O rganizational Structure...81
4.7 Observations about IT at Dell...82
4.8 Opportunities for Future Work...83
Bibliography...85
-Table of Figures
Figure 1: Schematic of Dell's PC Assembly and Shipping Processes...16
Figure 2: Diagram of Typical ASRS (Similar to that Used in EGI)...19
Figure 3: Diagram of Typical Twin-Shuttle Crane...20
Figure 4: Side View of Half of One of EGI's Storage Racks...21
Figure 5: A Quadruple-Command Cycle Tour...22
Figure 6: A Rough ASRS Analogy to a Bathtub...28
Figure 7: EGI Total Hourly Crane Flow Rate (Weekdays Only), 8/9/04 -9/23/04... 30
Figure 8: Average Scaled EGI Input and Output Rates, Weekdays, 8/9/04-9/23/04... 32
Figure 9: Coefficient of Variation of EGl Input and Output Rates, Weekdays, 8/9/04-9/23/04... 33
Figure 10: Three Feasible Vertex Points Corresponding to (2,2), (0,2), and (2,0) M oves... 41
Figure 11: Scatter Plot of EGI ASRS Hourly Crane Data with Crane Frontier...44
Figure 12: Graphical Representation of Categories of ASRS Throughput Im provem ents...49
Figure 13: Estimate of Crane Frontier Expansion due to Dual Box Storage in EG1..52
Figure 14: Diagram of a Consolidated ASRS Storage Rack...56
Figure 15: How Split-Shift Hours Overlap Valleys in ASRS Utilization...62
Figure 16: Illustration of Split-Shift's Output-Focused Strategy...63
Figure 17: EGI System Quantities as a Function of Order Size...67
Figure 18: Trends of the ASRS Dwell Time Versus Order Size...69
Figure 19: Partial Organization Structure of Dell America Operations...82
Table of Tables
Table 1: Summary Statistics of EGI ASRS Total Load, Weekdays, 8/9/04 -9/23/04... 31Table 2: Summary of EGI Crane Timing Study Data ... 37
Table 3: Frequencies of Crane Moves During an "Accumulation" Period...38
Chapter 1: Background Information about Dell and this
Project
1.1 Dell's Business Model
Dell has been wildly successfully since its founding a little over 20 years ago (1984). It has been a Wall Street darling for much of that time as well. The success of the PC itself can largely be seen as a testament to Clayton Christiansen's insight provided in The Innovator's Dilemma that new technologies often come into business prominence from the "low-end" of the market.' Dell's success can be viewed as an extension of the same sort of "bottom-up" market penetration strategy within the PC business. Now that Dell has firmly established itself as the market leader in low-end "commodity" PCs, it is quickly becoming a force to reckon with in higher margin products such as high-end PCs, servers, workstations, and printers (which provide their high profitability through the ongoing revenue stream from ink sales.)
Another seminal business thinker, Michael Porter, makes the claim that the three general dimensions on which businesses compete are cost leadership, differentiation, and focus.2 Using this competitive framework, it is clear to outsiders and insiders alike that Dell's success has been due to its remarkable cost competitiveness. Clearly, in this strategic framework Porter means not that a company can focus only on one of these three pillars while ignoring the other two. He means that a successful company is usually "good enough" (compared to customers' alternatives) on two of the three criteria and that it
Christensen, Clayton M. The Innovator's Dilemma. New York: HarperBusiness, 2000.
2 Porter, Michael E. Competitive Strategy: Techniques for Analyzing Industries and Competitors. New York: The Free Press, 1980.
-7-shines by standing out from the crowd on a third criterion. The company usually highlights the pillar that they differentiate themselves with prominently in their mission
statements so that employees, investors, customers, and suppliers know "what that company is all about." There are many benefits which accrue from having an articulated and streamlined corporate strategy. Dell has been wildly successful using this kind of corporate philosophy. They have been able to use their cost consciousness to drive large improvements in customer service, quality, and safety. It has been much easier for Dell to leverage its cost focus (which has a high level of cultural buy-in already) in the service of improving other metrics of interest, than it would have been to attempt to push those metrics only for their own sake. Blaine Paxton has done a wonderful study of the culture at Dell which has enabled this remarkable business success.3
Dell has not been secretive about its business model - everyone knows what it is. Other companies have tried to emulate this model in PCs to little avail. Smaller players simply do not have the scale to compete with Dell at its own game. Larger players have pre-existing interests and rigidities4 that make it virtually impossible to transition over to a Dell-like model in a very graceful way (i.e., without suffering in profitability and market share during the transition period.)
The commoditization of the PC has played itself out in a large consolidation in the PC business recently. Hewlett Packard completed its merged with Compaq in 2002. Also,
3 Paxton, Blaine. The Dell Operating Model. S.M. Thesis, Massachusetts
Institute of Technology, 2004.
4 For an example of the difficulties encountered in copying Dell's model see: Schrage, Michael. "The Dell Curve." Wired July 2002. 2 Apr. 2005 <http://www.wired.com/wired/archive/10.07/dell.html>.
Lenovo announced its intention to buy IBM's PC division in 2004.5 While the other large players in the PC business were struggling, Dell announced its intention in 2004 to build a new manufacturing plant on US soil in North Carolina.6 In the midst of the
vigorous debates in the United States about the effect of manufacturing off-shoring, Dell is uniquely poised to expand its US manufacturing operations because localized
production suits its make-to-order business model. (More discussion of Dell's incentives toward keeping and expanding US manufacturing is in sections 1.3 and 1.4.)
The main focus of this thesis is not Dell's business strategy or Dell's culture. However, this context is useful when thinking about the motivation for this project and thesis which revolve around improving throughput in certain types of manufacturing bottlenecks (using the Dell PC manufacturing environment as a case study.)
1.2 The Context of Dell's Manufacturing Improvements
The departure point for discussing Dell's operations is the fact that Dell is a "make-to-order" enterprise; this fact has been at the center of Dell's success in the marketplace. The primary benefits conferred by using the make-to-order model are elimination of a whole layer of the distribution supply chain (e.g., retailers), reduction in the overall amount of inventory in the supply chain, and closeness to the "pulse" of the customer by having more direct information about customer preferences. The popular press often discusses the supply chain aspects of Dell's operations, but much less attention is focused on Dell's actual manufacturing processes "within the 4 walls."
5 John G. Spooner and Kanellos, Michael, and. CNET. 8 Dec. 2004. CNET News.com. 2 Apr. 2005
<http://http://news.com.com/IBM+sells+PC+group+to+Lenovo/2 100-1042 3-5482284.html>. ( For example, see http://www.industryweek.com/ReadArticle.aspx?ArticlelD=10007.
-9-Final PC assembly is a very modular, low-skill labor process. Dell is the only large PC maker who still assembles any PCs in the United States, and then even only desktops and enterprise products bound for North America. Laptops destined for North America are built in Dell's manufacturing facilities in either Malaysia or Ireland, then air freighted to Dell distribution sites in the United States.
The fraction of the overall PC assembly process for Dell desktops which is happening in the United States is diminishing. Dell is moving to higher and higher levels of "chassis integration" with its Asian component suppliers. This means that if a part can be
assembled into the chassis in Asia (prior to receiving the order specification for that PC) it should be. The integrated chassis are then shipped by barge to the United States and transported to one of Dell's two North American PC assembly campuses (Austin, TX or Nashville, TN). This still allows for the final customization of the PC after the North American customer places his or her order. Essentially this is an optimal implementation of a "postponement" strategy which has many other benefits, including inventory
The following quote illustrates Dell management's perspective about keeping inventory
low:
"That's why inventory is a four-letter word at Dell. To Kevin Rollins, who succeeded Michael Dell as CEO this past July (Dell continues as chairman), inventory is like fish. 'The longer you keep it the faster it deteriorates -- you can literally see the stuff rot,' he says. 'Because of their short product lifecycles, computer components depreciate anywhere from a half to a full point a week. Cutting inventory is not just a nice thing to do. It's a financial imperative.' "7
This same sort of management drive for cost-containment results can be seen in the following quote from the same article:
"Dell, which hit $45 billion in annual revenue this past July and is growing at a nearly 20% yearly clip, seems well on its way toward surpassing its goal of $60 billion within the next few years. And it's not letting up. Still relentlessly striving to get better faster, Dell intends to slash $2 billion in costs. CFO Jim Schneider has indicated that much of the cuts will come from manufacturing operations and the supply chain."8
It is in the context of this overall corporate imperative to continue to drive costs out of the manufacturing process and supply chain that this internship project and thesis arose.
1.3 What is GeoManufacturing?
Because Dell has been so successful at driving cost out of its supply chain and manufacturing processes, outbound logistics costs have become a very significant fraction of the overall "transformational cost" (referred to internally at Dell as Cost Per Box or CPB) of getting PCs into the hands of customers. Dell is hard-driving on itself and its suppliers to continually drive out cost.
Bill Breen, "Living in Dell Time," Fast Company Nov. 2004, 5
Nov. 2004.<http://www.fastcompany.com/magazine/88/dell.html>. Sibid
-Several years ago a corporate imperative was made explicit to "build PCs close to our customers." This imperative was dubbed "GeoManufacturing" or GeoMan for short. As the name implies Dell intends to continue manufacturing in all the major geographies that
it serves - to the extent that it is economically sensible, Dell will manufacture PCs for
customers in a given region in factories in that region.
Five major benefits that flow from GeoManufacturing are:
" Reduced outbound logistics costs
" Reduced customer lead times (improving sales and customer satisfaction)
* Increased variability pooling over different customer categories (reducing capital
expenditure)
" Goodwill based on creating employment in each of the geographies
* Increased visibility to customers and resulting word of mouth advertising
The first two benefits are rather straightforward (and important). It is clear that the closer
PC manufacturing is to the customers, the less costly and the timelier it will be to ship
finished product to the customer.
The third benefit noted above is a bit more subtle. If the full Dell product portfolio of PCs (or any products for that matter) is to be built closer to customers, flexible factories must replace product-dedicated factories to accommodate seasonal variability which takes place across the year. A prime example of seasonal variability in PC manufacturing is that the peak of home desktop PC demand is during the Christmas buying season while
the peak of business desktop PC demand is during the summer when many corporate and governmental PC budget cycles are ending. Implementing factory flexibility means that less overall capital equipment will be needed (assuming relative flexibility of most types of factory equipment, which is generally characteristic of Dell's manufacturing
processes) to satisfy the demand across the year. This benefit ties in quite nicely with Dell's cultural virtue of frugality.
The fourth and fifth benefits are "bonus" benefits one receives from geographical diversity in manufacturing if one is perceived as a good employer and as a producer of quality products.
All five of these benefits of GeoManufacturing fit in extremely well with Dell's strategic
implementation of make-to-order and cost control.
1.4 How GeoManufacturing Gives Rise to this Project
This project directly pertains to GeoManufacturing in the North American PC market. Dell's two existing PC assembly sites in the United States are in Austin, TX and
Nashville, TN; it has recently announced a third plant in Winston-Salem, NC (expected in September 2005). Prior to the GeoMan initiative, the Austin, TX facility had
specialized in corporate desktop PCs (OptiPlex desktops and Precision workstations), and the Nashville, TN facility has specialized in home desktop PCs (Dimension desktops). OptiPlex desktops are the desktop PCs targeted mainly at corporate and government customers, while Dimension desktops are the desktop PCs targeted mainly at home and
-small business customers. The differences in sales characteristics (specifically in order size) between OptiPlex and Dimension will play an important role in subsequent chapters.
Given that the vast majority of Dell's North American customers are still near the east coast of the United States, it has become very attractive for the reasons discussed in the previous section to be able to flex Dell's factories to make Dimension desktops in Austin and to make OptiPlex desktops in Nashville, enabling production closer to customers on average.
Clearly there are many factors to trade off when deciding where to locate new factories, but being close to customers was one of the key factors in Dell's decision to locate its newly announced manufacturing facility in North Carolina (even closer to the bulk of its customers):
'The education system, commitment to businesses and proximity to a large and growing base of Dell customers were important in our decision to expand into North Carolina,'
said Kevin Rollins, Dell's chief executive officer."9
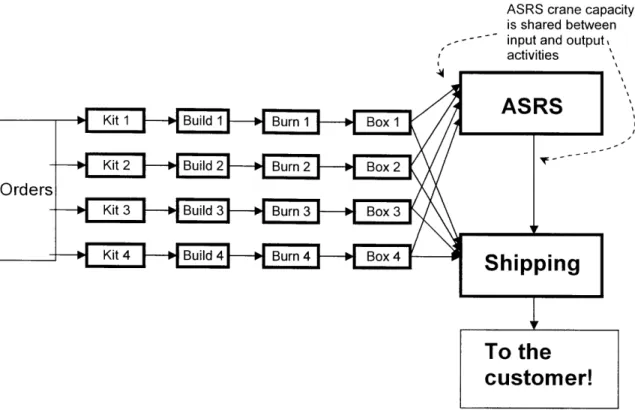
In order to create this product flexibility in Nashville to manufacture both Dimension desktops and OptiPlex desktops, significant changes were required in the Nashville factory layout. The reason for this is illustrated in Figure 1, a simple schematic of Dell's manufacturing process. While most of the factory processes (such as kit, build, bum, and box) "behave" in a similar manner whether the PC being assembled/packaged is a
9 CarolinaNewswire.com, 9 Nov. 2004, 2 Apr. 2005
<http://carolinanewswire.com/news/News.cgi?database=topstories.db&command=viewone&id=2 2 2 2
&op= t>.
Dimension or an OptiPlex, for one area of the factory these two categories of products behave very differently. That area is the Automated Storage and Retrieval System (ASRS), the storage area where partially completed orders of more than one PC are stored until all PCs in an order are ready to be released to a truck for the first leg of
transportation. The need for an ASRS follows directly from Dell's commitment to ship
all systems in an order together and the complication and lack of space associated with storing PCs on the factory floor. Since single PC orders do not have any other PCs to
which they are "tied," they can typically bypass the ASRS entirely, as shown in Figure 1.
Occasionally, individual PCs comprising small-sized orders (of perhaps 2 or 3 PCs) arrive close enough in time to allow the order to entirely bypass the ASRS also. Also, the last PC in an order often can bypass the ASRS entirely, as its arrival at the ASRS triggers the release of the other stored systems in the order. This assumes that the associated accessories (monitors, speakers, printers, etc.) are available and that the downstream operations and trucks are available for the release of the order. Many more details of the
operation and behavior of the ASRS will be explored in Chapter 2.
-ASRS crane capacity is shared between
-- -~ input and output,
activities
cumAeSRS
-- bi Kit2 Bild Bun 2Box 2 Kit 3Buil 3 Brn 3Box 3
Kit 4 Buld Bur 4 Bx 4Shipping
To the
customer!
Figure 1: Schematic of Dell's PC Assembly and Shipping Processes
The reason that the load on the ASRS is much different for OptiPlex desktops than for Dimension desktops is that OptiPlex orders are on average much larger (i.e., a corporate customer is much more likely to place an order of 100 PCs than a transactional, home consumer is.) This basic fact, coupled with Dell's desire to make more corporate PCs
(OptiPlex) in Nashville, shifted the bottleneck of that factory (named EGI) from an earlier stage of the manufacturing process to the ASRS.
1.5 Problem Statement
The shift of the factory bottleneck to the ASRS is at the heart of the internship project
and this thesis.
A more formal definition of the problem statement consists of two parts: 1. Perform a factory flow analysis (at an appropriately chosen level of
sophistication and detail) to understand and characterize the throughput workload and throughput capacity of EGI's ASRS.
2. Develop and implement cost-effective ways to increase the throughput of large
orders of PCs in EGI.
The first phase of the project task was to perform the analysis of EGI's new ASRS
bottleneck (the subject of Chapter 2.) Only on the basis of solid analysis could the
second phase of the project be initiated - brainstorming possible solutions, prioritizing
the feasible options, and implementing changes to alleviate the ASRS bottleneck and thus allow greater volume of OptiPlex (and PCs overall) through the factory (the subject of
Chapter 3).
-Chapter 2: Data Collection and Problem Analysis
2.1 Introduction to Data Collection and Problem Analysis
As stated in Chapter 1, the purpose of the first phase of this internship project was to understand and characterize the throughput workload and capacity of EGI's ASRS. The initial data collection efforts focused on that purpose. In Section 2.2 some details of the design and operations of ASRSs in general and EGI's ASRS in particular will be discussed. Section 2.3 will be a qualitative discussion of the important issues pertaining to ASRS throughput and ASRS storage capacity. Sections 2.4 and 2.5 will present hourly crane workload data and crane timing study data, respectively. Section 2.6 will present "The Crane Frontier," an analytical framework used in this thesis to analyze the crane workload and timing study data. Finally, Section 2.7 will summarize what has been presented in this chapter.
2.2 What is an Automated Storage and Retrieval System and How Does it Work?
Automated Storage and Retrieval Systems (ASRSs) are generally large, 3-dimensional racks of storage space and the associated automation and control systems used to store and subsequently retrieve boxed products (see Figure 2). Notice that the ASRS
comprises a rectangular "solid" of space which often almost reaches the factory ceiling. This geometrical configuration is efficient in its use of factory floor space.
Figure 2: Diagram of Typical ASRS (Similar to that Used in EG1)'0
Automated cranes are used to move the products into and out of storage locations as required by upstream and downstream factory processes. Often, in practice, multiple-shuttle cranes (i.e., cranes which can hold more than one box at once) are used because they increase the throughput of the ASRS system." Figure 3 shows a diagram of a twin-shuttle ASRS crane similar to those used in EG1 and elsewhere.
0 Diagram from daifukuamerica.com. 2004. Daifuku America Corporation. 27 Jan. 2004 <http://http://www.daifukuamerica.com/daifuku/dac/fada/fmlab_2.asp>.
" Russell D. Meller, and Anan Mungwattana, Multi-Shuttle Automated Storage/Retrieval Systems, 3 July 1996, Auburn University, 2 Apr.
2005 <http://filebox.vt.edu/users/rmeller/ms-asrs.pdf>.
-Figure 3: Diagram of Typical Twin-Shuttle Crane'2
Most ASRSs use a number of (often multi-shuttle) cranes to store and retrieve boxes although typically only one crane serves a given storage location (bin). In the case of
EG 1, there are five (essentially identical) cranes, each of which serves an aisle of storage
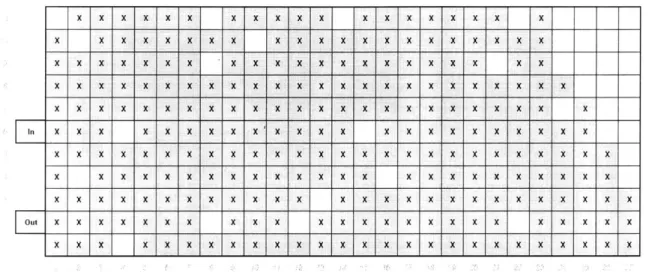
space. Each rack is composed of two opposing sides of storage bins. A row of bins is termed a tier, and a column of bins is termed a bay. A side view of one of the opposing sides of a storage rack (partially filled with loads) is shown in Figure 4. Note that the input and output locations are on the same end of the storage rack and relatively close to one another.
Box Locations X X X X X X X X X X X X IX X X X X X X X X X X X X X X X X X X X X X X X X X X X X X X X X X X X X X X X X X X X X X X X X X X X X X X X X X X X X X X X X X X X X X X X X X X X X X X X X X X X X X X X X X X X X X X X In X X X X X X X X X 'X X X X X X X X X X X X X X X X X X X X X X X X X X X X X X X X X X X X X X X X X X X X X X X X X X X X X X X X X X X X X X X X X X X X X X X X X X X X X X X X X X X X X X X X X X X X X X X X X X X X X X X X X X X X X X X X X X X X X X X X X X X X X X X X X X X X X X X X X X X X
[Diagram courtesy of Michael Hoag, Dell Corporation]
Figure 4: Side View of Half of One of EG I's Storage Racks
Each crane traverses the length and height of the vertical storage racks and is able to service both sides of a storage rack. One set of motors transports the crane along the
length and height of the ASRS. Another motor is used to extend and retract the crane
shuttles into and out of the storage locations once the whole crane body has been positioned adjacent to the appropriate storage location. Because the shuttles can be extended in either direction, each crane can serve the storage rack which resides on either side of the plane of motion of the crane body.
An important aspect of EGI's ASRS is that each crane has two shuttle arms (i.e., is
twin-shuttle) and thus can store or retrieve two boxes at a time (of course, only from the
storage rack "within its reach," as discussed above.) This crane characteristic will be critical to some of the bottleneck alleviation solutions described in Chapter 3.
-Another important point to recognize is that EGI's cranes perform dual duty-they both move PCs from the input to storage locations and move PCs from storage locations to the output (en route to shipping). Thus a twin-shuttle crane can perform two storage actions and two retrieval actions in one cycle, sometimes referred to as a quadruple-command
(QC) cycle. A QC cycle for a twin-shuttle crane can be schematically depicted as
shown in Figure 5 below. The outer rectangle represents the storage rack area, and I/O represents the area where loads are input and output from the system. The arrow points designated as s 1 and s2 represent where the first and second storage actions occur, and the arrow points designated as rl and r2 represent where the first and second retrieval actions occur.
s2
s1
r1
r2
1/O
Figure 5: A Quadruple-Command Cycle Tour'4
During steady-state operation of the ASRS (when many inputs and many outputs are occurring) the crane logic of EGl's cranes is geared toward performing many repeated
QC cycles - that is, two stores, followed by two retrieves, followed by two stores, etc.
" ibid
Indeed, it will be demonstrated later with EGI timing studies that this is the most
throughput-efficient move cycle for twin-shuttle cranes. In one QC cycle a crane executes the following steps:
0 Travel to its own dedicated input conveyor
0 I/O: Extend both of its crane forks to pick up two boxes (one box per fork) and
retract its crane forks (with the boxes now on the forks)
0 Move the crane body so that the box on fork #1 is adjacent to the assigned
(empty) storage location for the box on fork #1
0 s1: Extend fork #1 to store that box and then retract fork #1 (now empty)
* Move the crane body so that the box on fork #2 is adjacent to the assigned (empty) storage location for the box on fork #2
0 s2: Extend fork #2 to store that box and then retract fork #2 (now empty)
* Move the crane body so that the box on fork #1 is adjacent to the first stored box which is to be retrieved
0 rI: Extend fork #1 to get that box and then retract fork #1 (with the box on it)
* Move the crane body so that the box on fork #2 is adjacent to the second stored box which is to be retrieved
* r2: Extend fork #2 to get that box and then retract fork #2 (now the crane body has two boxes on it.)
0 Move the crane body so that it is adjacent to its own dedicated output conveyor
* I/O: Extend the forks to deliver the two boxes (one box on each fork) to the output conveyor
-23-Applying some thought to the input/output interleaving process just described, one realizes that ASRS throughput and ASRS storage utilization are not independent of one
another. Said another way, if the vertical storage racks are very full, it will take the cranes more time to input and output boxes because the cranes will have to travel longer distances to perform the operations.
It is also worth noting at this point that both ASRS throughput and ASRS storage capacity were, at times, bottlenecks for EGI. Each of these events on the factory floor could easily be visually observed. Occasionally, EGI introduced a large amount of OptiPlex orders into the start of the manufacturing process and subsequently one could see the effects of the ASRS bottlenecks. It was not uncommon to see the ASRS storage racks get very full. Then the operation managers would reduce the amount of OptiPlex
orders started in the factory. In fact, a system of guidelines called the "Rules of Engagement" had been established, expressly to avoid the scenario of filling up the storage locations in the ASRS. Many associates (hourly manufacturing line employees) and operations managers recounted vivid stories of how factory operations had been extremely hampered or stopped all together when the ASRS vertical storage racks became full. Sometimes the majority of associates would be sent home early from their
shifts as a result.
Somewhat less dramatic, but much more common at EGi, was having ASRS throughput be the bottleneck. Even if the ASRS storage bins were only half occupied, the cranes were sometimes incapable of storing the arriving boxes fast enough to keep up with the
arrivals. In this case, the boxes arriving at the ASRS input conveyors would back up all the way to the boxing lines (and sometimes further) causing manufacturing personnel to stop production for extended periods of time (sometimes also causing a large number of associates to be sent home early from their shifts.)
Given the observation that both ASRS throughput and ASRS storage capacity were at times bottlenecks for the factory, let us proceed to discuss some frameworks for thinking more deeply about these problems.
EGI's ASRS seems to be a fairly "standard" ASRS (provided by a large, established vendor of such equipment). Thus, many of the lessons learned in the course of this internship should be applicable to other ASRSs.
2.3 Thinking about ASRS Throughput and ASRS Storage Capacity
Normally, ASRSs are sized with some (relatively large) safety factor built in to ensure that enough throughput and storage capacity exists in the factory. Reasons for the large safety factor built into the size of ASRS construction include:
" High cost of throughput or storage capacity shortage. A shortage often leads to
shutting down the factory and/or inefficient labor usage.
" Imprecision and difficulty of factory modeling (conventional or simulation),
leading to uncertainty in ASRS need
" Highly variable box input rate
-* Medium to highly variable shipping rates (a direct determinant of ASRS box output rates)
* Potential for high growth rate of factory throughput required in the future * Potential for shift to product mix which requires more ASRS resources * Higher fixed cost to expand the existing system. (The cost of adding one
additional crane and rack of storage during initial construction is much less than retrofitting the system to add the additional crane and rack later.) This is because a large fraction of ASRS cost is due to the control system and supporting
conveyors. It also stems from the fact that retrofitting often entails moving or dismantling other factory equipment to make room.
Despite these important reasons for making the ASRS large, one cannot make it infinitely large. That is, one must accept at least some risk of the ASRS storage racks being too small (insufficient storage capacity) and/or the input and output rates of the ASRS being too small (insufficient throughput).
In EGI the size of the ASRS was quite sufficient for the first four years of the factory's operation (1999-2003). However, a product mix shift in 2004 (toward the production of more OptiPlex) increased the throughput and storage capacity demands on the ASRS tremendously. In fact, although the ASRS historically had never been considered the bottleneck, it had become the bottleneck with the implementation of the GeoMan project. The amount of product mix shift toward OptiPlex which Dell could enable in EGI was limited by the size and speed of its ASRS.
Refer again to Figure 1 (in Chapter 1), a simple schematic of the manufacturing process at Dell. This figure suggests that for most of the categories of manufacturing steps at Dell (such as kit, build, bum, and box), the capacity scales with the throughput - that is to say, their throughput capacities can be adequately measured by a single number,
measured in units per hour (UPH). This is indeed the case, and EGI manufacturing personnel routinely use this methodology. It is very convenient when such a
manufacturing step is the true bottleneck of the factory because then it is apparent what that "bottleneck throughput" is. However, Figure 1 also suggests that the ASRS step is not a linear process in the sense just described. Because the ASRS input and output processes are both competing for the same shared resource (i.e., a crane's processing time), the throughput capacity of the ASRS is not well characterized by a single numerical throughput rate. In Section 2.6 a new way of characterizing the throughput capacity of the ASRS, "The Crane Frontier," will be presented.
There is a very rough analogy between the operation of an ASRS and that of a bathtub (see Figure 6). The level of water in the bathtub is analogous to how many boxes are stored in the ASRS. In both cases, filling up the storage vessel completely or even almost completely greatly reduces the usefulness of the storage vessel to the operator.
-Input Process
ASRS
Output Process
Figure 6: A Rough ASRS Analogy to Operation of a Bathtub
The faucet represents how quickly water enters the tub, and the drain represents how quickly water exits the tub. At this point, the analogy breaks down somewhat. In the case of the ASRS the maximum input rate is linked to the output rate (because cranes are shared resources.) This is clearly not true in the case of the bathtub. Also, in the case of the bathtub, the water level has an effect on the material output rate-that is, the higher the level, the higher the output rate. In the case of the ASRS, the fullness affects both the input rate and the output rate, and it is negatively correlated with them (as was described in Section 2.2.)
These complexities of design/operation are reasons that factories with designs similar to that shown in Figure 1 are purposefully planned to avoid having the ASRS be the
bottleneck. Given this general context for thinking about the ASRS as a bottleneck, the rest of this chapter will address how to analyze the throughput workload and the
throughput capacity requirements for the ASRS in greater detail15. Chapter 3 will
proceed to address solutions for increasing throughput in EGI's ASRS when it has become the bottleneck. Where possible, generalizations of these EGI results and solutions will be made to accumulative manufacturing processes in general.
2.4 Variability of Hourly EGI Crane Usage Data
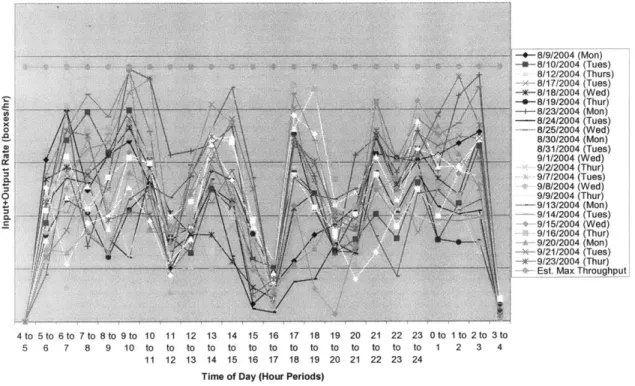
The first steps in the data collection process were to create a database which captured the hourly crane usage and to investigate how the usage varied across different time scales. Independent of this data, simply spending a small amount of time on the factory floor revealed that there was high variability of ASRS crane usage across the day and from day-to-day. Interviews with Dell manufacturing employees made it clear that they were aware of this high variability of ASRS crane utilization across the day but that they had not quantified the variability. Figure 7 and Table 1 contain over a month of (Monday through Thursday) hourly data for the EGI facility. In Figure 7, the y-axis scale has been left out to protect the confidentiality of factory throughput values. The x-axis starts at 4 am on the left and finishes at 4 am of the following day on the right.
" As a result of the commercial importance of ASRSs, the theoretical mathematical framework for analyzing their operation is quite advanced. For example, see ibid for an extensive mathematical treatment of this theory.
--+- 8/9/2004 (Mon) -- 8/10/2004 (Tues) 8/12/2004 (Thurs) 8/17/2004 (Tues) 8/18/2004 (Wed) 8/19/2004 (Thur) - 8/23/2004 (Mon) 8/24/2004 (Tues) 0 --. 8/25/2004 (Wed) Al 8/30/2004 (Mon) 8/31/2004 (Tues) 9/1/2004 (Wed) 9/2/2004 (Thur) 06 9/7/2004 (Tues) 9/8/2004 (Wed) 0 9/9/2004 (Thur) --- 9113/2004 (Mon) 06~ 9/14/2004 (Tues) .E+-9/15/2004 (Wed) - A m-9/16/2004 (Thur) \ e-9/20/2004 (Mon) -- 9/21/2004 (Tues) -*-9/23/2004 (Thur) -- 4- Est. Max Throughput
4 to 5 to 6 to 7 to 8 to 9to 10 11 12 13 14 15 16 17 18 19 20 21 22 23 0 to 1 to 2to 3 to
5 6 7 8 9 10 to to to to to to to to to to to to to to 1 2 3 4
11 12 13 14 15 16 17 18 19 20 21 22 23 24 Time of Day (Hour Periods)
of EG1 ASRS Total Load, Weekdays, 8/9/04 -9/23/04
Hour of the Day Average Total Load, Coefficient of Variation of
Input + Output Total Load, Input +
(Boxes/hour, scaled so Output 100 is maximum) 4 am to 5 am 0 2.36 5 amto 6 am 65 0.33 6 am to 7 am 88 0.41 7 am to 8 am 80 0.39 8 am to 9 am 77 0.40 9 am to 10 am 97 0.39 10 am to I Iam 89 0.33 11 amto 12 pm 48 0.46 12 pm to I pm 65 0.35 I pmto 2 pm 90 0.35 2 pm to 3 pm 86 0.40 3 pm to 4 pm 44 0.51 4 pm to 5 pm 21 0.50 5 pm to 6 pm 85 0.47 6 pmto 7 pm 77 0.45 7 pm to 8 pm 56 0.42 8 pm to 9 pm 59 0.30 9 pm to 10 pm 100 0.25 l0pmto 11 pm 78 0.26 11 pm to 12 am 99 0.19 12 amto I am 90 0.25 I am to 2 am 93 0.28 2 am to 3 am 94 0.31 3 amto4am 6 0.67
One can see a few key patterns from this data:
* Even though ASRS throughput often is the bottleneck of EGI factory flows, total usage across the day is roughly 50% of the theoretical maximum of throughput through the ASRS. (The derivation of the value of theoretical maximum throughput will be shown in Section 2.6. As one might hope, this value
approximately corresponds to the largest hourly output measured at EGI during the data collection period of Figure 7.) This data suggests that there are likely
opportunities to reclaim some of the unused ASRS capacity across the day.
-31 -Table 1: Summary Statistics
" Within a given hour of the day, there is high variability of utilization from day to
day.
" There is a pattern of clear peaks and valleys of utilization throughout the day.
The valleys correspond to shift changes, lunches, and breaks when much of the equipment in the entire factory is idle. (The weekend shifts have different standard hours and thus were not included in the data in Figure 7 and Table 1 above.)
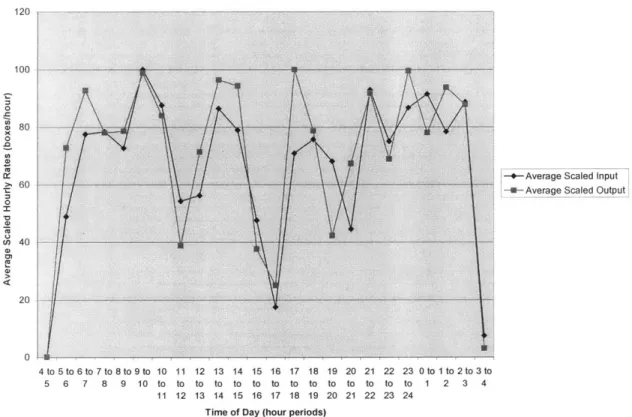
Now, looking at ASRS input rate and ASRS output rate separately, the mean and standard deviation of the same data set is shown in Figure 8 and Figure 9.
120
-100
80
-- Average Scaled Input
0
60 -m-Average Scaled Output
0 n 0 0 4 to 5 to 6 to 7 to 8 to 9 to 10 11 12 13 14 15 16 17 18 19 20 21 22 23 0 to 1 to 2 to 3 to 5 6 7 8 9 10 to to to to to to to to to to to to to to 1 2 3 4 11 12 13 14 15 16 17 18 19 20 21 22 23 24 Time of Day (hour periods)
3.50 3.00 2.50 0 2.00 1L C 0 U C- 1.50 M 0 a,1.00 0 0.50 -- C.O.V. --Input -E- C.O.V. -- Output
0.00L
4 to 5to 6to 7to 8to 9to 10 11 12 13 14 15 16 17 18 19 20 21 22 23 Oto 1to 2to 3to
5 6 7 8 9 10 to to to to to to to to to to to to to to 1 2 3 4
11 12 13 14 15 16 17 18 19 20 21 22 23 24
Time of Day (hour periods)
Figure 9: Coefficient of Variation of EGi Input and Output Rates, Weekdays,
8/9/04-9/23/04
It is apparent from these graphs that there is room for improvement. Details of the improvements recommended and implemented will be given in Chapter 3.
Even the process of showing these graphs to various groups in EG1 manufacturing was a powerful cultural influencer. Dell aspires to (and largely succeeds at) making decisions primarily on the basis of data. A number of manufacturing personnel understood that high variability and sub-optimal utilization of the ASRS cranes existed. However, many of them initially believed that there was little that could be done to really help increase utilization (and thus overall factory throughput). The quantification of and the creation
-of visual representations -of the data constituted an instrumental starting point for motivating a collaborative effort to find ways that equipment and operations could be changed to gain back some of the currently unused ASRS throughput capacity (across the day).
In addition to the within-day and day-to-day variability discussed above, there are often important week-to-week, and quarter-to-quarter variabilities also. Variations across these time scales will not be addressed in this thesis, but the practitioner should be aware of them when performing ASRS analysis and planning.
With this understanding of EGI's ASRS utilization, a more detailed investigation of the details of the crane operation is warranted. The initial data collection effort on this front involved performing timing studies of the crane operation.
2.5 Timing Studies of the Cranes
Because of the recognition that the ASRS cranes were the bottleneck to the whole factory, several improvements to crane performance such as removal of unnecessary waiting time had already been completed prior to the arrival of the author. There was also a general recognition that improvements to the reliability of the cranes (and efficient responses to mechanical crane downtime) would result in more throughput for the ASRS and thus for the factory.
The existing ASRS crane logic rules were not fully documented, so the best method to characterize them was careful observation of crane operation combined with timing studies. (Ongoing work at EGI includes parsing large data logs from which it is possible to obtain much larger amounts of crane timing data.) As background information for the
crane control logic, a few features of EGI's ASRS need to be explained first. These salient features include:
* The input and output areas for each crane are on the same side of the ASRS, one directly above the other (see Figure 4).
* In order to effectively perform the stopwatch timing studies, one needs to be able to simultaneously view the input and output of each crane.
* In order to maintain macroscopic balance between inputs and outputs, each crane tended to alternate between performing store and retrieve operations.
* Because of this interleaving of inputs and outputs, there are only 8 basic crane logic "moves" (cycles) which are possible for each trip of the ASRS crane, namely (2,2), (2,1), (1,2), (2,0), (0,2), (1,1), (1,0), and (0,1). Where the first number in the pair stands for the number of boxes input, and the second number in the pair stands for the number of boxes output. Therefore, a (2,2) means that two boxes were input followed by two boxes being output. In Section 2.2, the (2,2) interleaving move was termed a Quadruple-Command (QC) cycle; its component mechanical operations were listed, and it was diagrammed schematically in Figure 5.
* The queues (input and output) waiting for each of the cranes can be much larger than two boxes. Because of physical limitations on the incoming conveyors, the
-input queue is limited to five boxes for each crane, but the output queue is virtual and thus not constrained.
To obtain a complete picture of crane operation, the cranes were observed during busy times (both during times with biases toward heavy input and times with biases toward heavy output) and during slow times. A disguised (but representative) set of times and other derivative variables for each of the 8 types of moves is shown in Table 2 below. This data set comes from the aggregation of a busy period biased toward inputs, a busy period biased toward outputs, and a number of separately collected (2,2) cycle
Table 2: Summary of EGI Crane Timing Study Data
Move # of Total Crane # of # of Mean St. # of Mean Mean Seq. Crane # of Stops Box Box Time Dev. Data Time/Box Time Stops Box Per Inputs Outputs (sec.) Time Points Move Per
Moves Box (sec.) (seconds) Crane
Move Stop (sec.) (2,2) 6 4 1.50 2 2 85.3 3.24 83 21.3 14.2 (2,1) 5 3 1.67 2 1 73.1 1.36 8 24.4 14.6 (1,2) 5 3 1.67 1 2 72.4 5.44 4 24.1 14.5 (2,0) 3 2 1.50 2 0 48.4 2.15 21 24.2 16.1 (0,2) 3 2 1.50 0 2 52.8 2.5 9 26.4 17.6 (1,1) 4 2 2.00 1 1 * * * * * (1,0) 2 1 2.00 1 0 * * * * * (0,1) 2 1 2.00 0 1 * * * * *
* Each data field indicated with an asterisk corresponds to move sequences for which the sample size was too small to calculate summary statistics.
It can be seen from this table that the most overall efficient move sequence is (2,2) because it has the lowest mean time per box move (21.3 seconds). This is partially a result of the fact that crane stops are very time consuming (compared to actual crane traverse time) and that (2,2) is tied for the smallest crane stop/box move ratio (1.5). As mentioned above, this data is an aggregation that included one time period where inputs were greater than outputs (accumulation) and another time period where outputs were greater than inputs (dis-accumulation). To look at the relative stability of crane moves, it is important to note the relative frequency of the moves in each of these episodes. For the time period where the inputs were greater than the outputs, the frequencies are given in Table 3.
-Table 3: Frequencies of Crane Moves During an "Accumulation" Period Move Sequence (2,2) (2,1) (1,2) (2,0) (0,2) (1,1) (1,0) (0,1) (0,0) Frequency 47 8 0 21 0 0 0 0 N/A
For the time period where the outputs were greater than the inputs, the frequencies are given in Table 4.
Table 4: Frequencies of Crane Moves During a "Disaccumulation" Period Move Sequence (2,2) (2,1) (1,2) (2,0) (0,2) (1,1) (1,0) (0,1) (0,0) Frequency 13 0 4 0 9 0 0 0 N/A
These data indicate that (2,2) is the most common move for the crane. In fact, the ASRS software is written to perform a (2,2) move whenever the input queue and output queue are each two or greater (which is often the case during busy factory times).
The somewhat limited data in Tables 3 and 4 also indicate that (2,0) is more common (i.e., occurs more frequently) than (2,1) and that (0,2) is more common than (1,2). In fact, the ASRS software is written to prefer carrying two boxes instead of just one. (2,0) occurs more frequently than (2,1) because the software system prefers a (2,0) followed by another (2,0) even if a single box is staged to be output.
So, the general observation is that the ASRS software is set up to "prefer" various moves over others. The three dominant moves for the ASRS in the EG1 factory are (2,2), (2,0), and (0,2). This observation gave rise to a framework for analyzing the throughput of EGI's ASRS, which will be referred to as "The Crane Frontier" in the rest of this thesis.
2.6 The Crane Frontier
The Crane Frontier is a way to describe what the maximum possible throughput capability of the ASRS is based on the observation that the cranes are shared resources used to both input and output boxes from the ASRS. Given a certain number of input boxes achieved in an hour, one can deduce (from the timing studies described in the previous section) what the maximum possible outputs achievable are. This pairing of input and output rates will create a "frontier" of maximally possible outcomes.
The three dominant moves described in the previous section will give rise to three points along the Crane Frontier-one corresponding to all inputs (2,0), one corresponding to all outputs (0,2), and one corresponding to an equal matching of inputs and outputs (2,2). What follows is a derivation of these three maximal throughput rate points on the Crane Frontier. From Table 2 it can be seen that the (disguised) length of time it takes to
-39-complete one (2,2) cycle is 85.3 seconds. If (2,2) cycles are repeated for an entire hour, then the total throughput for that hour is:
4 boxes moved
crane * 1 min 25.3 see
(60min)(5
cranes) = 844 boxes moved
hour
Remember that the 4 boxes moved in this equation consists of the 2 inputs and 2 outputs in a (2,2) move. Thus, 422 inputs and 422 outputs can be performed in an hour of repeated (2,2) cycles. Process engineers at the EGI facility had an estimate close to the actual equivalent for this disguised number as the maximum possible throughput of the ASRS.
Similarly, one can calculate the hourly equivalent of the timing study data shown in Table 2 for the (2,0) and (0,2) moves. For the (2,0) move:
2 boxes moved
(60
minfI crane * 48.4 see)
60 see (5 cranes) = 744 boxes moved
1min hour
For the (0,2) move:
2 boxes moved
I crane * 52.8 sec
(60
min 60 see (5 cranes) = 682 boxes movedKmin ( hour(I
(1)(2)
Thus, the total box throughput for the (2,0) and (0,2) moves are somewhat different. An hour of continuous (2,0) moves would result in 744 inputs and 0 outputs, while an hour of continuous (0,2) moves would result in 0 inputs and 682 outputs.
Figure 10 hour long
800
700 /
below shows these three points of theoretically possible crane behavior over an period of time. 600 500 300 200 100
.7
100 200 300 400 500 600 700 800 ASRS Input Rate (boxesihour)Figure 10: Three Feasible Vertex Points Corresponding to (2,2), (0,2), and (2,0) Moves
-41-(0,2) corresponds to 0 inputs and
682 outputs per hour
(2,2) corresponds to 422 inputs and 422 outputs per hour
(2,0) corresponds
to 744 inputs and
Of course, the EG1 factory operation (or any factory with a similar type of flow into an
ASRS) is virtually always in an intermediate state between perfect balancing of ASRS input/outputs and either only input or only output. So, the question remains of how to create a continuous "curve" to connect the three feasible points shown in Figure 10 and thus to define a feasible region of possible hourly throughput for the ASRS.
To address this question, remember that a description of the maximum possible ASRS crane throughput is desired. Consider a frontier of points consisting of an input rate and an output rate, designated as a data pair (input rate X, output rate = X0) which are
possible to achieve given the crane timing studies discussed above. First of all, it is known that this frontier must contain the points (0, 682), (422, 422) and (744, 0) since it has been demonstrated that they are possible (and maximal) with Equations 1, 2, and 3 above. Now let us address the intermediate regimes. Let us make the assumption that for the range where the input rate is less than 422 boxes per hour and greater than 0
boxes/hour, that the first portion of the hour is spent in "perfect interleave mode" continuously performing (2,2) moves (ignoring the complications introduced by
fractional cycles, which were also ignored in Equations 1, 2, and 3 above). Then, when all of the input boxes required for the hour are "used up," so to speak, the crane finishes up the remaining outputs for the portion of the hour which is left. Under this assumption the following Crane Frontier line segment derivation applies.
Crane Frontier valid for Range 0 < Xi < 422: Phase 1: 2Xj
@
844 boxes/hourPhase 2: XO-Xi @ 682 boxes/hour
But, it is also known that Phase 1 and Phase 2 can only take 1 hour to complete in total:
2Xi 844 boxes hour
)
Xo -Xi 682 boxes I hour hourThis is the equation of a line segment which has ends of (0, 682) and (422, 422). (4)
See Figure 11 for a graphical representation of this line segment.
Using exactly analogous logic it is possible to determine the Crane Frontier line segment corresponding to values of ASRS input greater than 422 boxes per hour.
Crane Frontier valid for Range 422< Xi < 744:
Phase 1: 2X0 @ 844 boxes/hour
Phase 2: Xj-X0
@
744 boxes/hourBut, it known that Phase 1 and Phase 2 can only take 1 hour to complete in total:
2Xo 844 boxes hour
)
Xi - Xo Ihour 744 boxes hour)
K
(5) - 43-This is the equation of a line segment which has ends of (422, 422) and (744, 0). See Figure 11 also for a visual representation of this. The "scatter plot" data shown in Figure
11 are actual data points (using the disguised time scale) of individual hours of factory operation at EGi. As expected, all of the EGI actual ASRS throughput data points fall inside the feasible region defined by the Crane Frontier.
800 700 600 500 400 0 300 200 100 100 200 300 400 500 600 Scaled Hourly Crane Input Rate (boxes/hour)
700 800
* Scaled EGI Input/Output Data
a Scaled EG1 Crane Frontier
Figure 11: Scatter Plot of EGI ASRS Hourly Crane Data with Crane Frontier
2.7 Chapter Summary
This chapter first gave an overview of the operations of ASRSs and the qualitative issues related to ASRS throughput and storage capacity. Next, EG1 data of ASRS hourly crane workload and ASRS crane timing studies were presented. Finally, the ASRS Crane
Frontier concept for analytically bounding ASRS throughput capabilities was derived. The Crane Frontier will be revisited several times again in the next chapter in the context of understanding possible ASRS throughput improvements both qualitatively and
quantitatively.