HAL Id: hal-01727370
https://hal-univ-lyon1.archives-ouvertes.fr/hal-01727370
Submitted on 12 Mar 2018
HAL is a multi-disciplinary open access archive for the deposit and dissemination of sci-entific research documents, whether they are pub-lished or not. The documents may come from teaching and research institutions in France or abroad, or from public or private research centers.
L’archive ouverte pluridisciplinaire HAL, est destinée au dépôt et à la diffusion de documents scientifiques de niveau recherche, publiés ou non, émanant des établissements d’enseignement et de recherche français ou étrangers, des laboratoires publics ou privés.
foams
Stéphanie Deschanel, L. Vanel, G. Godin, E. Maire, G. Vigier, S. Ciliberto
To cite this version:
Stéphanie Deschanel, L. Vanel, G. Godin, E. Maire, G. Vigier, et al.. Mechanical response and fracture dynamics of polymeric foams. Journal of Physics D: Applied Physics, IOP Publishing, 2009, 42 (21), �10.1088/0022-3727/42/21/214001�. �hal-01727370�
foams
S Deschanel1, L Vanel2, N Godin1, E Maire1, G Vigier1 and S
Ciliberto3
1Universit´e de Lyon, INSA-Lyon, CNRS UMR 5510, MATEIS, 7 avenue Jean
Capelle, F-69621 Villeurbanne Cedex, France
2Universit´e de Lyon; Universit´e Lyon I; Laboratoire de Physique de la Mati`ere
Condens´ee et Nanostructures; CNRS, UMR 5586, 69622 Villeurbanne, France
3Universit´e de Lyon, ENS-Lyon, CNRS UMR 5672, Laboratoire de physique, 46
all´ee d’Italie, 69364 Lyon Cedex 07, France
E-mail: [email protected]
Abstract. Heterogeneous materials usually break through a process of microcracking that eventually leads to final rupture after accumulation and coalescence of many microcracks. The statistical properties of microcracking rupture have been known to resemble critical point statistics, with many of the physical quantities obeying power law distributions. However, there is no clear understanding of the origin of these distributions and of the specific values observed for the power law exponents. In this paper, we review the special case of polymeric foams that have the advantage of containing a single material component, the polymer, as opposed to usual heterogeneous materials such as composites. First, we review briefly the typical features of the polymeric foam mechanical response up to rupture that have been studied a lot previously. Then, we focus on a less-well-known aspect: the rupture dynamics of polymeric foams. We show that not only polymeric foams behave like other heterogeneous materials, i.e. they display power law statistics, but also, we are able to test the effect on the power laws of the following properties: the foam heterogeneity by changing its density, the foam mechanical response by changing its temperature and the mechanical history by comparing creep tests and tensile tests.
1. Introduction
To apprehend what causes the fracture of materials is a major challenge since fracture is abundant in nature, from earthquakes, to bridge collapses, to avalanches etc. It is then essential to wonder whether there are any precursors that could indicate the imminence of a complete breakdown in order to prevent it. The study of materials’ fracture in sight of a better understanding of damage mechanisms and growth has indeed recently received a lot of attention in the physics community. In order to predict the exact moment of the failure of a material, a new approach has been considered: fracture can be viewed as a critical phenomenon. Interestingly, for some materials, as heterogeneous materials, fracture can be described as a clustering of microcracks, which is one important assumption of this new model. The fact that fracture of heterogeneous materials, such as rocks [1, 2, 3, 4, 5, 6, 7], composite materials [8, 9, 10, 11], cellular glasses [12], plaster [13], concrete [14] or paper [15,16], results from the coalescence and growth of microcracks has long been studied. It has been shown that time delays are generally observed in this case, realised as a process of accumulation and coalescence of microcracks and microdefects leading to the failure of a material.
An important property characterising systems in a critical state is the occurrence of power law distributions. Fracture precursors generate Acoustic Emission (AE): energy or amplitude of the signal and time intervals between two consecutive events are often characterised by power law distributions whose scaling exponents are material-dependent [4, 5, 8, 9, 10, 11, 12, 13, 15, 16]. Scaling exponents have also been widely studied in other conditions as, for instance, in the case of sounds emitted during martensitic transformation, dislocation avalanches or dislocational plasticity [17, 18, 19, 20, 21, 22, 23], snow avalanches [24] and roughness of fracture surfaces of various materials [25]. A large-scale analogy is earthquakes: earthquake occurrence exhibits scaling properties [7,26,27,28,29,30]. Their energies are described by a power-law probability distribution, the Gutenberg-Richter-power-law [26]. So are their temporal correlations and the distribution of the earthquake size is also a power law. Recently, it has been determined that several other statistical features of earthquakes, i.e. their spatial distribution, the rotation of their focal mechanisms, and the stress patterns which both cause and are caused by earthquakes, are also scale-invariant [30].
Besides, numerous models have been proposed in order to better understand the statistical properties of fracture in heterogeneous materials. Most of them describe the vicinity of the critical point of rupture of a material submitted to an exter-nal load [31, 32, 33]. In those models, fracture is preceded with microcracks whose number and average size diverge close to rupture (critical point). The simplest of all the attempts is a model of fibers, introduced 40 years ago by Daniels [34], with randomly distributed threshold strengths known as the random fiber bundle model [31, 33, 35, 36, 37, 38, 39, 40, 41, 42, 43, 44, 45, 46]. Other models have also been developed [27, 37, 47, 48, 49, 50, 51] to analyse the fracture as a phase transition. For instance, according to Andersen et al. [37], disorder in materials is a key point, assumed
to largely affect the nucleation process of microcracks. The disorder is presented as a pertinent parameter inducing a tri-critical transition, distinguishing a scheme where fracture happens suddenly, without preliminary precursors to a second order scheme with characteristic precursors.
Such phenomenon of microfracturation is better observed with materials that have numerous points where microcracks can stop so that global rupture is not controlled by a single event (nucleation and growth of a single crack and no appreciable precursors). An appropriate tool to trace the damage of loaded materials through microfracturing pro-cess is certainly the monitoring of the acoustic emission (AE). To simplify the analysis of the signal, it seems appropriate to reduce the different possible sources of AE events. Therefore, for an easier understanding of fracture dynamics in heterogeneous materials, we have chosen to establish our study on simple materials. As simple materials, we mean materials composed of a single constituent. Indeed, the expected damage mechanisms of such materials may be linked to a reduced number of AE sources, essentially associ-ated to the nucleation and propagation of cracks. Oppositely, the source mechanisms expected during damage growth in composites are numerous including matrix cracking, fiber-matrix interface debonding, fiber rupture and delamination [52, 53, 54, 55, 56]. Also, a will to study materials whose microstructural parameters can be easily adjusted appears: exploring the effect of various parameters on the fracture behaviour is indeed essential. Solid polymeric foams seem to be appropriate for such studies: their pores (heterogeneities) form termination points for the microcracks; temperature permits large changes in the stiffness of the matrix without changing the morphology of the foam; their density can be controlled through the manufacturing process.
Our focus will be placed on closed-cell polyurethane (PU) foams and porous epoxy resins, two simple materials composed of a single constituent. The PU foams studied are made of spherical cells that are closed and isolated from each others, therefore, they can be considered as porous [75]. Their density, degree of heterogeneity (pore size distribu-tion) and mechanical properties can easily be changed, thus providing a broad range of parameters for the study of the fracture dynamics of this kind of materials. The density of the foam is a dominating parameter presented in the literature, it varies with the amount of voids introduced in the foam, the relative density being defined as the ratio of the material density ρ∗ with respect to the density of the material with no voids ρs
(ρ ∗ /ρs, varying from 0.3 to 0.84 for the PU foams we studied). Besides, thanks to a
particle size analysis based on X-ray tomography images of the PU foams of different densities, we noticed an increase in pore diameter with porosity and that the higher the density the sharper the pore size distribution. Therefore, we consider a foam of higher density being less heterogenous and with less disorder (narrower pore size distribution). The mechanical properties of PU foams are altered by changing temperature over a wide range (from −65◦C to 50◦C): with decreasing temperatures, the polymeric foam
T g = 75◦C). The temperature dependence of a polymeric foam is mainly determined by
the matrix [76]. Porous epoxy resins present higher relative densities (0.7 and 0.92) and narrower pore size distributions, thus with less disorder. They present higher modulus, higher strength (uniformity of pore size is required for maximum strength [61]) and a more brittle behaviour than PU foams at room temperature.
Little knowledge is available about the fracture behaviour of polymeric foams while extensive studies on the compressive behaviour have been carried out. Our goal is to supervise the deformation of polymeric foams up to macroscopic failure. Therefore, we will turn our attention to the mechanisms in tension. In order to explore the fracture dynamics of polymeric foams, we choose to study tensile tests at constant strain rate and creep tests subjected to constant tensile load since failure of the specimen is caused by the propagation and coalescence of cracks in these cases. Acoustic emission associ-ated with the microfractures are monitored up to rupture. We record both the spatial and time distributions of acoustic emission emitted by a sample: each microcrack nu-cleation corresponds to a burst of energy that can be localised along the specimen by considering the difference in propagation time between two different detectors [77, 78]. We characterise the statistical properties of AE data, focusing on the distributions of energy ε and elapsed time between two consecutive events δt that are the main charac-teristics describing the rupture dynamics [77, 78]. We inspect the influence of several parameters on those distributions expected to be power law distributed: N(ε) ∝ ε−α
and N(δt) ∝ δt−β respectively. N(ε) represents the probability to obtain AE events of
energy ε and N(δt) the probability to obtain δt long time intervals.
The paper is organised as follows. In section 2, we review the mechanical response of polymeric foams under compression, tension and when submitted to a constant load and we study the effect of various parameters influencing the mechanical properties. Section 3 presents an illustration of the microfracturing process by means of simultaneous AE and fast tomography experiment during a continuous tensile test: AE events are related to specific physical events. In sections 4, 5 and 6 we focus on the statistical analysis of the established fracture precursors being AE energy and time intervals between two consecutive events. Section 4 is dedicated to the effect of the loading history, namely tensile versus creep tests and the following study will be focused on creep tests. We study the influence of density and disorder in section 5 and in section 6, the intrinsic properties of the material (mechanical behaviour) on the distribution of energy and elapsed time.
2. Mechanical response of polymeric foams
The mechanical behaviour of polymeric foams has been attracting the attention of engineers and researchers. Their properties of interest include: low thermal conductivity, high specific modulus, high energy absorption capabilities, low density,
thermal insulation, and low cost. Nevertheless, the microstructural features of polymeric foams (e.g., cell configuration, cell size, strut thickness, etc.) lead to more complexity in material property characterisation as compared to solid polymers. Accordingly, numerous parameters influencing the mechanical properties such as structure of the foam (open or closed cells), loading mode and rate, foam density, temperature, cell orientation (flow and rise-direction), solid polymer material, crack length, etc. have been considered. Extensive analytical and experimental work has been carried out to characterise the elastic and failure behaviours of polymeric foams under multiaxial loading [57, 58, 59]. Gibson and Ashby [57] reviewed the work of a number of other authors on elastic, visco-elastic, plastic yielding and creep responses of both open and closed cell foams. Depending on the nature of the solids from which they were made and on their relative density, foams could fail by several mechanisms, namely, elastic buckling, plastic yielding, brittle crushing or brittle fracture [58].
Besides, the literature contains many attempts to predict the behaviour of these materials, mostly for low density foams. Several models [57, 61, 62, 63, 64, 65, 66] are based on the assembly of geometric symmetric cells (rectangular prism, cubic...) and relate analytically elasticity and yield stress to the foam relative density. Additional approaches have been developed by extension of this kind of model to the non linear domain [67,68] and constitutive models have also been developed [69, 70, 71,72] often with the objective of implementation into finite element codes such as ABAQUS [73,74]. Yet, we will not cover this wide domain in this paper.
2.1. Compressive behaviour
The compressive behaviour of polymeric foams has been especially widely studied: three phases of deformation are commonly observed [57]. The first phase is linear elastic response (due to cellular wall bending), where stress increases linearly with deformation and the strain is recoverable. The second phase is characterised by continued deformation at relatively constant stress, known as the stress or collapse plateau. The final phase of deformation is densification in which the stress rises steeply and where the foam begins to respond as a compacted solid. At this point the cellular structure within the material is collapsed and further deformation requires compression of the solid foam material. The mechanisms associated with the collapse plateau are different, depending on the properties of the cell walls [71]. For flexible foams, the collapse plateau is due to elastic buckling of cell walls. For rigid and brittle foams, plastic yielding and brittle crushing of the cell walls are the main failure mechanisms respectively.
2.2. Tensile behaviour
Under tension, the post-elasticity behaviour of a polymeric foam is controlled by cell wall alignment towards the loading axis and the stress-strain curve is ultimately truncated
by either ductile or brittle fracture [71,57]. Indeed, The primary mechanism governing foam deformation and failure during tensile tests is the bending of cell struts and walls [76,79]. In the case of brittle foams, a crack nucleates at a weak cell wall or pre-existing flaw and propagates catastrophically, leading to a fast brittle fracture. In the case of elastic-plastic foams, like PU foams, an anelastic and plastic plateau is observed until final fracture. Some foams (as rigid polymeric foams) are plastic in compression but brittle in tension. This is because of the stress-concentrating effect of a crack, which can cause cell wall failure and fast fracture when loaded in tension, but which is less damaging in compression [57].
2.3. Creep behaviour
The creep of a foam depends on that of the solid from which it is made [80]. At the simplest level, polymers may be linear viscoelastic, such that in a creep test the strain at any given time is proportional to the applied stress; the constant of proportionality is given by the time-dependent creep compliance. At large strains, or long loading times, many polymers become non-linear viscoelastic: the strain at a given time is no longer linearly proportional to stress. Under constant uniaxial tensile force, the behaviour of the polymeric foam follows the well-known primary, secondary and tertiary creep regimes [81]. The tertiary regime, showing large strains at an accelerating rate is termi-nated by rupture. A theoretical expression for describing the creep strain rate of foams was derived by Andrews et al. [82] from a cell-strut-bending cubic model proposed by Gibson and Ashby [57]. Both theoretical and experimental results indicate that the creep strain rates of foams are significantly affected by their relative density and the creep parameters of solid cell struts [83].
2.4. Parameters influencing strength
The different local deformation mechanisms may be observed by means of different techniques such as X-ray tomography or digital image correlation [74, 84, 85, 86, 87]. For instance, in the case of in situ compression tests combined to X-ray microtomography on closed cell PU foams, Youssef et. al [74] observed mechanisms like bending, buckling and stretching in some location of the foams at small deformation and distortions of cells at higher deformation before a general collapse occurs. The effect of various parameters influencing the mechanical properties has been widely studied. In foams with closed cells (stiffer and stronger than those with open cells), stretching of the lamellae in tension is more effective in bearing stress than folding of the lamellae in compression [76]. In compression, the failure behaviour of low-density foams is dominated by the early collapse of large porous cells which triggers macroscopic fracture of the specimen, whereas high-density foams exhibit more uniform deformation, which results in ductile-like fracture mode under quasistatic loading. At high strain rates, high-density foams fracture at 45◦ of the loading axis, reflecting a shear-dominated failure mechanism,
whereas low-density foams exhibit random macroscopic fracture indicating that the failure behaviour is not shear dominated [88]. The foam stiffness, strength and strain to failure increase with density under quasistatic loading (tension or compression) [67,76,79,88]. In anisotropic foams, strength and stiffness in the direction of elongated cells are higher than perpendicular to it [79, 76]. Polymeric foams are also sensitive to strain rate and temperature [71]. Subhash et al. [88] and Ouellet et al. [89] showed that some polymeric foams in compression, such as epoxy-based, expanded polystyrene and high-density polyethylene foams, exhibited increasing yield stress, collapse plateau and failure strength with increasing strain rate while the strain to densification and to failure decreases. These effects are enhanced with increasing material density. On the other hand, Ouellet et al. [89] highlighted an interesting stress-strain response under dynamic loading for PU foams: large scale fractures and ejection of material was noted at intermediate rates, leading to a reduction in collapse plateau strength compared to the low rate tests.
2.5. Experimental results on PU foams
In the following, we will turn our attention to the tension mechanisms in particular as we would like to focus on the fracture behaviour of polymeric foams, for which little knowledge is available. Fracture properties of polymeric foams have been mainly characterised in terms of fracture toughness [86,90,91,92,93,94], mostly for rigid PU foams. The fracture failure has usually been treated by the concept of linear-elastic fracture mechanisms [57] considering that the rigid polymeric foams studied showed a linear-elastic response in tension. The fracture toughness is found to be strongly dependent on the foam density, the nature of the solid polymer material and the level of polymer cross-linking [94]. Nevertheless, we will not develop this aspect of fracture behaviour of polymeric foams and we will concentrate on understanding the fracture dynamics through the study of tensile tests and creep tests, where failure of the specimen is caused by the propagation and coalescence of cracks.
We will now focus specifically on tensile and creep tests on polyurethane foams. Tensile tests at constant strain rates are performed on PU foams up to rupture: for all the relative densities, tests are performed at room temperature and for PU foams of 0.5 and 0.58 relative densities at different temperatures (50◦C, 26◦C, −10◦C, −20◦C,
−30◦C and −65◦C). Creep tests at a constant load are also performed up to rupture
on PU foams, in temperature. Note that the details of the materials processing, the experimental set-up and the recording of Acoustic Emission are given in [77, 78].
Figure 1 shows the effect of relative density and temperature on the mechanical behaviour in tensile test of PU foams. In coherence with the literature, Figure 1a illustrates the increase in strength and Young modulus with increasing density and Figure 1b shows the same increase with decreasing temperature. The dependence in temperature can also be linked to the rate dependance: a decrease in temperature
0 0.01 0.02 0.03 0.04 0.05 0.06 0.07 0 5 10 15 20 25 30 Strain ε Stress σ (MPa) ρ*/ρ s=0.30 ρ* /ρ s=0.84 0.38 0.58 0.66 0.80 Room T° a) 0 0.01 0.02 0.03 0.04 0.05 0 5 10 15 20 Strain ε Stress σ (MPa) 26°C −10°C −65°C −30°C ρ* /ρ s=0.58 b)
Figure 1. Effect of relative density and temperature on the mechanical behaviour, in tensile tests, of PU foams.
is similar to an increase in strain rate‡. Effectively, it has been observed that the initial slope and the maximum load increase with increasing loading rate [94]. Figure
1b highlights the transition in behaviour from ductile to more brittle with decreasing temperatures as shown by the disappearance of the plastic plateau at the moment of rupture. Below −20◦C, the tensile stress-strain curves show mainly an elastic response
of the material, while above that temperature, they show also a stress plateau that corresponds to plastic flow of the material. When the breaking of the material occurs in the elastic part of the stress-strain curve, the rupture is said to be brittle.
An effect of temperature can also be seen when performing creep tests. The strain
0 0.2 0.4 0.6 0.8 1 0 0.2 0.4 0.6 0.8 1 t / τ ε p / ε p r 50°C 26°C −20°C −30°C b)
Figure 2. Strain normalised to strain at rupture as a function of time normalised to
rupture time for creep tests on PU foams (ρ∗/ρs= 0.54±0.4) at different temperatures.
‡ To obtain a similar viscoelastic and plastic behaviour, strain rate must be increase much more than
the decrease in temperature (experimentally for PU foams, increasing strain rate of a decade corresponds
of the sample in a creep test can be separated into two components: one elastic ²e and
one plastic ²pso that the total strain is ² = ²e+²p. The elastic strain is the instant strain
reached when the load is applied (and depends on temperature through the evolution of the modulus). The plastic strain is time-dependent and its evolution depends on temperature as can be seen in Figure2showing ²p/²rp as a function of rescaled time t/τ ,
where ²r
p is the plastic strain at rupture and τ is the rupture time. At high temperature,
the plastic strain evolves almost linearly with time. As temperature is lowered, the time evolution of the plastic strain becomes more and more non-linear.
3. Correlation between acoustic emission and evolution of the microstructure
When a heterogeneous material sample is loaded, there is a time delay before the material fails due to the occurrence and coalescence of microcracks which radiate acoustic signals of broad energies prior to rupture [1, 2, 3, 4]. In our experiments, the acoustic activity is recorded and is correlated to the mechanical behaviour up to the macroscopic fracture, through the use of parameters like the cumulative number of events or the cumulative energy released [77, 78]. In addition, the position of microcracks is recorded along the specimen length. Spatial localisation of AE is a technique which has been widely used in seismography, the study of rock fracture [1,2,3,4,95,96,97,98] or composite materials damage [9,10,54,99,100,101,102] especially to map the nucleation and development of fractures. In our set-up, as we use only two sensors, the knowledge of the wave speed in the material and the difference in arrival times at each sensor of a given wave gives access to linear location [77]. Besides, a way to illustrate and ascertain the microfracturing process in polymeric foams and to understand the correlations between AE events and the microstructure is to combine the monitoring of AE with an X-ray tomography technique during mechanical tests. X-X-ray tomography is a powerful technique allowing the characterisation of materials through a three dimensional and non destructive visualisation. It has been shown that it is a good way to study cellular materials at the scale of their cellular microstructure [103]. Moreover, this method can also give access to the local mechanisms of deformation [74, 85], at a scale close to that of the cell scale and can show for instance the heterogeneity of the deformation of this cell [84]. Now, the added value in our study is the addition of the AE method to the in situ tensile tests, carried out on PU foams’ samples of relative densities from 0.4 to 0.9 at room temperature. This combined technique has also been used for the study of damage in metals [104]. During tensile tests performed at constant velocity, deformation mechanisms are analysed and a correlation between AE signals and microscopic cracking events is investigated. The specimens of PU foams that we studied [77] are loaded with a special rig designed for this purpose [105]. A PMMA tube, carefully polished to ensure that it does not affect X-ray absorption, ensures transmission of the load between the upper mobile grip and the lower fixed one. Force, displacement and acoustic activity are recorded during the test. The different samples are imaged at the initial state and
different levels of tensile strain (Figure 3). The different shots cannot be performed under stress due to creep motion of the sample during the time needed for recording an image. Thus, we attempt to immobilise the microstructure after each step of deformation by decreasing largely the applied force before taking each shot. In addition, once the sample is unloaded, the material still moves due to a relaxation process and we have to wait long enough for the relaxation to be completed in order to avoid blurring of the image. Hence, the level of strain at which shots are taken corresponds essentially to the amount of plastic strain accumulated in the sample. Our observations are shown as 2D slices numerically extracted from the 3D images. Note that AE events are recorded during the test,under tensile stress, before the release of the load.
Figure 3. Stress versus global strain during in situ tensile test on PU foam of relative density 0.9. Black dots correspond to the different shots taken at (1) the initial state (2) 2.5%, (3) 8.8%, (4) 15.4%, (5) 18.8% and (6) 25% local strain.
Figure4presents the results of an in situ tensile test for a PU foam of relative density 0.9, the images being taken at the initial state, 2.5%, 8.8%, 15.4%, 18.8% and 25% local strain§ (the black dots on Figure 3 represent where these images have been taken). At the same time, the mechanical stress versus strain is observed and we correlate this evolution to the number of AE events for each step.
We notice that there is no measured AE events at the beginning of the loading (no events before point 3). This may be due to the absence of damage. Indeed, we notice that deformation of the material appears without any breaking of walls between pores, which is the case for the initial state (point 1) and 2.5% local strain (point 2) in Figure
4. As soon as AE events are recorded, we immobilise the state of the microstructure by unloading the sample back to point 3 and take an image at this point. AE activity only starts above a certain degree of strain, where walls between cavities begin to break. One can notice that the growth of a crack ends as soon as it encounters a pore: this can be seen in the 2D tomographic slice of 8.8% local strain (point 3) in Figure 4. Thanks
§ Local strain is calculated relatively to the displacement of two points on different images. Global
deformation refers to the nominal strain (L − L0)/L0, determined with the crosshead displacement of
Figure 4. In situ tensile test on a PU foam of 0.9 relative density . 2D extracted tomographic slices are taken at the initial state, 2.5%, 8.8%, 15.4%, 18.8% and 25% local strain. For each stage, the shots and the mechanical behaviour are correlated to the acoustic activity.
to the spatial localisation of the AE events, we are able to ascertain that AE events correspond to damage. Once more, when AE are recorded, the structure is immobilised and shot (point 4 at 15.4% of local strain): AE signals would represent here ligament breaking between adjacent pores perpendicular to the loading direction. This picture is consistent with Dawson et al. [106] who showed that the structure of rigid closed-cell polyurethane foams can be seen as a network of struts within which the roughly dodecahedral closed cells are formed by thin membranes of material stretched between the appropriate struts to form the cell walls. Crack propagation in such a structure can be understood as the failure of the cell struts at the tip of the crack, the membranes attached to the struts offering little resistance to crack growth but simply tearing and ”notching” the next strut to which they are attached at the end of the tear [91].
At 18.8% of local strain (point 5), some other ligament breaking occurs and cracks start to propagate. Crack propagation becomes more important towards the end of the test (25% of local strain point 6). The separated events lead to a bigger one: the microcracks coalesce and culminate in the catastrophic rise of a global crack implying the material’s total fracture. This is also coherent with what Ridha et. al [79] found important to be considered in formulating an idealised cell model for rigid PU foams: the fact that fracture in polyurethane foam occurs perpendicular to the loading direction, via crack propagation through both struts and cell wall membranes
Finally, the correlation we presented between acoustic activity, X-ray images and mechanical behaviour, suggests that the concentration of microcracks can help assessing the degree of damage suffered by the material (also shown in [9]) and thus give a good indicator that the sample is approaching failure. Likewise, in their study of fracture in porous media, Shahidzadeh-Bonn et al. [107] showed that the average fracture proba-bility is given by the probaproba-bility of crack nucleation. Alternatively, in their model of continuum damage mechanics, Turcotte et al. [7] introduced a damage variable, the increasing value of which quantifies the weakening of the material associated with the increase in the number and size of microcracks in the material. In our study, we are also able to relate the rate of increase in damage to the rate of AE events, announcing the forthcoming fracture of the polymeric foam. In the same way, in his study of fatigue crack growth in rigid PU foams [108], Noble assumed that AE events present at or close to peak load can be associated with strut failure and that the rate of crack advance depends on the number of strut failures in each cycle.
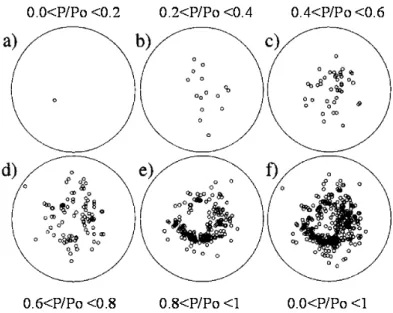
Among others [4, 5, 6, 12, 14, 15, 109], this microfracturing process has also been observed by Guarino et al. [8, 9, 10, 11] on different materials. Figure 5 [8, 9] represents the localisation of the microfractures in a sample of chipboard wood plate as load is increased. At the beginning, microfractures are roughly uniformly distributed. Afterwards, they begin to concentrate and to nucleate, eventually producing a major fault: final failure taking place in these nucleation sites. A correlation of the AE events with the exact localisation of the cracks happening in the material was then presented. Nevertheless, we understand the interest and strength of the AE/tomography
Figure 5. 2D localisation of microfractures for a wood sample as load (pressure) is increased. The microfractures occurring at five equal pressure intervals are represented
in plots (a) to (e) (P/P0 is the normalised pressure, P0 being the fracture pressure).
Pressure grows from (a) to (e). In (f) all the microfractures occurring during the run are plotted. [8, 9]
association as it is important to understand to which specific physical events occurring in the material the different AE events correspond and to visualise the exact different steps in the microfracturing process.
4. Influence of loading mode
Henceforth, we will concentrate our attention on the statistical analysis of the introduced fracture precursors by studying the probability distributions of the AE energy released during the damage process and time intervals between two consecutive events. These distributions have been computed including all the localised AE data for each condition (all the tests performed at one specific temperature, for one relative density of foam) and using logarithmically-spaced bins in order to increase the range of energy accessible in the statistical analysis. The exponents α and β have been estimated using a linear fit of the distributions in log-log scale and the error on the slope is given for a 90% confidence interval that is based on the dispersion of the data around the fit. Besides, to proceed with the study of the dynamics of damage during loading, we inspect the time evolution of the rate at which AE events occur. In this section, we first want to probe the influence of test conditions on these distributions. Namely, we compare two loading modes: tensile and creep tests.
4.1. A case study
We present here two specific tests experienced at −30◦C on PU foams of relative density
ρ ∗ /ρs = 0.54 ± 0.4. The mechanical behaviour of a tensile and creep test is presented
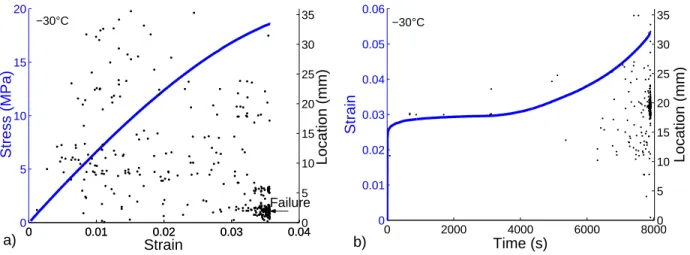
in Figure 6with the corresponding location of AE signals along the specimen.
0 0.01 0.02 0.03 0.04 0 5 10 15 20 0 0.01 0.02 0.03 0.040 5 10 15 20 25 30 35 −30°C Stress (MPa) Strain Failure Location (mm) a) 0 2000 4000 6000 8000 0 0.01 0.02 0.03 0.04 0.05 0.06 Time (s) Strain 0 5 10 15 20 25 30 35 Location (mm) −30°C b)
Figure 6. Mechanical behaviour and linear location of AE signals along the specimen
for PU foams (ρ ∗ /ρs= 0.54 ± 0.4) at −30◦C: a) tensile test b) creep test
Figure 6a illustrates the early start of acoustic activity for tensile tests at low temperatures where the material is more brittle. This indicates the early appearance of microcracks in the material. Initially, the microcracks appear to be randomly distributed across the specimen; as their number increase towards the end of the test, they tend to localise and coalesce in the region where the final rupture occurs. Note that the tensile behaviour at room temperature of porous epoxy resins, whose pore distribution is narrower and disorder more important, is quite similar [78]. Epoxy resins show an identical quasi-brittle behaviour without plastic plateau in the stress-strain curve. The early occurrence of damage events is also observed, the number of AE events rises rather gradually as the stress increases and the AE signals are shown to emanate from sources spread all over the specimen.
For a creep test at −30◦C (Figure 6b), with σ/σ
r ≈= 0.95 where σr is the
corresponding rupture stress in a tensile test, we note few events occurring at the beginning of the test, when the material is loaded and almost none during the primary regime and the transition zone where strain rate is stabilised. Acoustic activity increases afterwards with strain rate, during the tertiary regime. The microcracks concentrate and coalesce at the end of the test in the final failure zone.
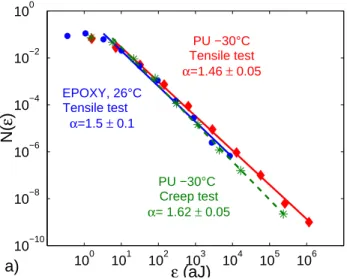
The inspection of the energy and time distributions for tensile tests on PU foam at −30◦C and epoxy at room temperature gives similar results, presented in Figures 7
and 8. The energy is power law distributed, N(ε) ∝ ε−α, with a comparable value of
the α−exponent (Figure 7, α ≈ 1.5). On the other hand, the time intervals are not distributed according to a scaling law but, still, the distributions are almost identical
100 101 102 103 104 105 106 10−10 10−8 10−6 10−4 10−2 100 ε (aJ) N( ε ) PU −30°C Tensile test α=1.46 ± 0.05 EPOXY, 26°C Tensile test α=1.5 ± 0.1 PU −30°C Creep test α= 1.62 ± 0.05 a)
Figure 7. Probability distributions of energy obtained for tensile and creep tests on
PU foams (relative density 0.54 ± 0.4) at -30◦C and for tensile tests on porous epoxy
resins (relative density 0.92) at room temperature.
(Figure8): if we extract power laws before and after the mean value of δt, the respective exponent values are very close. Note that in the case of creep test, not only the energy is power law distributed, with an exponent α = 1.62 ± 0.5 (Figure 7) but also, the elapsed time is much closer to a power law distribution with an exponent β = 1.33 ± 0.9 (N(δt) ∝ δt−β) (Figure 8). 100 101 102 10−1 10−2 10−3 103 10−5 101 10−3 10−1 103 PU −30°C Creep test β= 1.33 ± 0.09 δ t (s) N( δ t) PU −30°C Tensile test EPOXY, 26°C Tensile test b)
Figure 8. Probability distributions of time intervals obtained for tensile and creep
tests on PU foams (relative density 0.54 ± 0.4) at -30◦C and for tensile tests on porous
4.2. Conditions for power law distributions
It seems from this example and from the investigation of tensile tests on PU foams at different temperatures in [77] that the energy is always power law distributed. This has also been shown in the literature and for instance Kuksenko et al. showed in their study of scaling characteristics of rock fracture [6] that the fracturing system evolves without a characteristic energy scale, independently of the driving mode: constant α−value= 1. This exponent value differs from the ones we obtain here. However, note also that intermediate values can be observed such as for the statistics of acoustic series detected in tensile failure experiments on ordinary paper sheets [15] where the energy-release exponent is 1.25 ± 0.10).
On the other hand, we have shown that the brittle or ductile nature of the material affects the distribution of waiting times. Indeed, the existence of a power law for time intervals between events seems to require a quasi constant stress during the rupture process. A power law was observed when AE events occur at constant stress (creep tests) but not when the mechanical behaviour is mainly an elastic response (tensile tests at low temperatures for PU foams and at room temperature for epoxy resins) [77]. Similarly, Kuksenko et al. [6] showed that the statistics of waiting times between AE bursts is more sensitive to the driving mode than the energy-release distribution. The values they found for the β−exponent (time distributions) differ with the driving modes: when the loading was performed at a constant rate of deformation, they found βI = 0.9
and when the axial compression was controlled by the intensity of the fracture process itself, they found βII = 1.7. Note that the series of AE signals from volcanic rocks (field
observation [5]) gave an intermediate value of β = 1.2, which is not too far from the value we found here.
4.3. Statistical properties at different stages of the rupture process
We have seen that time appears as an important control parameter of the failure process. Now, the statistical properties that we studied correspond to all the events recorded during a test and we may wonder if the distributions are similar when approaching final failure or at the onset of deformation. Indeed, it might be important to consider the fact the rupture dynamics is not a stationary process during the whole experiment. Carpinteri et al. [110] for instance showed that the α−value changes systematically during the different stages of the failure process. Their experiments on different types of specimens showed that the α−value is approximately equal to 1.5 at the condition of criticality, when the external load equals the peak load and in the later stages of damage evolution, when the final failure is imminent, the α−value tends towards unity. Kuksenko et al. [6] also highlighted sensitivity of scaling properties of the fracture process to the current state of the continuously loaded sample but they found an α−value in the final period of controlled loading significantly higher than that at the initial stage (4.50 ± 0.06 against 1.35 ± 0.05). In the examples we presented of tensile and creep tests at −30◦C and when power law distributions occur, we have checked that energy and
time are power law distributed over different time windows, with a slightly increasing value of exponents for the period close to failure. Nevertheless, the variation of the exponent values may be due to the lack of events recorded at the beginning of the test while 90% of the AE events are recorded in the last third of time. In the case where time windows include the same number of events, we observed that the exponents values do not change substantially. Consequently, we will carry on with distributions of all the events.
4.4. Conclusion
To sum up the discussion on the loading mode influence: in the case of tensile tests, specific conditions are needed for the microcracks occurrence to exhibit scaling properties. On the other hand, both the temporal correlations of microcracks and the distribution of the energy are power law when the material is submitted to a constant load (in our example, at −30◦C). Note that our experiments have been performed only
at few different load levels and that it could be interesting to probe the influence of applied stress level. Nevertheless, for all the few levels tested and even when σ/σr was
close to 1, energy and time was power law distributed in creep tests. Moreover, it has been shown that the probability density function of energies [11, 23] and time intervals [11] obey a power law distribution independently of the applied load.
That is why, later on, we will focus on creep tests. Besides, when we try to understand the time evolution of the rupture precursors, it seems more relevant to study creep tests, where an imposed constant load is applied, since the material can deform freely. Inversely, in the case of tensile tests, there is a competition between the relaxation times spectrum of the polymer and the characteristic time imposed by the applied constant strain rate that could prevent us from understanding the proper dynamics. Experiments on granite [6] evidenced that the constant strain-rate loading reduces the times between subsequent fracture events and suppresses the relaxation process. Also, Guarino et al . [9] proved that if strain is imposed, the cumulative AE energy does not diverge at the critical point. On the other hand, if stress, instead of strain, is imposed, Guarino et al [9] observed a divergence of the cumulative energy and suggested an analogy between fracture and critical phenomenon. Moreover, many fracture experiments have been performed at imposed stress [12,20].
5. Influence of heterogeneity
Does the microstructure affect the scaling properties of the fracturing system? To answer this question, we probe the influence of the relative density of PU foams, hence the heterogeneity, on the energy and time distributions. For the relative densities of PU foams tested, from 0.3 to 0.84, the energy and time intervals are always power law distributed. This shows experimental evidence for scale-invariance, but do the distributions have exponents of universal values?
Figure 9 illustrates the stable value of the power law exponent of the AE energy distributions, independently of the material porosity.
0.2 0.4 0.6 0.8 1 0.8 1 1.2 1.4 1.6 1.8 2 Relative density Scaling exponent β (δ t) α (ε) Creep tests β (δt) α (ε)
Figure 9. Values of scaling exponents α related to energy distributions N (ε) ∝ ε−α
and β related to elapsed time distributions N (δt) ∝ δt−β obtained for creep tests as a
function of relative densities of PU foams, at room temperature. Error bars represent the error on the exponents obtained from the slopes of linear fits in log-log scale. Lines are linear fits of the exponent values.
Indeed, considering the error bars on the exponents obtained at different relative densities of foams, we may state that the different values of scaling exponents remain quasi constant with a mean value of < α >= 1.58 ± 0.08. For the values of exponent β related to time distributions, Figure 9 shows a slight increase with relative density. However, the mean value of the exponent < β >= 1.18 ± 0.09 stays mostly in the error bars. Thus, the value of the scaling exponents seems little influenced by the heterogene-ity of the material or disorder.
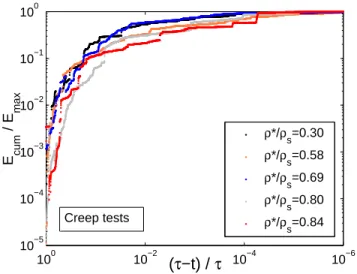
Information about the rupture dynamics can also be given by the cumulative energy plotted as a function of reduced time (τ − t)/τ , τ being the breaking time (Figure 10).. Indeed, the cumulative energy is a global measure which enables an estimation of the amount of damage during loading. Figure 10 exhibits the cumulative energy Ecum,
normalised to Emax -being the total energy at time τ -, as a function of the reduced time
for several relative densities of PU foams at room temperature for creep tests.
The shape of the cumulative energy is rather reproducible for all the relative densities of PU foams inspected, highlighting the fact that the microstructure of materials is not a parameter of influence in the fracture dynamics.
10−6 10−4 10−2 100 10−5 10−4 10−3 10−2 10−1 100 (τ−t) / τ E cum / E max ρ*/ρs=0.30 ρ*/ρs=0.58 ρ*/ρ s=0.69 ρ*/ρs=0.80 ρ*/ρs=0.84 Creep tests
Figure 10. a) Normalised cumulative energy Ecum/Emax and b) normalised
cumulative number of events (Ncum/Nmax) as a function of reduced time (τ − t)/τ
for creep tests at room temperature on PU foams of several relative densities
6. Influence of mechanical behaviour
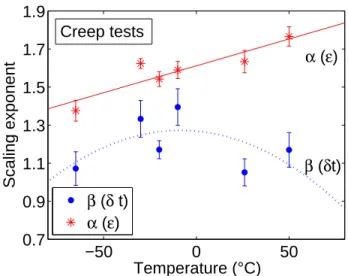
To carry on with the study of the rupture dynamics of polymeric foams, we probe the influence of mechanical properties on the value of the power law exponents and on the time evolution of damage during loading. To do so, the PU foams are tested at several temperatures (from −65◦C to 50◦C) so that the rupture is transitioning from brittle
to ductile (we note a transition between the two behaviours around −20◦C). Figure
11 pictures the evolution of the exponent values α and β with temperature. The α-exponents of energy distributions increase slightly with temperature when the PU foam undergoes a transition from brittle (α = 1.37±0.11 at −65◦C) to ductile (α = 1.76±0.10
at 50◦C).
Figure 11 also presents the variation of the β−exponent with temperature. Although it is difficult to make a definitive conclusion, it seems that the exponent values follow a quadratic function with temperature or at least the values of the scaling law exponent seem to increase first with temperature up to a temperature of about −10◦C (β−value going from 1.07 to 1.4) before decreasing again (up to β = 1.17). This
temperature is very close to the noticed brittle/ ductile transition in the mechanical behaviour.
Hence, the exponents α and β seem to be mainly related to the mechanical behaviour (related to the intrinsic property of the material whether it is brittle or ductile) rather than to the microstructure of materials.
Nevertheless, the repeatedly constant occurrence of the power law statistics for energy and time distributions when the material is submitted to a constant load (independently of the microstructure and mechanical behaviour of the material), evidences the presence of correlations without characteristic scales and suggests a critical
−50 0 50 0.7 0.9 1.1 1.3 1.5 1.7 1.9 Temperature (°C) Scaling exponent β (δ t) α (ε) Creep tests β (δt) α (ε)
Figure 11. Values of scaling exponents a) α related to energy distributions N (ε) ∝
ε−α and b) β related to elapsed time distributions N (δt) ∝ δt−β obtained for creep
tests as a function of temperature (for PU foams of relative densities 0.54 ± 0.04). Error bars represent the error on the exponents obtained from the slopes of linear fits in log-log scale. Lines are linear fits of the exponent values.
dynamics. These observations are in agreement with past studies. It is specifically the case for the values of the α−exponent found since the previously reported values vary from 1 to 2 in different fracture experiments. The α−value exponent is found to be in the range [1−1.5] [3,4,5,6] in rock fracture experiments of various kinds; for creep tests on wood the exponent is around 1.2 [8, 9], increasing up to 1.5 ± 0.05 with increasing load [11]; for creep experiments on cellular glass [12]: α = 1.5 ± 0.1 and for plaster samples subjected to external uniaxial elastic stress [13]: α = 1.3 ± 0.1. Likewise, an exponent range from 1.4 to 1.7 was obtained whatever the shape of the sample and the applied load, in the case of fatigue tests on a 304L austenitic stainless [23]. The exponent is a little higher for fiberglass 2.0 ± 0.1 [8] in the case of constant loading rate. The range of β−value found in the literature is wider, going from 0.6 in the case of plaster samples [13] to 2.7 ± 0.1 for fiberglass [8]. Yet, the β−values we present are not too far from the ones found for volcanic rocks (β = 1.2) [5] or cellular glasses (β = 1.27 ± 0.01) [12].
Therefore, the values of scaling exponents differ from one material to another, and depend slightly on the mechanical properties of the material, although the range of values is somewhat restricted. But the very fact that the AE events follow power law distributions with several scaling exponents still need to be linked to a physical mechanism. For instance, the role of the exponent in diverse representations of the fracture statistics was analysed by Olami and co-workers [64, 29]. Nevertheless, a real physical meaning to these exponents still need to be given.
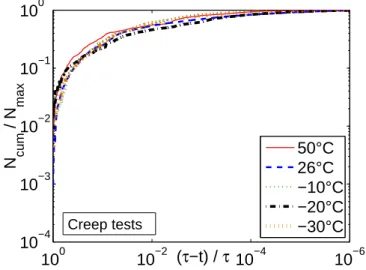
Now, to have more information about the rupture dynamics according to the mechanical behaviour, we inspect the time evolution of the normalised cumulative
number of events at different temperatures in log-log scale. We notice that a single behaviour seems to prevail for creep tests (Figure 12). Indeed, once rescaled by the rupture time, the rupture dynamics of the material submitted to a constant stress does not seem to depend on the mechanical properties of the material anymore. This means that all the dependence of rupture rate on applied stress is taken into account by the value of the rupture time. Therefore, the time evolution of the rate at which events occur seems to present universal features. This outstanding result would suggest that it is possible to relate lifetime with dynamical properties of rupture precursors. Nevertheless, we have to bear in mind that it remains unclear if such a connection can be extended or not to the case of more complex loading conditions, as usually obtained in practical situations. 10−6 10−4 10−2 100 10−4 10−3 10−2 10−1 100 N cum / N max (τ−t) / τ 50°C 26°C −10°C −20°C −30°C Creep tests
Figure 12. a) Normalised cumulative energy Ecum/Emax and b) normalised
cumulative number of events (Ncum/Nmax) as a function of reduced time (τ − t)/τ
for creep tests on PU foams (relative density 0.54 ± 0.04) at different temperatures.
7. Concluding remarks
In the case of fracture, the rupture dynamics of heterogeneous materials usually involves many rupture events at a microscale (microcracks) that are precursors of the macro-scopic failure. These precursors generate acoustic emissions that are characterised by power law distributions. Such microfracturing process has recently received a lot of attention in the physics community, with several experiments on different materials and statistical models developed. Solid polymeric foams seem particularly appropriate for such studies as their pores (heterogeneities) form termination points for the microcracks, so that global rupture is not controlled by a single event, and as the possible sources of AE are essentially associated to the nucleation and propagation of cracks. Simultaneous AE and X-ray tomography experiments during continuous tensile tests on polyurethane foams allowed us to ascertain the correspondence between AE and physical events: the
catastrophic fracture in polymeric foams is indeed the result of a sequential process of the nucleation, growth, and coalescence of numerous microcracks. To understand the underlying physical mechanism in such a complex process, one must understand the dynamics by which it proceeds and a prior knowledge of the mechanical behaviour up to rupture is of importance. A large number of parameters influence the mechanical response of polymeric foams, it is thus difficult to draw general rules. The density of the foam, loading mode, strain rate and temperature are dominating parameters presented in the literature. As a matter of fact, the density and degree of heterogeneity (pore size distribution) of polymeric foams can easily be adjusted and their mechanical properties can simply change with temperature. One typical result is the increase in stiffness and strength with increasing density, increasing loading rate and decreasing temperature. A transition in behaviour is noticed for PU foams from ductile to more brittle with decreasing temperatures as shown by the disappearance of the plastic plateau at the moment of rupture. An analogy can thus be done between tensile tests at temperatures above −20◦C for which the tensile stress-strain curves show a stress plateau and creep
tests for which stress in constant.
In the main part of the review, we focused on the statistical analysis of the fracture precursors, AE energy and time intervals between two consecutive events. We first highlight a constant occurrence of power law statistics for energy distributions, independently of the loading mode, the material density or the mechanical behaviour. Hence, the system has no characteristic length and is in this sense critical. Therefore, we ascertained experimental evidences that scale invariance in energy is a robust property of microfracturing processes. Nevertheless, this invariance and the meaning of the exponents value, which are constant with density and slightly increase when material is more ductile, is still in need of a full theoretical explanation.
Besides, time appears as an important control parameter of the failure process. With the study of tensile versus creep tests, we showed that the time intervals distributions need conditions where the stress is quasi constant during damaging in order to present a power law. Alternatively, our tensile and creep experiments give some indications that could help to understand the time evolution of the rupture precursors. In the case of creep tests where an imposed constant force is applied, the material can deform freely. In the case of tensile tests however, there is a competition between the relaxation times spectrum of the polymer and the characteristic time imposed by the applied constant strain rate. Focusing on creep tests, we have shown that time distributions seem to be independent of the porosity of the material while they are influenced by mechanical behaviour of the material: the value of the power law exponents is constant or slightly varying for the different relative densities of PU foams and clearly varying with temperature. Otherwise, a remarkable result is that a collapse in the time evolution curves of the cumulative number of events seems to appear for the different porosities and intrinsic properties of the material, suggesting universal characteristics. Nevertheless, several problems remains open for a full understanding of
fracture dynamics in polymeric foams and key questions remain unanswered concerning the meaning of the scaling exponents.
References
[1] Mogi K, 1962 Bull. Earthquake Res. Inst. 40 125-173
[2] Mogi K, 1968 Bull. Seismol. Soc. Jpn. 46 1103-1125
[3] Lockner D, Byerlee J, Kuksenko V, Ponomarev A and Sidorin A, 1991 Nature 350 39
[4] Lockner D, 1993 Int. J. Rock. Mech. Min. Sci. 30 883
[5] Diodati P, Bak P and Marchesoni F, 2000 Earth Planet. Sci. Lett. 182 253
[6] Kuksenko V, Tomilin N and Chmel A, 2005 J. Stat. Mech: Theory Exp. P06012
[7] Turcotte D and Shcherbakov R, 2006 Pure Appl. Geophys. 163 1031
[8] Garcimartin A, Guarino A, Bellon L and Ciliberto S, 1997 Phys. Rev. Lett. 79 3202
[9] Guarino A, Garcimartin A and Ciliberto S, 1998 Eur. Phys. J. B 6 13
[10] Guarino A, Garcimartin A and Ciliberto S, 1999 Europhys. Lett. 47 456
[11] Guarino A, Ciliberto S, Garcimartin A, Zei M and Scorretti R, 2002 Eur. Phys. J. B 26 141
[12] Maes C, Van Moffaert A, Frederix H and Strauven H, 1998 Phys. Rev. B 57 4987
[13] Petri A, Paparo G, Vespignani A, Alippi A and Costantini M, 1994 Phys. Rev. Lett. 73 3423
[14] Carpinteri A, Lacidogna G and Niccolini G, 2006 Key Eng. Mat 312 305
[15] Salminen L, Tolvanen A and Alava M, 2002 Phys. Rev. Lett. 89 185503
[16] Salminen L I, Pulakka J M, Rosti J, Alava M J and Niskanen K J, 2006 Europhys. Lett. 55
[17] Vives E, Ort´ın J, Ma˜nosa L, R`afols I, P´erez-Magran´e R and Planes A, 1994 Phys. Rev. Lett. 72 1694
[18] Richeton T, Weiss J and Louchet F, 2005 Acta Mater. 53 4463
[19] Richeton T, Dobron P, Chmelik F, Weiss J and Louchet F, 2006 Mater. Sci. Eng., A 424 19
[20] Weiss J and Miguel M, 2004 Mater. Sci. Eng., A 387-389 292
[21] Richeton T, Weiss J and Louchet F, 2005 Nat. Mater. 4 465
[22] Weiss J and Louchet F, 2006 Scripta Mater. 54 747
[23] Shaira M, Godin N, Guy P, Vanel L and Courbon J, 2008 Mater. Sci. Eng., A 492 392
[24] Faillettaz J, Louchet F and Grasso J-R, 2004 Phys. Rev. Lett. 93 208001
[25] Bouchaud E, 1997 J. Phys.: Condens. Matter 9 4319
[26] Gutenberg B and Richter C F, Seismicity of the Earth and Associated Phenomena, 1954 Princeton, Princeton University
[27] Sornette A and Sornette D, 1990 Tectonophysics 179 327
[28] Chen K, Bak P and Obukhov S, 1991 Phys. Rev. A 43 625
[29] Olami Z, Feder H J S and Christensen K, 1992 Phys. Rev. Lett. 68 1244 LP
[30] Kagan Y Y, 1994 Physica D: Nonlinear Phenomena 77 160
[31] Sornette D and Vanneste C, 1992 Phys. Rev. Lett. 68 612
[32] Zapperi S, Ray P, Stanley H E and Vespignani A, 1997 Phys. Rev. Lett. 78 1408
[33] Zapperi S, Ray P, Stanley H and Vespignani A, 1999 Phys. Rev. E. 59 5049
[34] Daniels H, 1945 Proceedings of the Royal Society of London. A 183 405
[35] Herrmann H and Roux S, Statistical models for the fracture of disordered media, 1990 North Holland, Elsevier Science Publishers B.V
[36] De Arcangelis L and Redner S, 1985 J. Phys. Lett. 46 L585
[37] Andersen J, Sornette D and Leung K, 1997 Phys. Rev. Lett. 78 2140
[38] Kun F, Moreno Y, Hidalgo R and Herrmann H, 2003 Europhys. Lett. 63 347
[39] Moreno Y, Gomez J and Pacheco A, 2001 Physica A 296 9
[40] Hidalgo R, Kun F and Hermann H, 2002 Phys. Rev. E 65 032502
[41] Hidalgo R, Kun F and Herrmann H, 2005 Physica A 347 402
[42] Politi A, Ciliberto S and Scorretti R, 2002 Phys. Rev. E 66 026107
[44] Ciliberto S, Guarino A and Scorretti R, 2001 Physica D 158 83
[45] Scorretti R, Ciliberto S and Guarino A, 2001 Europhys. Lett. 55 626
[46] Guarino A, Vanel L, Scorretti R and Ciliberto S, 2006 J. Stat. Mech: Theory Exp. P06020
[47] Sahimi M and Arbabi S, 1996 Phys. Rev. Lett. 77 3689
[48] Jei Y, Ouaskit S, Nassif R, Boughaleb Y, Nechad H and El Guerjouma R, 2005 Physica A 358 10
[49] Alava M J, Nukala P K V V and Zapperi S, 2006 J. Stat. Mech: Theory Exp. L10002
[50] Minozzi M, Caldarelli G, Pietronero L and Zapperi S, 2003 Eur. Phys. J. B 36 203
[51] Zapperi S, Castellano C, Colaiori F and Durin G, 2005 Nature Phys. 1 46
[52] Ely T and Hill E, 1995 Mater. Eval. 53 288
[53] Anastassopoulos A A, Philippidis T P and Paipetis S A, in: Non destructive testing edited by Van Hemelrijck D and Anastassopoulos A A (1996), pp. 143-149.
[54] Godin N, Huguet S and Gaertner R, 2005 NDT and E Int. 38 299
[55] Godin N, Huguet S, Gaertner R and Salmon L, 2004 NDT & E International 37 253
[56] Moevus M, Godin N, Rouby D, R’Mili M, Reynaud P, Fantozzi G and Farizy G, 2007 Comp. Sci.
Tech. 68 1258
[57] Gibson L and Ashby M, Cellular Solids : structure and properties, 2nd edition, 1997 Cambridge, Cambridge university press
[58] Triantafillou T C, Zhang J, Shercliff T L, Gibson L J and Ashby M F, 1989 Int. J. Mech. Sci. 31 665
[59] Hilyard N C, Mechanics of Cellular Plastics, 1982 New York, Macmillan
[60] Huang W M, 2003 Int. J. Mech. Sci. 45 1531
[61] Gent A N and Thomas A G, 1959 J. Appl. Polym. Sci. 2 354
[62] Lerderman J M, 1971 J. Appl. Polym. Sci. 15 693
[63] Barma P, Rhodes M B and Salovey R, 1978 J. Appl. Phys. 49 4985
[64] Christensen R M, 1986 J. Mech. Phys. Solids 34 563
[65] Warren W E and Kraynik A M, 1988 J. Appl. Mech.-Trans. ASME 55 341
[66] Zhu H X, Mills N J and Knott J F, 1997 J. Mech. Phys. Solids 45 1875
[67] Saint-Michel F, Chazeau L and Cavaill´e J-Y, 2006 Compos. Sci. Technol. 66 2709
[68] Saint-Michel F, Chazeau L, Cavaill´e J-Y and Chabert E, 2006 Compos. Sci. Technol. 66 2700
[69] Neilsen M K, Krieg R D and Schreyer H L, 1995 Polym. Eng. Sci. 35 387
[70] Puso M A and Govindjee S, in Mechanics of Plastics and Plastic Composites, edited by M. C. Boyce (ASME Press, New York, 1995), Vol. 68 (MD), p. 159.
[71] Zhang J, Lin Z, Wong A, Kikuchi N, Li V C, Yee A F and Nusholtz G S, 1997 J. Eng. Mater.
Technol. 119 284
[72] Deshpande V S and Fleck N A, 2000 J. Mech. Phys. Solids 48 1253
[73] Shulmeister V, Van der Burg M W D, Van der Giessen E and Marissen R, 1998 Mech. Mater. 30 125
[74] Youssef S, Maire E and Gaertner R, 2005 Acta Mater. 53 719
[75] Siegmann A, Kenig S, Alperstein D and Narkis M, 1983 Polym. Composite 4 113
[76] Ramsteinern F, Fell N and Forster S, 2001 Polym. Test. 20 661
[77] Deschanel S, Vanel L, Vigier G, Godin N and Ciliberto S, 2006 Int. J. Fracture 140 87-98
[78] Deschanel S, Vanel L, Godin N, Vigier G and Ciliberto S, 2009 J. Stat. Mech: Theory Exp. P01018
[79] Ridha M and Shim V, 2008 Exp. Mech. 48 763
[80] Huang J S and Gibson L J, 1991 J. Mater. Sci. 26 637
[81] Evans H E, Mechanisms of Creep Fracture, 1984 London, Elsevier Applied Science
[82] Andrews E, Gibson L and Ashby M, 1999 Acta mater. 47 2853
[83] Chen T-J and Huang J-S, 2008 Acta mater. 56 2283
[84] Roux S, Hild F, Viot P and Bernard D, 2008 Composites Part A 39 1253
[85] Elliott J, Windle A, Hobdell J, Eeckhaut G, Oldman R, Ludwig W, Boller E, Cloetens P and Baruchel J, 2002 J. Mater. Sci. 37 1547
and Applied Mechanics 2007 (Curran Associates, Inc., Springfield, Massachusetts, USA, 2007). [87] Wang Y and Cuiti˜no A M, 2002 Int. J. Solids and Struct. 39 3777
[88] Subhash G, Liu Q and Gao X-L, 2006 Int. J. Impact Eng 32 1113
[89] Ouellet S, Cronin D and Worswick M, 2006 Polym. Test. 25 731
[90] Fowlkes C W, 1974 Int. J. Fracture 10 99
[91] Cotgreave T and Shortall J B, 1978 J. Mater. Sci. 13 722
[92] A and Anderton G E, 1979 Polymer 20 247
[93] Maiti S K, Ashby M F and Gibson L J, 1984 Scr. Metall. 18 213
[94] Kabir M E, Saha M C and Jeelani S, 2006 Mater. Sci. Eng., A 429 225
[95] Lockner D, Byerlee J, Kuksenko V, Ponomarev A and Sidorin A, 1992 in Fault Mechanics and
Transport Properties of Rocks, edited by B. Evans and T.-F. Wong, Chapter 1, pp. 3-31 [96] Herrmann H J, 1995 Physica A: Stat. Theor. Phys. 221 125
[97] Lei X, Masuda K, Nishizawa O, Jouniaux L, Liu L, Ma W, Satoh T and Kusunose K, 2004 J.
Struct. Geol. 26 247
[98] Xu X H, Ma S P, Xia M F, Ke F J and Bai Y L, 2004 Theor. Appl. Fract. Mec. 42 131
[99] Krivobodrov V, 1995 J. Acoustic Emission 13 87
[100] Grosse C, Reinhardt H and Dahm T, 1997 NDT and E Int. 30 223
[101] Huguet S, Godin N, Gaertner R, Salmon L and Villard D, 2002 Comp. Sci. Tech. 62 1433
[102] Roques A, Browne M, Thompson J, Rowland C and Taylor A, 2004 Biomaterials 25 769
[103] Maire E, Fazekas A, Salvo L, Dendievel R, Youssef S, Cloetens P and Letang J M, 2003 Compos.
Sci. Technol. 63 2431
[104] Maire E, Carmona V, Courbon J and Ludwig W, 2007 Acta Mater. 55 6806
[105] Salvo L, et al., 2003 Nucl. Instrum. Methods Phys. Res., Sect. B 200 273
[106] Dawson J R and Shortall J B, 1982 J. Mater. Sci. 17 220
[107] Shahidzadeh-Bonn N, Vi´e P, Chateau X, Roux J-N and Bonn D, 2005 Phys. Rev. Lett. 95 175501
[108] Noble F W, 1983 J. Mater. Sci. 18 1827
[109] Krysac L C and Maynard J D, 1998 Phys. Rev. Lett. 81 4428