Publisher’s version / Version de l'éditeur:
Proceedings of the 17th World Congress on Ergonomics 2009, 2009-08-10
READ THESE TERMS AND CONDITIONS CAREFULLY BEFORE USING THIS WEBSITE. https://nrc-publications.canada.ca/eng/copyright
Vous avez des questions? Nous pouvons vous aider. Pour communiquer directement avec un auteur, consultez la première page de la revue dans laquelle son article a été publié afin de trouver ses coordonnées. Si vous n’arrivez pas à les repérer, communiquez avec nous à [email protected].
Questions? Contact the NRC Publications Archive team at
[email protected]. If you wish to email the authors directly, please see the first page of the publication for their contact information.
NRC Publications Archive
Archives des publications du CNRC
This publication could be one of several versions: author’s original, accepted manuscript or the publisher’s version. / La version de cette publication peut être l’une des suivantes : la version prépublication de l’auteur, la version acceptée du manuscrit ou la version de l’éditeur.
Access and use of this website and the material on it are subject to the Terms and Conditions set forth at
Revealing the internal structure of human variability for design
purposes
Meunier, Pierre; Shu, Chang; Xi, Pengcheng
https://publications-cnrc.canada.ca/fra/droits
L’accès à ce site Web et l’utilisation de son contenu sont assujettis aux conditions présentées dans le site LISEZ CES CONDITIONS ATTENTIVEMENT AVANT D’UTILISER CE SITE WEB.
NRC Publications Record / Notice d'Archives des publications de CNRC:
https://nrc-publications.canada.ca/eng/view/object/?id=c132380d-bb1f-4428-8e8e-16a4fcdcff2d https://publications-cnrc.canada.ca/fra/voir/objet/?id=c132380d-bb1f-4428-8e8e-16a4fcdcff2d17
thWorld Congress on Ergonomics
Revealing the internal structure of human variability for design purposes
Pierre Meunier1, Chang Shu2, Pengcheng Xi2
1
Defence R&D Canada,
2
National Research Council of Canada
The strength of traditional anthropometric data stems from its simplicity, ease of use, and ease of understanding. Designers are familiar with it and have been using it in a multitude of applications, albeit with varying degrees of success. But perhaps chief among weaknesses is the fact that traditional data does not capture shape, which was difficult to acquire many years ago, adequately. Now that shape information is easily captured by 3D scanning systems, along with the richness of information has appeared the burden of extracting the useful attributes of the data for individuals and an even greater burden when it comes to characterizing populations. This significant stumbling block has stood in the way of widespread use of 3D human shapes and its effective application in design projects. Recent developments in statistical shape analysis have removed the tedium of cleaning the scans and have opened the door to the use of statistical representations of human shape. One technique, principal components analysis (PCA), has proven particularly helpful in representing population variability and given designers enough insight into the modes of variability to allow them to address it in the early stages of design.
The purpose of this paper is to explain some of the options currently available for 3D design and present a new tool that provides a new paradigm for addressing population accommodation. The pros and cons of the new tool will be discussed in the context of an application for a new military helmet design, and conclusions, recommendations and challenges for the future will be proposed. The paper will hopefully show a need to rethink how to account for and deal with population shape variability.
INTRODUCTION
The strength of traditional anthropometric data stems from the simplicity with which it can be acquired and used. Designers are familiar with it and have been using it in a multitude of applications, albeit with varying degrees of success. The main weakness of traditional data is that it does not capture shape, which is sometimes indispensable.
Non-traditional anthropometric data such as those captured using 3D range scanners, provide size and shape information by virtue of the large number of points represented in the dataset. However, along with the richness of information comes an increased burden of extracting the useful attributes of the data. This has been a significant drawback of that technology, one that has stood in the way of its widespread use by designers.
In the case of head data, a raw head scan can easily contain 200 000 points, each with its set of x,y,z coordinates. CAD systems, even to this day, are not able to easily manipulate the large number of polygons effectively, making the designing task that much more laborious. But even getting to the point of having “clean” data requires technical savvy and patience, as filling the ever-present holes and eliminating spurious points requires a fair amount of human interaction. Nevertheless, while cumbersome and time-consuming, the use of edited 3D scans has been useful in studies of helmet fit where it has provided insight that was not readily available through other means (Meunier, 1995; Meunier, Tack, Ricci, Angel, & Bossi,
2000).
Remarkable strides have been made in recent years
concerning the modeling of shapes that have not only removed much of the tedium related to the post-processing of the raw scans but have made it possible to produce 3D statistical representation of the data through statistical shape analysis. Using a technique originally developed by Allen et al. (Allen, Curless, & Popovic, 2003) it is possible to “wrap” a template mesh over raw head scans and morph the mesh into the shape of the scanned subject. Since the same template is used for every head scan and through the use of homologous points throughout the surface of the head, the heads in the database become directly comparable on a point by point basis. This feature enables the use of multivariate statistical techniques such as principal components analysis (PCA), which provides a powerful way of revealing the internal structure of data (Dillon & Goldstein, 1984). With data expressed in this way, it is then possible to see the modes of variability within the population and provide this insight to the designers.
The purpose of this paper is to explain some of the options currently available for 3D design and present a new tool and an approach that provides an unparalleled capability for addressing population accommodation at the design stage. The pros and cons of the new tool will be discussed in the context of an application for a new protective helmet design along with some ideas on how to reconcile the duality of conventional anthropometry and statistical shape analysis.
PAST SOLUTIONS AND THEIR DRAWBACKS
Designers have had to resort to a number of approaches to bridge the gap between what traditional anthropometry provides and what is required to assist in the design of 3D head gear such as respirators and helmets. Prior to the advent of 3D range scanning equipment, summary statistics – means, standard deviations and correlations – were used as input for the generation of 3D head forms. But since shape was not specified, a mix of artistry and science was required that could only be provided by a sculptor. The result of this approach as used for the design of a respirator, or face mask, is shown in Figure 1.
Figure 1 Sculpted head forms for respirator design. With the advent of 3D range scanners, the shape and size of heads were captured in a form that could almost directly be used by designers in their CAD systems. Hundreds, and sometimes thousands of scans were acquired during surveys. While this represents a massive amount of data on the population being surveyed, the task of distilling data into useful information was a daunting one. One of the many possible strategies that can be used with such data is to use the conventional anthropometric measurement values as a means of selecting suitable representative cases from the database of 3D head scans and provide those to the designer.
Both of the above methods, while they capture the size variability, suffer from an inability to capture the shape variability of a population and may provide a false sense of security vis-à-vis accommodation.
PARAMETRIZATION & TOOL DEVELOPMENT Data
The most recent anthropometric survey of the Canadian land forces was performed in 1997 (Chamberland, Carrier, Forest, & Hachez, 1998). Traditional data was collected on 708 individuals (243 females, 465 males), a subset of which (208 females, 403 males) were scanned using a Cyberware 3030 RGB laser scanner with a PS platform. Each participant’s face was landmarked using blue dots with adhesive backing and wore a spandex swimming cap during the scanning process, as shown in Figure 2. The head was stabilized at the base of the skull with an adjustable rest to prevent movement during the scanning process. The vast majority of the participants were Caucasian.
Figure 2 Raw scan showing scanning cap and landmarks.
Post processing of scans
Parameterization of the raw scans is a two step process: the first-step performs a rough deformation and the second-step the fine fitting (Xi, Lee, & Shu, 2007). The first step utilizes the definitions of landmarks to build a Radial Basis Function network (RBF) for deformation. The second step fine tunes the fitting by minimizing a combination of defined errors. Figure 3 shows an example of deforming the generic model onto one raw scan following this two-step process.
Figure 3 (d) shows an example of the raw scan, and (a) shows the generic model with landmarks labeled as red points on the face. The rough deformation changes the shape of the generic model from (a) to (b), solely based on the locations of landmarks on the raw scan. The fine fitting then further fits the model from (b) to (c).
Transformation of 3D scans into statistical shapes
Once the raw scan data are parameterized, every model has the same mesh structure. To further reduce the dataset to only contain shape information, we apply a Procrustes analysis (Dryden & Mardia, 1998) to align the parameterized models.
After alignment, a Principal components analysis is performed on the parameterized models. Since every model has the same number of points, a shape vector consisting of the coordinates of the points can be formed for each model. An eigen analysis of the shape vectors transforms the data into a new coordinate system, with each dimension, called principal component (PC), representing the shape variability along that dimension. These principal components are ordered according to their eigenvalues.
With the PCA conducted, a new shape vector can be reconstructed by adding to the mean shape a linear combination of the principal components. By selecting different coefficients along the components, new vectors can be calculated to study shape variations.
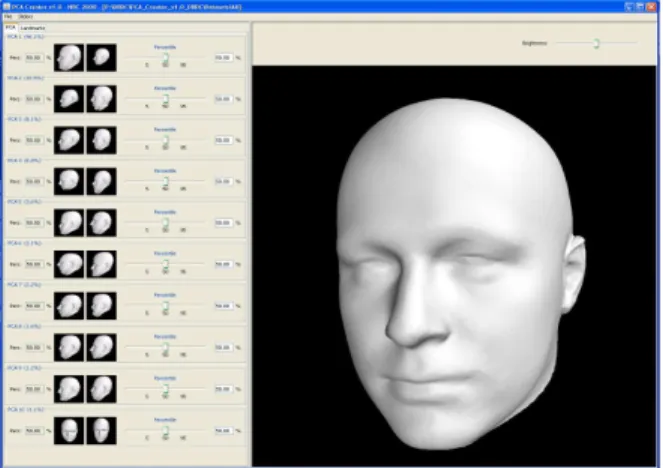
PCA Creator interface
A software tool called PCA Creator is created to visualize the shape variations along principal components. Figure 4 shows the interface of the software, where sliders control the coefficients along the principal components and the
visualization window shows the model in real time.
Figure 4 Interface of the PCA Creator
VISUALIZATION AND INTERPRETATION OF PCs
The first principal component (PC1) extracted always explains most of the variation in the original data, the second (PC2) explains most of the remaining variation and is uncorrelated with the first, and so on. Each principal component explains less and less of the variation, reaching a point where they become unimportant (see Figure 5). Two principal components are sufficient to explain nearly 50% of the variability of the sample. This means that the entire survey sample – hundreds of heads – can be well represented using only a limited number of components, making the design task that much easier. Furthermore, because of the statistical nature of the shape representation, it is now possible to associate these shapes with a probability of occurrence, allowing the
designers to control the extent of the target population that makes economic sense to accommodate.
Figure 5 Scree plot of principal components for males A closer look at the behavior of each principal component indicates that they are interpretable, to a certain extent. For example, the first PC regulates the volume of the head with almost no discernable effect on its shape. The exception to this rule is the effect on the jaw, which appears to get stronger as the head volume increases. The second PC represents a face elongation, going from a rounded shape to a thin elongated one. Each PC appears to deal with the various aspects of head shape in a manner that is akin to a Fourier transform; each PC describes higher resolution details, down to tiny effects. The first five PCs combine to express 70% of the shape variability of the dataset, while the next five only add a further 10%. The law of diminishing returns means that in the context of helmet design, a coarser approach is probably all that is required. For other pieces of equipment such as respirators, a different level of resolution might well be required. Each design problem will require its own appreciation of the variability expressed by the PCs.
HELMET DESIGN APPLICATION
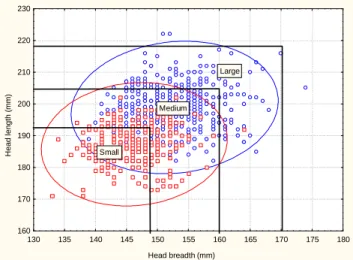
The key sizing dimensions for most helmets are head length, head breadth, and head circumference. Since head
circumference is largely explained by the other two
dimensions (adjusted R2=0.81), this means that helmet sizing is governed by two variables. Helmet fit is an upper bound problem - meaning that a head larger than a certain value will not go on whereas a smaller head can – with an adequate retention system – which means that a sizing chart might be represented graphically as shown in Figure 6. Short of resorting to the methods described above, the designer would not have a good appreciation of the variability of heads within the population that is being targeted by the design if all they had was this diagram. The following application is proposed as an example of how the use of statistical shape representations can provide a useful framework for design.
Strategy for design
Admittedly, the strategy discussed in this paper represents but one of a multitude of possible strategies available. However, it is offered as a simple and effective method that is
0% 5% 10% 15% 20% 25% 30% 35% 40% PC1 PC2 PC3 PC4 PC5 PC6 PC7 PC8 PC9 PC10 Principal component V a ri a b il it y e x p la in e d ( % )
predicated on an understanding of the modes of variability of the dataset, the type of information required by the designers, and the need to minimize the number of design head forms.
Figure 6 Helmet sizing system relative to male (blue) and female (red) populations, with 99% equi-probability ellipses.
The first two principal components were selected as the basis for the strategy for two reasons: they represent 50% of the variability, and they portray head features that are critical to the design of the helmet. Figure 7 illustrates the effect of combining size (PC1) and shape (PC2). The head forms were generated under the following principle: the extremes of PC2 would be used at the 1 to 99 percentile level and PC1 would adjusted so as to maintain head length and breadth values within a given helmet size limit.
Figure 7 Extreme combinations of PC1 and PC2 for one helmet size
The solid images in Figure 7 represent the lower values
along the PC1 axis and the dotted overlay, or ghost image, represents the higher values. The solid and dotted overlay forms were aligned at the eyes. The top and bottom vignettes represent the two extremes of PC2. It is interesting to note the difference in behavior of PC1 for a given extreme of PC2. For instance, the long and narrow head scales up rather uniformly compared to the short and rounded head. The former is limited by head length while the latter is limited by head breadth. Figure 7 shows a stark contrast in head forms and provides a statistical framework for the designer to address.
A more comprehensive approach is required to address population accommodation and this can be achieved by scaling up the process of combining PC1 and PC2. Figure 8 illustrates how one might generate a cadre of design head forms. Using the stated approach for each helmet size would yield the six head forms at the outer edges of the ellipse. The three head forms in the centre were obtained using PC1 alone. The result is a set of three head forms along each of the upper bounds of the three helmet sizing limits. The advantage of this scheme is that the test cases are dual purpose: the upper limit of one size can serve as the lower limit of the next size up.
Figure 8 Full set of design forms.
Perhaps an even more efficient way of characterizing the users of a given helmet size would be to make use of a head forms in a triad, as depicted by the dotted triangles in Figure 8. At the apex of the triangle lies the largest head in both length and breadth, whereas at the base of the triangle lie the two extremes of head shape and small size.
DISCUSSION FOR THE USE OF HEAD FORMS
The brute force approach to dealing with population accommodation would have been to provide all of the raw head scans to the designers and allow them to perform exhaustive testing and evaluation of their design. Although this is possible, it is not the most efficient way to proceed as there is a multitude of redundant cases in the center of the
distribution. At the other extreme, and this is perhaps the most commonly used method, the approach consists in providing a single head form for a given helmet size. Designers could, for instance, design for the biggest head for a given shell size and this could be sufficient in some cases. However, experience
Head breadth (mm) H e a d l e n g th ( m m ) 130 135 140 145 150 155 160 165 170 175 180 160 170 180 190 200 210 220 230 Small Medium Large
has shown that this method falls short when the relationship between the item and the human is more complex. Ideally, the variability of the population should be represented at the design stage by means of a limited number of carefully selected test cases. The selection of the cases should be based on knowledge of the population variability and of the design features. In other words, the test case selection is design dependent.
Advantages
The main advantage of the tool described in this paper is its ability to condense massive amounts of 3D range data and express it in physically and statistically meaningful terms. The outcome is akin to a glimpse into the internal structure of the data and provides unparalleled knowledge of the main modes of variation of the human body, or heads in the present case. Armed with this type of information, a set of design head forms can be generated that capture this variability and allows designers to accommodate it at the earliest possible stage of the design process.
Statistical shapes do not represent any individual in particular, which means that the privacy and anonymity of the survey participants is preserved. Another benefit is that unlike the use of raw scans, the models are created on a continuum for each PC, which means that a precise combination of factors can be used instead of being at the mercy of what is contained in the original database. It is even possible to extrapolate beyond the dataset, although caution should always be exercised to avoid designing for the one in a million probability. On the other hand, the user has full control and can quickly assess the impact of catering for a higher inclusion rate on the design. In some cases, the penalty can be quite small compared to the benefit and more of the user population would be included.
All or nothing dilemma
One of the challenges posed by the use of statistical shapes expressing human variability is that each PC acts on all of the points representing the surface of the head. It is an all or nothing situation. At the moment, there is no way of isolating any one part of the head, say the nose or mouth, for specific design purposes.
Combination of PCs: how many is too many?
Another challenge consists in selecting the number PCs and their combination. In the example given in this paper, two PCs were deemed sufficient – after careful review of the first
twenty five PCs – the number of test cases would have increased geometrically with the addition of a third and fourth. As the number of PCs increases, it could be argued that the head form might be more representative of an individual than a statistical representation of a group of individuals, as the combined probabilities tend towards the extremities of the distribution and the one-in-a-million case.
As long as the PCs are used one at a time, there is no ambiguity as to what the target population entails. This can be extended to the combination of two or more PCs provided the joint probabilities are accounted for, but it is probably best to stick with a few PCs at a time.
FUTURE WORK
A set of head forms was generated and analyzed with helmet design in mind. This resulted in the proposal of an efficient design strategy for the next generation of helmets. While the proposed strategy captures roughly 50% of the variability, the next step would be to examine a few more of the principal components, assess their relevance to the design of various types of helmets, and compare the head forms generated in this way with the ones proposed herein. The goal would be to determine whether they provide additional (useful) information to designers.
REFERENCES
Allen, B., Curless, B., & Popovic, Z. (2003). The space of
human body shapes: reconstruction and
parameterization from range scans. Paper presented at the ACM SIGGRAPH 2003, .
Chamberland, A., Carrier, R., Forest, F., & Hachez, G. (1998).
Anthropometric survey of the Land Forces (LF97)
(Contractor report No. 98-CR-15). Toronto, Ontario: Defence and Civil Institute of Environmental Medicine.
Dillon, W. R., & Goldstein, M. (1984). Multivariate analysis. New York: John Wiley & Sons.
Dryden, I. L., & Mardia, K. V. (1998). Statistical shape
analysis. Chichester: Wiley.
Meunier, P. (1995). Sizing Assessment of the Gallet Helmet (Technical Memorandum No. 3753-1 (HF) dated 17 Nov 95). Toronto: DCIEM.
Meunier, P., Tack, D., Ricci, A., Angel, H., & Bossi, L. (2000). Helmet accommodation analysis using 3D laser scanning. Applied Ergonomics, 31, 361-369. Xi, P., Lee, W.-S., & Shu, C. (2007). Analysis of Segmented
Human Body Scans. Paper presented at the Graphic Interface 2007 Conference, Montreal, QC.