Publisher’s version / Version de l'éditeur:
ECS Transactions, 28, 30, pp. 91-104, 2010
READ THESE TERMS AND CONDITIONS CAREFULLY BEFORE USING THIS WEBSITE.
https://nrc-publications.canada.ca/eng/copyright
Vous avez des questions? Nous pouvons vous aider. Pour communiquer directement avec un auteur, consultez la
première page de la revue dans laquelle son article a été publié afin de trouver ses coordonnées. Si vous n’arrivez pas à les repérer, communiquez avec nous à PublicationsArchive-ArchivesPublications@nrc-cnrc.gc.ca.
Questions? Contact the NRC Publications Archive team at
PublicationsArchive-ArchivesPublications@nrc-cnrc.gc.ca. If you wish to email the authors directly, please see the first page of the publication for their contact information.
This publication could be one of several versions: author’s original, accepted manuscript or the publisher’s version. / La version de cette publication peut être l’une des suivantes : la version prépublication de l’auteur, la version acceptée du manuscrit ou la version de l’éditeur.
For the publisher’s version, please access the DOI link below./ Pour consulter la version de l’éditeur, utilisez le lien DOI ci-dessous.
https://doi.org/10.1149/1.3505463
Access and use of this website and the material on it are subject to the Terms and Conditions set forth at
CH3OH oxidation activities of an unsupported PtxRuy powder catalyst before and after different electrochemical treatments
Kothandaraman, R.; Bock, C.; MacDougall, B.
https://publications-cnrc.canada.ca/fra/droits
L’accès à ce site Web et l’utilisation de son contenu sont assujettis aux conditions présentées dans le site LISEZ CES CONDITIONS ATTENTIVEMENT AVANT D’UTILISER CE SITE WEB.
NRC Publications Record / Notice d'Archives des publications de CNRC: https://nrc-publications.canada.ca/eng/view/object/?id=0180fc0a-87ae-4afc-8f44-09db944a0966 https://publications-cnrc.canada.ca/fra/voir/objet/?id=0180fc0a-87ae-4afc-8f44-09db944a0966
CH3OH oxidation activities of an unsupported PtxRuy powder catalyst before and after
different electrochemical treatments R. Kothandaraman, C. Bock, and B. MacDougall
Institute for Chemical Process and Environmental Technology, National Research Council of Canada, Ottawa, Ontario K1A 0R6, Canada
An unsupported Pt75Ru25 powder was synthesized by co-reducing the
corresponding precursor salts rapidly. An alloy powder of Pt75Ru25
composition was formed in this manner. The catalyst powders were subjected to various electrochemical treatments in either 0.5 M H2SO4 or
0.5 M CH3OH + 0.5 M H2SO4 solutions. Applying specific
electrochemical treatments in respect to time (e.g., the potential cycling number) relative to the E+ value result in either a decrease or increase in the CH3OH oxidation activity of this catalyst. The differently treated
catalyst powders were further studied using EDX, XPS and CO adsorbed (COads) stripping voltamograms and transients. The results suggest that
removal of surface Ru-oxides result in an increase in CH3OH
electro-oxidation activity, while extensive loss of Ru from the catalyst surface results in a decrease in CH3OH oxidation activity. Refluxing this
as-prepared catalyst powder in an excess of boiling 0.5 M H2SO4 did neither
result in the removal of the surface Ru-oxides nor improve the CH3OH
oxidation activity.
Introduction
Direct methanol fuel cells (DMFCs) have attracted a lot of attention due to their potential use as power sources for portable and micro-electronic devices [1]. Pt-Ru systems are the best performing catalysts for the CH3OH oxidation reaction [2]. Their catalytic benefit is largely due
to a bi-functional mechanism. According to the bi-functional mechanism, Ru is capable of adsorbing H2O at low potentials, thus generating –OHads species on the catalyst surface that are
needed to completely oxidize CH3OH to CO2 [3]. Despite advances in FC technologies, the
DMFC performance still needs to be improved, namely, (i) the kinetics of both the anode and cathode reactions need to be increased, (ii) cross-over of CH3OH from the anode to the cathode
needs to be reduced, and (iii) the stability of the Pt-Ru anode catalysts needs to be enhanced. The latter results in cross-over of Ru from the anode to the cathode compartment during FC operation [4-6]. The Ru is deposited in the cathode compartment, possibly blocking Pt cathode catalysts sites that are needed for the reduction of the cathode fuel, i.e., O2 [6]. Furthermore,
oxidation of CH3OH fuel, that crossed-over, can then take place in the cathode compartment. As
Some studies using commercially available unsupported Pt-Ru catalyst powders have been carried out to study the Ru dissolution issues in DMFCs. It has been established that a separate, likely hydrous Ru-oxide phase dissolves from the Pt-Ru catalysts even at the open-circuit potential (ocp) [4]. It has further been shown that the separate Ru phase can be dissolved in boiling H2SO4, thus reducing the dissolution and cross-over of Ru in the FC. Furthermore, FC
experiments have shown that the anode performance is not altered when the separate Ru phase is dissolved from the Pt-Ru catalysts, and that the observed loss of the DMFC performance is solely due to a lower cathode performance [4, 5]. Based on these results it is concluded that fully alloyed Pt-Ru catalysts should be used to reduce Ru dissolution issues. However, commercially available Pt-Ru catalysts often consist of a mixture of phases, namely PtxRuy alloys as well as
separate Ru/Ru-oxide phases. The amount of Ru in the separate phase can be large, e.g., approaching 30-40 % of the total amount of Ru in the catalyst [7]. It should be noted that during DMFC operation parts of the anode may experience very positive potentials favoring loss of Ru even from PtxRuy alloys. Therefore, the use of fully alloyed Pt-Ru catalysts may not solve the
Ru dissolution problem; however, the cross-over of Ru is likely less extensive when fully alloyed catalysts are used.
In this work an unsupported PtxRuy catalyst is used due to its ease of characterization
compared to supported nano-sized (< 5 nm) Pt-Ru catalysts. Further studies will need to be carried out to show if the findings for this catalyst powder also apply to nano-sized carbon supported Pt-Ru catalysts. A synthesis method is used that is expected to result in a PtxRuy alloy
of the same alloy and overall Pt to Ru ratios, i.e., not forming large amounts of separate Ru and/or Ru-oxide phases. The PtxRuy catalyst powder is subjected to different electrochemical
treatments as well as to refluxing in boiling 0.5 M H2SO4. The variously treated catalysts are
characterized for their activity to electro-oxidize CH3OH. They are further characterized using
XRD, XPS, EDX and electro-oxidation studies of adsorbed CO (COads).
Experimental Catalyst synthesis
An unsupported PtxRuy catalyst powder was synthesized utilizing a rapid chemical reduction
method. An aqueous solution consisting of 0.707 g PtCl4 (99.9 % purity, Alfa Aesar) and 0.158
g RuCl3 * x H2O (Alfa Aesar, Metal basis assay 44.64 %) was reduced at room temperature by
adding a 100 % excess of NaBH4 (J. T. Baker, ACS grade) at once. The reaction mixture was
stirred for an additional hour, subsequently filtered and the formed powder was then washed with an excessive amount of H2O. The powder was dried in air oven at 80 °C. The powder prepared
in this manner is referred to as as-prepared catalyst. 0.05 g of the as-prepared catalyst powder was also refluxed in boiling 0.5 M H2SO4 for 24 h. The refluxed powder was subsequently
filtered and washed with excessive amounts of H2O. This powder is referred to as refluxed
Electrodes and electrochemical cells
9 mg of the catalyst powder was dispersed in 1 ml of H2O by sonication. Immediately after
sonication, 20 µl’s of the ink were deposited on a Au foil electrode and left to dry at room temperature. 20 µl’s of a 0.025 wt.% Nafion solution in lower alcohols were then spread over the catalyst powder to form a thin layer of Nafion. These electrodes were studied in a two compartment glass cell, in which the reference electrode is separated from the working and counter electrode compartment by a Lugging capillary. All potentials are reported vs. the reversible hydrogen electrode (RHE). However, either a standard calomel electrode (SCE) or a mercury sulfate electrode (MSE) was used as reference electrode. Electrochemical experiments involving the SCE were limited to one hour to avoid possible interferences of chloride. The electrochemical experiments were carried out at room temperature and either 0.5 M H2SO4 or 0.5
M H2SO4 + 0.5 M CH3OH solutions were used. The solutions were deoxygenated by bubbling
argon gas for 30 min. prior to the electrochemical experiments. Instrumentation
Electrochemical experiments were carried out using a Solartron 1285 (Solartron Group, Ltd.) electrochemical interface driven by Corrware software (Scribner Assoc.). Powder X-ray diffraction (XRD) of the as-prepared and refluxed catalysts powders were recorded using a Philips XRD machine with Cu Kα source. A JEOL 840A scanning electron microscope equipped with an Oxford Instruments 6560 INCAX-sight light element energy dispersive X-ray (EDX) spectrometer was used to obtain the Pt and Ru composition of the catalyst powders. The EDX analyses were carried out using an accelerating voltage of 20 kV and a working distance of 15 mm. At total live count time of 60 s was used. A Kratos Axis Ultra X-ray photoelectron spectroscope (XPS) equipped with a monochromated Al X-ray source was also used. On each sample, at least three areas were analyzed. The XPS analyses were carried out using an accelerating voltage of 14 kV, a current of 10 mA and an aperture size of 300 µm x 700 µm. The Au 4f peak at 84 eV was used to compensate for possible charging effects. On each sample, a survey spectra was collected, before high resolution spectra were acquired. Peak assignments were based on the NIST database (http://srdata.nist.gov/xps/Bind_E.asp), and deconvolution of the XPS spectra were performed using CasaXPS (ver. 2.2.107) data processing software. A Shirley background correction was used. A Gaussian-Lorentzian, 70:30 % mix, function was used to deconvolute the spectra. All XPS and EDX samples were analyzed on the Au foil electrode prepared as described above in electrodes and electrochemical cells.
Electrochemical experiments
Each electrode was conditioned by completing 50 cycles at 20 mV s-1 between 0 and 0.4 V in 0.5 M H2SO4. The conditioned electrodes were then subjected to different treatments by
potential cycling at 10 mV s-1 between 0 V and a specific upper potential value (E+). The influence of E+ values between 0.6 and 1.2 V were studied. In some cases electrodes were also subjected to potential holding experiments at a constant E+ value.
The catalysts were also characterized using CO adsorbed (COads) stripping experiments. For
high purity CO gas through the 0.5 M H2SO4 solution for 30 min. Solution CO was
subsequently removed by bubbling argon gas through the solution for 10 min., while the potential was maintained at 0.15 V. In case of the COads stripping experiments, the potential was
then cycled at 10 mV s-1 starting into the positive direction at 0.15 V for two complete oxidation/reduction cycles between 0 and 0.8 V. COads stripping current-transients were also
recorded at 0.418 V. CH3OH oxidation activities of the electrodes were obtained from cyclic
voltammograms (CVs) as well as from current time transients recorded at a constant potential. 0.5 M CH3OH + 0.5 M H2SO4 solutions were utilized for these studies and all electrochemical
measurements were carried out at room temperature unless otherwise noted.
Results and Discussions Characteristics of the as-prepared and refluxed powders
Fig. 1 shows XRD patterns of the as-prepared and refluxed catalyst powders. It is seen that the spectra of the two powders are essentially the same. Both patterns are typical for a face centered cubic (fcc) Pt structure. A lattice parameter (a) of 3.89 Å is extracted from these spectra using the Pt(111) diffraction peak. This lattice parameter in combination with the quasi Vegard’s law relationship, that applies to PtxRuy alloys [2, 8], suggests an alloy composition of
75 to 25 at.% Pt to Ru. Therefore, this PtxRuy alloy powder is further referred to as Pt75Ru25.
EDX analyses suggest an overall Pt to Ru at. % composition of 75 to 25 for both powders. This is the same Pt:Ru ratio as suggested for the alloy composition by the XRD data. Therefore, these results suggest that the Ru is largely dissolved in the Pt fcc lattice for both the as-prepared and refluxed powders, i.e., the presence of large amounts of separate Ru/Ru-oxide phases can be excluded. The latter is further consistent with the fact that the EDX and XRD results are identical for the as-prepared and refluxed powders. According to literature results [4, 7], separate Ru phases can be leached from Pt-Ru catalyst powders by a reflux treatment in 0.5 M H2SO4 at 100 oC. Therefore, the fact that the same compositions are obtained for the two
powders continues to suggest that the Ru is mainly dissolved in the Pt fcc lattice.
CH3OH oxidation studies were also carried out for the as-prepared and the refluxed catalysts.
Fig. 2 shows examples of CH3OH oxidation CVs for the CH3OH oxidation of a refluxed and an
as-prepared catalyst powder. It seen that the CVs are very similar within the variation of the experiments. COads stripping and background CVs recorded in 0.5 M H2SO4 were also found to
be the same for the as-prepared and refluxed catalysts. This further indicates that the as-prepared and refluxed catalysts are essentially the same. Therefore, the results presented in the reminder of this work are for the refluxed catalyst powder unless otherwise stated. Furthermore, it is known that Pt-Ru alloy powder catalysts of 75:25 at.% Pt to Ru alloy ratio yield high electro-catalytic CH3OH oxidation activities. In fact, their CH3OH oxidation currents measured per Pt +
Ru surface area and at specific potentials have been reported to be close (within 10 % of the CH3OH activity) to the most active form for unsupported Pt-Ru alloy powder catalysts [2].
The influence of the electrochemical treatments on the CH3OH oxidation activity
The influence of potential cycling experiments to different E+ values on the CH3OH
oxidation characteristics are discussed in the following sections. The results shown are for electrochemical cycling experiments carried out in 0.5 M CH3OH + 0.5 M H2SO4 solutions. It
Fig.2 CH3OH oxidation CVs (5th cycle) recorded for as prepared and refluxed catalysts in 0.5
M CH3OH + 0.5 M H2SO4 solution at 10 mV s-1
should be noted that similar results were found using CH3OH free, i.e., 0.5 M H2SO4 solutions.
The catalysts are also characterized by XPS and EDX before and after electrochemical treatments. It is noteworthy that essentially the same experiments were carried out that involved holding the potential at, rather than potential cycling to different E+ limits. The results were essentially the same with the exception that the potential holding experiments needed to be carried out over longer periods of time to achieve the same changes in the electrochemical characteristics of the catalyst powder. Furthermore, the discussion of the influence of the E+ value mainly focuses on the region of 0.8 V and more positive values. This region appears to be in agreement with Ru dissolution studies of Ru metal electrodes carried out by electrochemical quartz crystal microbalance (EQCMB) measurements [9]. The latter showed that electrochemical Ru dissolution takes place within the potential window of 0.6 and 0.8 V; however, at a “small” rate. The electrochemical dissolution rate becomes rapid (increases in an exponential manner) at potentials more positive than 0.8 V [9]. It is known that within the range of E+ values up to 0.5 V, RuOH and RuO are formed on the surface of the Ru electrode [10]. The electrochemical oxidation of Ru metal to RuOH species starts in the 0 to 0.2 V range [10]. At potentials of 0.6 V and more positive the formation of tri- and tetravalent Ru-species can take place. The tri- and tetravalent species of Ru are generally not very stable even in acidic solutions [9], hence, explaining the observed increase in Ru dissolution rate above 0.8 V. The exact mechanism of losing Ru from Pt-Ru electrodes in acid solutions is not known with certainty. It seems to be generally viewed as an electrochemical step, followed by dissolution of Ru in the form of Ru(+III)- and Ru(+IV)-complex species. However, it has also been suggested that the Ru may be lost as nano-particles such as e.g., Ru2O3 and/or RuO2 [4].
Fig. 3a shows a series of forward cycles for the CH3OH oxidation reaction for Pt75Ru25
electrodes that are cycled to different E+ values. The 50th cycles are shown and a new electrode is used for each case. For the case of the E+ value of 0.6 V, the CH3OH oxidation activity is
very similar to the conditioned only electrode, i.e., the CH3OH oxidation activity of the catalyst
is not detectably altered by the potential cycling experiment up to 0.6 V. However, clear changes in the CH3OH oxidation activity are observed for the more positive E+ values. In case
of the E+ values of 0.8 and 1 V, an increase in the CH3OH oxidation peak current as well as a
shift in the CH3OH oxidation potential to more negative potentials are observed. In the case of
the 1.2 V value, the CH3OH oxidation current at peak maxima is large, however, the onset
potential of the CH3OH oxidation reaction is shifted to positive values. The latter indicates a
poorer electro-catalytic performance. The influence of the individual E+ values was studied as a function of the potential cycling number. It was found that in case of the 0.8 V E+ value a “steady-state” CH3OH oxidation activity was achieved within 50 cycles. The term “steady-state”
is used here based on the observation that the CH3OH oxidation CVs are the same for the 50th to
the 300th potential cycles tested. This is shown in Fig. 3b for the case of the 2nd, 50th and 300th cycle. In case of the E+ values of 1 and 1.2 V, such a “steady-state” behavior was not observed. Furthermore, the CH3OH oxidation activity decreased with increasing potential cycling number
after 250 and 30 cycles for the E+ values of 1 and 1.2 V, respectively. It should be noted that a decrease in the CH3OH oxidation activity refers to experimentally observed shifts in the CH3OH
onset potential to more positive values.
Similar changes in the CH3OH oxidation activity are also observed in current-time transient
electrode and an electrode 50 times cycled to the E+ value of 0.8 V. An increase in the CH3OH
oxidation current of 30 % is observed for the cycled electrode. This is similar to the increase in current observed in the CV experiments for this electrode shown in Fig. 3b.
It is noteworthy that the CH3OH oxidation activity was also studied at 60 oC as a function of
E-cycling of the catalyst powder. CV and current-time transients measured at 60 oC in 0.5 M Fig.3 (a) 50th forward cycle for Pt75Ru25 catalyst electrodes cycled to various E+ values.
Fig.3 (b) shows the same, but for the 2nd, 50th and 300th forward cycles using the E+ value of 0.8 V. All CVs are recorded in 0.5 M CH3OH + 0.5 M H2SO4 solution at 10 mV s-1.
Fig. 3 (c) shows current-time transients recorded in 0.5 M CH3OH + 0.5 M H2SO4 solutions
CH3OH + 0.5 M H2SO4 solutions show an increase in CH3OH activity of 26 % after 50 cycles to
an E+ value of 0.8 V in 0.5 M H2SO4 and at room temperature.
COads oxidation studies
COads oxidation experiments were carried out to gain insight into the changes taking place on
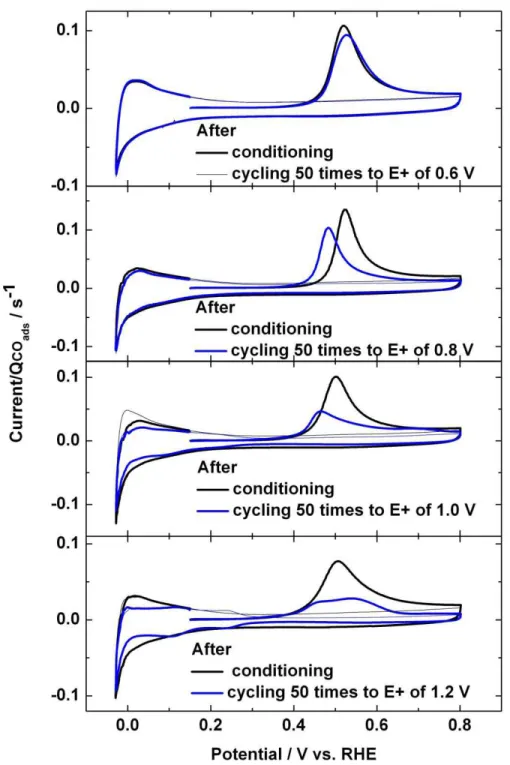
the catalyst surface during the E-cycling experiments. Fig. 4 shows a series of COads stripping
voltamograms for Pt75Ru25 electrodes cycled 50 times to different E+ limits. The COads stripping
voltamogram for the conditioned only electrode is also shown. The current scale in each COads
stripping voltamogram is normalized using the QCOads value of the corresponding electrode
measured after conditioning. The COads stripping voltamogram for the conditioned electrode and
the electrode cycled 50 times to 0.6 V are the same. This continues to indicate that the electro-catalytic activity of the catalyst powder is not measurably altered by the potential cycling experiments up to 0.6 V. In case of the E+ values of 0.8 and 1 V, the onset potential for the COads stripping reaction is shifted to more negative potentials and the COads stripping reaction is
completed at lower potentials than for the conditioned only catalyst electrode. This indicates that the COads stripping kinetics are more rapid for these two E-cycled catalyst electrodes. Decreases
in the COads stripping charge (QCOads) values of 17 and 31 % are observed upon the E-cycling
experiment to 0.8 and 1 V, respectively. The QCOads values yield an approximate measurement
of the electrochemical surface area (ECSA) of these catalysts. Therefore, the fact that the QCOads,
and hence, the ECSA value, decrease with E-cycling suggests that the experimentally observed increases of more than 30 % in the CH3OH oxidation activity (Fig. 3a) cannot be assigned to an
increase in the ECSA value. Therefore, it is concluded that the observed increases in the CH3OH
oxidation activity are related to true improvements in electro-catalytic activity of these catalyst powders. The loss in the QCOads value is more pronounced, 47 %, for the catalyst powder cycled
to 1.2 V. Furthermore, the onset potential for the COads stripping reaction is shifted to more
positive and two peaks are observed for the latter. Examination of the Hads/des region of this
electrode reveals the “butterfly” characteristics that are typically observed for polycrystalline Pt electrodes. These results suggest that the surface of this electrode has become enriched in Pt, i.e., a significant amount of Ru must have been lost from the surface. Consequently, the COads
stripping reaction kinetics are also reduced.
Current-time transients for the COads stripping reaction were recorded at a constant potential
as described in the experimental section for the differently treated electrodes. Important characteristics of the catalyst surface, as the induction time for the -OHads formation reaction (ti)
and the distribution of active Pt and Ru sites, can be extracted from these transients as shown in previous work [8, 11]. Similar to the CH3OH oxidation, the COads stripping reaction to CO2 also
takes place according to a bi-functional mechanism, as summarized in eqs. 1+2: − + + + − ⎯→ ⎯ +H O Ru OHads H e Ru 2 [1] − + + + + + ⎯→ ⎯ − + −COads Ru OHads M Ru CO H e M 2 [2]
The COads stripping transients discussed in this work are recorded at 0.418 V. Therefore, it
can be assumed that the -OHads formation reaction, i.e., eq. 1, takes place exclusively on Ru sites.
Fig. 4 COads stripping voltammograms recorded at 10 mV s-1 for Pt75Ru25 electrodes
cycled 50 times to different E+ values. The stripping voltamogram of a conditioned electrode is also shown in each graph for comparison.
Furthermore, M in reaction 2 stands for Pt and Ru sites that are in the metallic form at 0.15 V, where the CO is adsorbed. Fig. 5 shows examples of COads current-time transients recorded for
Pt75Ru25 electrodes before and after 50 cycles to different E+ values. As for the COads stripping
voltamograms, the current scale of the transients is normalized using the QCOads value of the
corresponding conditioned electrode. Consistent with the COads stripping CVs shown in Fig. 4,
the COads to CO2 oxidation reaction is seen to be faster for the Pt75Ru25 catalysts “activated” by
cycling 50 times to either 0.8 or 1 V than for the conditioned catalyst. The COads stripping
transients can be divided into different regions, as discussed in this paragraph. The decaying current at very short time periods reflects the double layer charging current. Subsequently, an increase in the current is observed. The time needed for the current to increase, ti, reflects the
time needed for the recombination reaction of M-COads + Ru-OHads, i.e., eq. 2 to be initiated.
The increase in current observed after ti results from the recombination reaction of –COads
located near an active Ru-OHads site. This recombination reaction takes place between ti and to.
It is also possible that more Ru-OHads sites are formed during this period, thus further
contributing to the current increase and assisting in the oxidation of the –COads molecules. The
percentage fraction of the QCOads value passed during the time ti to to vs. the total QCOads value of
the electrode (% QO) presents a measurement of the number of –COads molecules located near an
active Ru-OHads site plus the number of Ru-OHads formed. A good COads oxidation catalyst
achieves a high % QO value in a short time. Therefore, the % QO vs. the to value (% QO/to)
represents a measurement of the number of neighbouring M-COads and active Ru-OHads sites [8].
After to, the current decays and eventually approaches zero values. During this time COads
molecules located further away from active Ru-OHads sites are oxidized. It is known that the
COads molecule can move across Pt catalyst surfaces utilizing COads free metallic catalyst sites
(M*), as indicated in eq. (3) [11].
M −COads +M*⎯⎯→M*+M −COads [3]
In the period after to, the rate of the recombination reaction shown in eq. 2 is determined by
the time needed for COads molecules to move across the catalyst surface to an active Ru-OHads
site.
The characteristic values of the COads stripping time transients shown in Fig. 5 are
summarized in Table 1. It is seen from Fig. 5 that the COads stripping reaction is completed
faster as the E+ value increases. The transient for the E+ value of 1.2 V is not shown. In the latter case, only a small fraction of the total COads molecules was oxidized during a period of 300
s, and the characteristic features, namely ti and to, were not clearly defined. Therefore, this
transient is not shown. Overall, the COads stripping transient results are consistent with the COads
stripping voltamograms and follow the same trend observed for the increase in the CH3OH
oxidation reaction with the E+ value (Fig. 3a). Analyses of the transients also show that the ti
values are lower as the E+ value increases suggesting that the recombination reaction (eq. 2) is initiated faster. The latter may be due to a faster formation of active Ru-OHads for these two
E-cycled catalysts. Furthermore, the to values decrease as the E+ value increases. This results in
an increase in the %Qo/to values, thus suggesting that the number of neighbouring (nearby) COads
Table I. Characteristic numbers for the COads stripping reaction extracted for current-time transients recorded at 0.418 V Samples ti(s) Qo(%) to(s) Qo/to (% s-1) Conditioned Pt75Ru25 3.8 27.1 38.6 0.6 Pt75Ru25 subjected to E+ of 0.8 V 2.6 26.3 16.8 1.6 Pt75Ru25 subjected to E+ of 1 V 2 17.7 6.4 2.8
Pt75Ru25 subjected to E+ of 1.2 V N/A N/A N/A N/A
XPS and EDX analyses for as-prepared, refluxed and E+ cycled electrodes
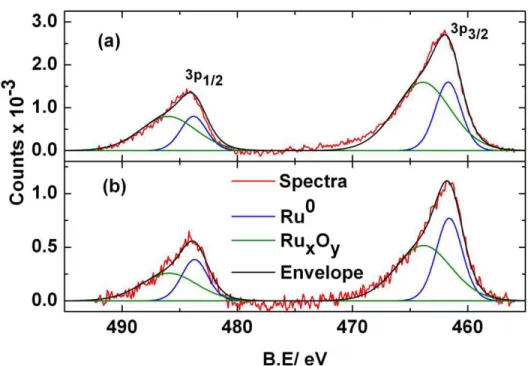
Fig. 6 shows the Ru 3p core level XPS spectra for a conditioned and a Pt75Ru25 catalyst
electrode cycled to 0.8 V. It is noteworthy that the electrodes are emmersed off the electrolyte Fig. 5 COads stripping transients recorded at 0.418 V for Pt75Ru25 conditioned
solution after the negative potential scan to 0.15 V is completed. The spectra for the as-prepared and refluxed Pt75Ru25 catalyst powders not subjected to any electrochemical treatment were
found to be the same as the spectra for the conditioned electrode. The results for the deconvolution of the spectra are summarized in Table II. Table II also shows the Pt to Ru ratio for the electrodes. The Pt to Ru ratio is seen to be the same for all electrodes, i.e., 75:25 at.%. Column 2 shows the ratios determined from XPS spectra. The Pt 4f core level spectra (highest intensity peak for Pt), and the Ru 3p core level spectra (C 1s free peak for Ru) are used for the XPS analyses shown in this section. The mean free path lenght depth of X-rays for Pt and Ru are in the 1.5-1.7 nm range [2], hence, the XPS ratios shown in Table II present an indication of the Pt to Ru surface ratios. Column 3 shows the same, but, for EDX measurements, which reflect the total Pt to Ru ratio of the catalysts and electrodes. It is seen that the EDX ratio is the same for all samples investigated, namely 75:25 at.% of Pt to Ru. This indicates that the electrochemical treatments did not affect the bulk of the catalyst powders. It is likely that changes that result in the different CH3OH oxidation activities take place at the catalyst surface.
The latter is confirmed by the XPS data. The XPS data suggest the same Pt to Ru at. % ratio of 47:53 (± 5 %) for the as-prepared, refluxed catalysts, and conditioned catalyst electrodes. The fact that the Pt to Ru surface ratios are the same for the as-prepared, refluxed and conditioned electrodes suggests that the catalyst surface is not altered by the conditioning of the electrode, i.e., cycling up to 0.4 V. Furthermore, the combined results for the Pt:Ru ratios obtained from XPS and EDX suggest a higher Ru content on the surface than in the bulk of the catalyst. For example, 100 potential cycles to an E+ value of 0.8 V results in a decrease of the amount of surface Ru, i.e., a larger Pt to Ru at. % ratio of 75 to 25 (Table II). These results, in combination with the fact that the CH3OH oxidation activity is enhanced upon the potential cycling treatment
using at least 50 cycles to 0.8 V, suggest that an excess amount of Ru on the catalyst surface reduces the optimal number of neighbouring Pt to Ru catalyst surface sites for the CH3OH
oxidation reaction. (According to the literature, an ideal CH3OH oxidation catalyst consists of 3
Pt and 1 neighboring Ru catalyst surface site [2].) Deconvolution of the XPS spectra for the Ru 3p region are shown in Fig. 6. The results suggest that Ru, in the form of Ru-oxides, is lost from the catalyst surface during the E-cycling experiment to the E+ value of 0.8 V.
Table II. Summary of XPS and EDX data for as-prepared, refluxed and E-cycled Pt25Ru75
catalyst powders
Sample XPt/XRu (at.%) I
Ru/IRuxOy (%)
From XPS From EDX
As prepared Pt75Ru25 45/55 76/24 30/70
Refluxed Pt75Ru25 47/53 73/27 31/69
Conditioned Pt75Ru25 47/53 73/27 31/69
Pt75Ru25 100 times E-cycled to 0.8 V 76/24 75/25 44/56
Summary and Conclusions
An unsupported PtxRuy alloy catalyst powder of 75:25 at.% Pt to Ru composition has been made.
Most of the Ru is dissolved in the Pt fcc lattice and the alloy and bulk composition of the powder are the same according to XRD and EDX measurements. XPS measurements reveal that an excess amount (not detectable by EDX) of Ru, likely in the form of Ru-oxide, is present on the
Fig.6 XPS of Ru 3p core level region of (a) the conditioned Pt75Ru25 electrode and (b) a
catalyst surface. Surface Ru is removable by electrochemical treatment of the catalyst powder. The electro-catalytic activity of the catalyst powder for the oxidation of CH3OH and stripping of
COads is influenced by the electrochemical treatment. The resulting activity depends on the
electrochemical treatment (number of cycles in combination with the E+ value). At potentials below 0.6 V, changes in the catalyst activity are not detected. However, changes in the catalytic activity of the alloy catalyst powders are clearly observed for E+ values of 0.8 V and higher. The latter also appears to be consistent with previous work that has shown that the Ru dissolution rate of Ru metal electrodes increases rapidly at potentials more positive than 0.8 V [9]. The potential cycling treatment to 0.8 V appears beneficial, as it results in an increase in the CH3OH
and COads stripping kinetics. The increase is observed after 50 potential cycles, and further
cycling (up to 300 cycles) does not significantly alter the electro-catalytic activity of the catalyst surface. At more positive potentials, the changes are more rapid and the catalyst surface appears to be become enriched in Pt. This is for example observed for the alloy catalyst powder cycled 50 times to 1.2 V. A refluxing treatment of the as-prepared PtxRuy catalyst powder in boiling 0.5
M H2SO4 did not result in a removal of the excess Ru. The electrochemical treatment was found
to be essential to achieve the higher CH3OH and COads stripping kinetics for this catalyst powder.
Additional studies are needed to test whether these treatments also apply for nano-sized and carbon supported Pt-Ru catalysts.
Acknowledgments
The authors thank D. Kingston and N. Lim from NRC, Ottawa for the XPS and EDX analysis, respectively. Financial support from DND is also gratefully acknowledged.
References
1. A. S. Aricò, S. Srinivasan and V. Antonucci, Fuel Cells, 1, 133 (2001).
2. C. Bock, B. MacDougall and Y. LePage, J. Electrochem. Soc., 151, A1269 (2004). 3. M. Watanabe and S. Motoo, J. Electroanal. Chem., 60, 267 (1975).
4. P. Piela, C. Eickes, E. Brosha, F. Garzon and P. Zelenay, J. Electrochem. Soc., 151, A2053 (2004). 5. T. I. Valdez, S. Firdosy, B. Koel and S. R. Narayanan, ECS Trans., 1, 293 (2006).
6. L. Gancs, N. Hakim, B. Hult and S. Mukerjee, ECS Trans., 3, 607 (2006).
7. L. Gancs, B. N. Hult, N. Hakim and S. Mukerjee, Electrochem. Solid-State Lett., 10, B150 (2007). 8. C. Bock, M. A. Blakely and B. MacDougall, Electrochim. Acta, 50, 2401 (2005).
9. Y. Sugawara, A. P. Yadav, A. Nishikata and T. Tsuru, J. Electrochem. Soc., 155, B897 (2008). 10. S. Hadzi-Jordanov, H. Angerstein-Kozlowska and B. E. Conway, J. Electroanal. Chem., 60, 359 (1975).
11. F. Maillard, M. Eikerling, O. V. Cherstiouk, S. Schreier, E. Savinova and U. Stimming, Faraday