HAL Id: hal-00295271
https://hal.archives-ouvertes.fr/hal-00295271
Submitted on 11 Jun 2003HAL is a multi-disciplinary open access archive for the deposit and dissemination of sci-entific research documents, whether they are pub-lished or not. The documents may come from teaching and research institutions in France or abroad, or from public or private research centers.
L’archive ouverte pluridisciplinaire HAL, est destinée au dépôt et à la diffusion de documents scientifiques de niveau recherche, publiés ou non, émanant des établissements d’enseignement et de recherche français ou étrangers, des laboratoires publics ou privés.
Pairs (CCP) of TOMS measurements
M. J. Newchurch, D. Sun, J. H. Kim, X. Liu
To cite this version:
M. J. Newchurch, D. Sun, J. H. Kim, X. Liu. Tropical tropospheric ozone derived using Clear-Cloudy Pairs (CCP) of TOMS measurements. Atmospheric Chemistry and Physics, European Geosciences Union, 2003, 3 (3), pp.683-695. �hal-00295271�
www.atmos-chem-phys.org/acp/3/683/
Chemistry
and Physics
Tropical tropospheric ozone derived using Clear-Cloudy Pairs
(CCP) of TOMS measurements
M. J. Newchurch1, D. Sun1, J. H. Kim2, and X. Liu1,3
1Atmospheric Science Department, University of Alabama in Huntsville, Huntsville, Alabama 2Department of Atmospheric Science, Pusan National University, Korea
3Now at Harvard Smithsonian Astrophysical Observatory, Cambridge, Massachusetts
Received: 8 November 2002 – Published in Atmos. Chem. Phys. Discuss.: 13 January 2003 Revised: 2 May 2003 – Accepted: 28 May 2003 – Published: 11 June 2003
Abstract. Using TOMS total-ozone measurements over high-altitude cloud locations and nearby paired clear loca-tions, we describe the Clear-Cloudy Pairs (CCP) method for deriving tropical tropospheric ozone. The high-altitude clouds are identified by measured 380 nm reflectivities greater than 80% and Temperature Humidity InfraRed (THIR) measured cloud-top pressures less than 200 hPa. To account for locations without high-altitude clouds, we apply a zonal sine fitting to the stratospheric ozone derived from available cloudy points, resulting in a wave-one amplitude of about 4 DU. THIR data is unavailable after November 1984, so we extend the CCP method by using a reflectivity thresh-old of 90% to identify high-altitude clouds and remove the influence of high-reflectivity-but-low-altitude clouds with a lowpass frequency filter. We correct ozone retrieval errors associated with clouds, and ozone retrieval errors due to sun glint and aerosols. Comparing CCP results with South-ern Hemisphere ADditional OZonesondes (SHADOZ) tro-pospheric ozone indicates that CCP trotro-pospheric ozone and ozonesonde measurements agree, on average, to within 3 ± 1 DU standard error of the mean. The most significant differ-ence between CCP and ozonesonde tropospheric ozone can be explained by the low Total Ozone Mapping Spectrometer (TOMS) version-7 retrieval efficiency of ozone in the lower troposphere.
1 Introduction
Several satellite-based methods derive tropospheric ozone distribution and variance. Each of these techniques embodies particular strengths and weaknesses. The first such method, the Tropospheric Ozone Residual (TOR) method using either Stratospheric Aerosol and Gas Experiment (SAGE) (Fish-Correspondence to: M. J. Newchurch
man and Brackett, 1997; Fishman et al., 1990) or Solar Backscatter UltraViolet (SBUV) (Fishman and Balok, 1999; Fishman et al., 1996), offers global estimates of tropospheric ozone, but suffers from uncertainty in the lower-stratospheric ozone amounts resulting from limited sampling and limited accuracy of the lower-stratospheric measurements. Deriving tropospheric ozone from TOMS data alone with some strato-spheric ozone assumptions (Hudson and Thompson, 1998; Kim et al., 1996; Thompson and Hudson, 1999; Ziemke et al., 1998) suffers from uncertainty in the assumptions. The topographic contrast method (Jiang and Yung, 1996; Kim and Newchurch, 1996; Kim and Newchurch, 1998) suffers from limited spatial coverage. The scan-angle method (Kim et al., 2001) is the most direct method for extracting tropo-spheric ozone from the physics of the altitudinal dependence of the information in the TOMS measurement. However, this method is currently restricted to tropical latitudes where the stratospheric variability is generally small.
This paper introduces the Clear-Cloudy Pair (CCP) method to derive tropospheric ozone from TOMS measure-ments. This method uses column-ozone measurements above high-altitude clouds to quantify the stratospheric column ozone, similar to the Convective Cloud Differential (CCD) method (Ziemke et al., 1998). The major differences between CCD and CCP are the following: (1) The CCP approach does not assume a zonally invariant stratospheric ozone structure. Rather than using cloudy points only in the Pacific Ocean, CCP uses all high-altitude cloudy points to fit a sine curve of unconstrained amplitude and phase. (2) A reflectivity thresh-old of 20% is used by the CCD technique to calculate to-tal column ozone, so some partial cloudy points will be in-cluded and may cause errors of a couple of DU, because the ozone below clouds is only a climatological estimate. How-ever, the CCP method uses a reflectivity threshold of the ac-tual clear-sky reflectivity plus 5% to identify clear-sky points and to calculate total column ozone. (3) The CCD tech-nique uses the minimum ozone above high-reflectivity clouds
5-day Average Number of Cloud Points
W180 W120 W60 0 E60 E120 E180 S15 S10 S5 0 N5 N10 N15 Latitude
(a)
0 2 4 6 8 10 12 14 16 18 20 225-day Avg Num of High-alt Cloud Points (THIR <200mb)
W180 W120 W60 0 E60 E120 E180 S15 S10 S5 0 N5 N10 N15 Latitude
(b)
0.0 0.2 0.4 0.5 1.0 2.0 3.0 4.0 5.0 6.0 7.0 8.0Average 5-day Minimum Cloud Top Pressure (mb)
W180 W120 W60 0 E60 E120 E180 S15 S10 S5 0 N5 N10 N15 Latitude
(c)
90 100 110 120 130 140 150 160 170 180 190Figure 1
Fig. 1. (a) The average number of cloud points (reflectivity >80%) in each 5◦by 5◦box for each five-day period during 1979–1984; (b) the
average number of high-altitude cloud points (reflectivity >80% and THIR <200 hPa) in each 5◦by 5◦box for each five-day period during
1979–1984; and (c) The average five-day minimum cloud top pressure (hPa) during 1979–1984.
in one month to represent the stratospheric ozone for that month, while the CCP method averages the minimum ozone amounts above high-altitude clouds for each five-day period in one month to represent the stratospheric ozone for that month. (4) The effects of high-reflectivity-but-low-altitude clouds and cloud anomaly are estimated and included in CCP method.
On average, the zonal sine-wave fitting results in a lon-gitudinal stratospheric wave-one with an average amplitude of ∼4 DU and a peak near the Prime Meridian, consistent with the wave structure of stratospheric ozone as mentioned by Ziemke et al. (1998) and described by Newchurch et al. (2001b) where the tropical stratospheric ozone is not zon-ally invariant, but follows a wave-1 pattern with an aver-age monthly amplitude of ∼4 DU. A wave-1 fit represents a first-order approximation to a phenomenon that proba-bly contains higher order wave numbers. Part of the dis-crepancy between the stratospheric wave-1 pattern found by Newchurch et al. (2001) using 5-day means and other re-searchers using monthly averages of stratospheric measure-ments may be explained by the potential effect of tropical Kelvin waves or equatorial Rossby waves that will not be
apparent in monthly averages. Subsequent correction for TOMS retrieval artifacts reduces the amplitude by about the half (see Sect. 5.3). Compared to the typical value of tro-pospheric ozone of 20∼30 DU, this average corrected wave-1 amplitude of 2 DU (Peak-to-trough difference of ∼4 DU with monthly excursions exceeding 5 DU) cannot be ne-glected. We use the Temperature Humidity Infrared Ra-diometer (THIR) measurements (Stowe et al., 1988) collo-cated with TOMS measurements on the NIMBUS-7 platform to assess both the true altitude of the reflecting clouds and the accuracy of using the TOMS measurement of reflectiv-ity at 380 nm alone as a proxy for cloud altitude. Com-parisons of the CCP tropical tropospheric ozone columns to the available ozonesonde record indicate an improvement of about 6 DU with respect to the archived CCD data from http://code916.gsfc.nasa.gov/People/Ziemke/ averaged over all available SHADOZ ozonesonde observations. Ziemke et al. (1998) recommended adjusting the archived CCD value by 5 DU based on Nimbus-7 /Earth Probe TOMS total column ozone differences; however, we use only the archived values here (use archived data without subtracting 5 DU).
-180 -90 0 90 180 -180 -90 0 90 180 -180 -90 0 90 180 -180 -90 0 90 180 -180 -90 0 90 180 -180 -90 0 90 180 -180 -90 0 90 180 -180 -90 0 90 180 -180 -90 0 90 180 -180 -90 0 90 180 -180 -90 0 90 180 -180 -90 0 90 180 -180 -90 0 90 180 -180 -90 0 90 180 -180 -90 0 90 180 -180 -90 0 90 180 -180 -90 0 90 180 -180 -90 0 90 180 -180 -90 0 90 180 -180 -90 0 90 180 -180 -90 0 90 180 -180 -90 0 90 180 -180 -90 0 90 180 -180 -90 0 90 180 -180 -90 0 90 180 -180 -90 0 90 180 -180 -90 0 90 180 -180 -90 0 90 180 -180 -90 0 90 180 -180 -90 0 90 180 -180 -90 0 90 180 -180 -90 0 90 180 -180 -90 0 90 180 -180 -90 0 90 180 -180 -90 0 90 180 -180 -90 0 90 180 -180 -90 0 90 180 -180 -90 0 90 180 -180 -90 0 90 180 -180 -90 0 90 180 -180 -90 0 90 180 -180 -90 0 90 180 -180 -90 0 90 180 -180 -90 0 90 180 -180 -90 0 90 180 -180 -90 0 90 180 -180 -90 0 90 180 -180 -90 0 90 180 -180 -90 0 90 180 -180 -90 0 90 180 -180 -90 0 90 180 -180 -90 0 90 180 -180 -90 0 90 180 -180 -90 0 90 180 -180 -90 0 90 180 -180 -90 0 90 180 -180 -90 0 90 180 -180 -90 0 90 180 -180 -90 0 90 180 -180 -90 0 90 180 -180 -90 0 90 180 -180 -90 0 90 180 -180 -90 0 90 180 -180 -90 0 90 180 -180 -90 0 90 180 -180 -90 0 90 180 -180 -90 0 90 180 -180 -90 0 90 180 -180 -90 0 90 180 -180 -90 0 90 180 -180 -90 0 90 180 -180 -90 0 90 180 -180 -90 0 90 180 -180 -90 0 90 180 -180 -90 0 90 180 -180 -90 0 90 180 -180 -90 0 90 180 -180 -90 0 90 180 -180 -90 0 90 180 -180 -90 0 90 180 -180 -90 0 90 180 -180 -90 0 90 180 -180 -90 0 90 180 -180 -90 0 90 180 -180 -90 0 90 180 -180 -90 0 90 180 -180 -90 0 90 180 -180 -90 0 90 180 -180 -90 0 90 180 -180 -90 0 90 180 -180 -90 0 90 180 -180 -90 0 90 180 -180 -90 0 90 180 -180 -90 0 90 180 -180 -90 0 90 180 -180 -90 0 90 180 -180 -90 0 90 180 -180 -90 0 90 180 -180 -90 0 90 180 -180 -90 0 90 180 -180 -90 0 90 180 -180 -90 0 90 180 -180 -90 0 90 180 -180 -90 0 90 180 -180 -90 0 90 180 -180 -90 0 90 180 -180 -90 0 90 180 -180 -90 0 90 180 -180 -90 0 90 180 -180 -90 0 90 180 -180 -90 0 90 180 -180 -90 0 90 180 -180 -90 0 90 180 -180 -90 0 90 180 -180 -90 0 90 180 -180 -90 0 90 180 -180 -90 0 90 180 -180 -90 0 90 180 -180 -90 0 90 180 -180 -90 0 90 180 -180 -90 0 90 180 -180 -90 0 90 180 -180 -90 0 90 180 -180 -90 0 90 180 -180 -90 0 90 180 -180 -90 0 90 180 -180 -90 0 90 180 -180 -90 0 90 180 -180 -90 0 90 180 -180 -90 0 90 180 -180 -90 0 90 180 -180 -90 0 90 180 -180 -90 0 90 180 -180 -90 0 90 180 -180 -90 0 90 180 -180 -90 0 90 180 -180 -90 0 90 180 -180 -90 0 90 180 -180 -90 0 90 180 -180 -90 0 90 180 -180 -90 0 90 180 -180 -90 0 90 180 -180 -90 0 90 180 -180 -90 0 90 180 -180 -90 0 90 180 -180 -90 0 90 180 -180 -90 0 90 180 -180 -90 0 90 180 -180 -90 0 90 180 -180 -90 0 90 180 -180 -90 0 90 180 -180 -90 0 90 180 -180 -90 0 90 180 -180 -90 0 90 180 -180 -90 0 90 180 -180 -90 0 90 180 -180 -90 0 90 180 -180 -90 0 90 180 -180 -90 0 90 180 -180 -90 0 90 180 -180 -90 0 90 180 -180 -90 0 90 180 -180 -90 0 90 180 -180 -90 0 90 180 -180 -90 0 90 180 -180 -90 0 90 180 -180 -90 0 90 180 -180 -90 0 90 180 -180 -90 0 90 180 -180 -90 0 90 180 -180 -90 0 90 180 -180 -90 0 90 180 -180 -90 0 90 180 -180 -90 0 90 180 -180 -90 0 90 180 -180 -90 0 90 180 -180 -90 0 90 180 -180 -90 0 90 180 -180 -90 0 90 180 -180 -90 0 90 180 -180 -90 0 90 180 -180 -90 0 90 180 -180 -90 0 90 180 -180 -90 0 90 180 -180 -90 0 90 180 -180 -90 0 90 180 -180 -90 0 90 180 -180 -90 0 90 180 -180 -90 0 90 180 -180 -90 0 90 180 -180 -90 0 90 180 -180 -90 0 90 180 -180 -90 0 90 180 -180 -90 0 90 180 -180 -90 0 90 180 -180 -90 0 90 180 -180 -90 0 90 180 -180 -90 0 90 180 -180 -90 0 90 180 -180 -90 0 90 180 -180 -90 0 90 180 -180 -90 0 90 180 -180 -90 0 90 180 -180 -90 0 90 180 -180 -90 0 90 180 -180 -90 0 90 180 -180 -90 0 90 180 -180 -90 0 90 180 -180 -90 0 90 180 -180 -90 0 90 180 -180 -90 0 90 180 -180 -90 0 90 180 -180 -90 0 90 180 -180 -90 0 90 180 -180 -90 0 90 180 -180 -90 0 90 180 -180 -90 0 90 180 -180 -90 0 90 180 -180 -90 0 90 180 -180 -90 0 90 180 -180 -90 0 90 180 -180 -90 0 90 180 -180 -90 0 90 180 -180 -90 0 90 180 -180 -90 0 90 180 -180 -90 0 90 180 -180 -90 0 90 180 -180 -90 0 90 180 -180 -90 0 90 180 -180 -90 0 90 180 -180 -90 0 90 180 -180 -90 0 90 180 -180 -90 0 90 180 -180 -90 0 90 180 -180 -90 0 90 180 -180 -90 0 90 180 -180 -90 0 90 180 -180 -90 0 90 180 -180 -90 0 90 180 -180 -90 0 90 180 -180 -90 0 90 180 -180 -90 0 90 180 -180 -90 0 90 180 -180 -90 0 90 180 -180 -90 0 90 180 -180 -90 0 90 180 -180 -90 0 90 180 -180 -90 0 90 180 -180 -90 0 90 180 -180 -90 0 90 180 -180 -90 0 90 180 -180 -90 0 90 180 -180 -90 0 90 180 -180 -90 0 90 180 -180 -90 0 90 180 -180 -90 0 90 180 -180 -90 0 90 180 -180 -90 0 90 180 -180 -90 0 90 180 -180 -90 0 90 180 -180 -90 0 90 180 -180 -90 0 90 180 -180 -90 0 90 180 -180 -90 0 90 180 -180 -90 0 90 180 -180 -90 0 90 180 -180 -90 0 90 180 -180 -90 0 90 180 -180 -90 0 90 180 -180 -90 0 90 180 -180 -90 0 90 180 -180 -90 0 90 180 -180 -90 0 90 180 -180 -90 0 90 180 -180 -90 0 90 180 -180 -90 0 90 180 -180 -90 0 90 180 -180 -90 0 90 180 -180 -90 0 90 180 -180 -90 0 90 180 -180 -90 0 90 180 -180 -90 0 90 180 -180 -90 0 90 180 -180 -90 0 90 180 -180 -90 0 90 180 -180 -90 0 90 180 -180 -90 0 90 180 -180 -90 0 90 180 -180 -90 0 90 180 -180 -90 0 90 180 -180 -90 0 90 180 -180 -90 0 90 180 -180 -90 0 90 180 -180 -90 0 90 180 -180 -90 0 90 180 -180 -90 0 90 180 -180 -90 0 90 180 -180 -90 0 90 180 -180 -90 0 90 180 -180 -90 0 90 180 -180 -90 0 90 180 -180 -90 0 90 180 -180 -90 0 90 180 -180 -90 0 90 180 -180 -90 0 90 180 -180 -90 0 90 180 -180 -90 0 90 180 -180 -90 0 90 180 -180 -90 0 90 180 -180 -90 0 90 180 -180 -90 0 90 180 -180 -90 0 90 180 -180 -90 0 90 180 -180 -90 0 90 180 -180 -90 0 90 180 -180 -90 0 90 180 -180 -90 0 90 180 -180 -90 0 90 180 -180 -90 0 90 180 -180 -90 0 90 180 -180 -90 0 90 180 -180 -90 0 90 180 -180 -90 0 90 180 -180 -90 0 90 180 -180 -90 0 90 180 -180 -90 0 90 180 -180 -90 0 90 180 -180 -90 0 90 180 -180 -90 0 90 180 -180 -90 0 90 180 -180 -90 0 90 180 -180 -90 0 90 180 -180 -90 0 90 180 -180 -90 0 90 180 -180 -90 0 90 180 -180 -90 0 90 180 -180 -90 0 90 180 -180 -90 0 90 180 -180 -90 0 90 180 -180 -90 0 90 180 -180 -90 0 90 180 -180 -90 0 90 180 -180 -90 0 90 180 -180 -90 0 90 180 -180 -90 0 90 180 -180 -90 0 90 180 -180 -90 0 90 180 -180 -90 0 90 180 -180 -90 0 90 180 -180 -90 0 90 180 -180 -90 0 90 180 -180 -90 0 90 180 -180 -90 0 90 180 -180 -90 0 90 180 -180 -90 0 90 180 -180 -90 0 90 180 -180 -90 0 90 180 -180 -90 0 90 180 -180 -90 0 90 180 -180 -90 0 90 180 Background Stratospheric Ozone
Background Stratospheric Ozone Background Stratospheric Ozone Background Stratospheric Ozone Background Stratospheric Ozone Background Stratospheric Ozone Background Stratospheric Ozone Background Stratospheric Ozone Background Stratospheric Ozone Background Stratospheric Ozone Background Stratospheric Ozone Background Stratospheric Ozone Background Stratospheric Ozone Background Stratospheric Ozone Background Stratospheric Ozone Background Stratospheric Ozone Background Stratospheric Ozone Background Stratospheric Ozone Background Stratospheric Ozone Background Stratospheric Ozone Background Stratospheric Ozone Background Stratospheric Ozone Background Stratospheric Ozone Background Stratospheric Ozone Background Stratospheric Ozone Background Stratospheric Ozone Background Stratospheric Ozone Background Stratospheric Ozone Background Stratospheric Ozone Background Stratospheric Ozone Background Stratospheric Ozone Background Stratospheric Ozone Background Stratospheric Ozone Background Stratospheric Ozone Background Stratospheric Ozone Background Stratospheric Ozone Background Stratospheric Ozone Background Stratospheric Ozone Background Stratospheric Ozone Background Stratospheric Ozone Background Stratospheric Ozone Background Stratospheric Ozone Background Stratospheric Ozone Background Stratospheric Ozone Background Stratospheric Ozone Background Stratospheric Ozone Background Stratospheric Ozone Background Stratospheric Ozone Background Stratospheric Ozone Background Stratospheric Ozone Background Stratospheric Ozone Background Stratospheric Ozone Background Stratospheric Ozone Background Stratospheric Ozone Background Stratospheric Ozone Background Stratospheric Ozone Background Stratospheric Ozone Background Stratospheric Ozone Background Stratospheric Ozone Background Stratospheric Ozone Background Stratospheric Ozone Background Stratospheric Ozone Background Stratospheric Ozone Background Stratospheric Ozone Background Stratospheric Ozone Background Stratospheric Ozone Background Stratospheric Ozone Background Stratospheric Ozone Background Stratospheric Ozone Background Stratospheric Ozone Background Stratospheric Ozone Background Stratospheric Ozone Background Stratospheric Ozone Background Stratospheric Ozone Background Stratospheric Ozone Background Stratospheric Ozone Background Stratospheric Ozone Background Stratospheric Ozone Background Stratospheric Ozone Background Stratospheric Ozone Background Stratospheric Ozone Background Stratospheric Ozone Background Stratospheric Ozone Background Stratospheric Ozone Background Stratospheric Ozone Background Stratospheric Ozone Background Stratospheric Ozone Background Stratospheric Ozone Background Stratospheric Ozone Background Stratospheric Ozone Background Stratospheric Ozone Background Stratospheric Ozone Background Stratospheric Ozone Background Stratospheric Ozone Background Stratospheric Ozone Background Stratospheric Ozone Background Stratospheric Ozone Background Stratospheric Ozone Background Stratospheric Ozone Background Stratospheric Ozone Background Stratospheric Ozone Background Stratospheric Ozone Background Stratospheric Ozone Background Stratospheric Ozone Background Stratospheric Ozone Background Stratospheric Ozone Background Stratospheric Ozone Background Stratospheric Ozone Background Stratospheric Ozone Background Stratospheric Ozone Background Stratospheric Ozone Background Stratospheric Ozone Background Stratospheric Ozone Background Stratospheric Ozone Background Stratospheric Ozone Background Stratospheric Ozone Background Stratospheric Ozone Background Stratospheric Ozone Background Stratospheric Ozone Background Stratospheric Ozone Background Stratospheric Ozone Background Stratospheric Ozone Background Stratospheric Ozone Background Stratospheric Ozone Background Stratospheric Ozone Background Stratospheric Ozone Background Stratospheric Ozone Background Stratospheric Ozone Background Stratospheric Ozone Background Stratospheric Ozone Background Stratospheric Ozone Background Stratospheric Ozone Background Stratospheric Ozone Background Stratospheric Ozone Background Stratospheric Ozone Background Stratospheric Ozone Background Stratospheric Ozone Background Stratospheric Ozone Background Stratospheric Ozone Background Stratospheric Ozone Background Stratospheric Ozone Background Stratospheric Ozone Background Stratospheric Ozone Background Stratospheric Ozone Background Stratospheric Ozone Background Stratospheric Ozone Background Stratospheric Ozone Background Stratospheric Ozone Background Stratospheric Ozone Background Stratospheric Ozone Background Stratospheric Ozone Background Stratospheric Ozone Background Stratospheric Ozone Background Stratospheric Ozone Background Stratospheric Ozone Background Stratospheric Ozone Background Stratospheric Ozone Background Stratospheric Ozone Background Stratospheric Ozone Background Stratospheric Ozone Background Stratospheric Ozone Background Stratospheric Ozone Background Stratospheric Ozone Background Stratospheric Ozone Background Stratospheric Ozone Background Stratospheric Ozone Background Stratospheric Ozone Background Stratospheric Ozone Background Stratospheric Ozone Background Stratospheric Ozone Background Stratospheric Ozone Background Stratospheric Ozone Background Stratospheric Ozone Background Stratospheric Ozone Background Stratospheric Ozone Background Stratospheric Ozone Background Stratospheric Ozone Background Stratospheric Ozone Background Stratospheric Ozone Background Stratospheric Ozone Background Stratospheric Ozone Background Stratospheric Ozone Background Stratospheric Ozone Background Stratospheric Ozone Background Stratospheric Ozone Background Stratospheric Ozone Background Stratospheric Ozone Background Stratospheric Ozone Background Stratospheric Ozone Background Stratospheric Ozone Background Stratospheric Ozone Background Stratospheric Ozone Background Stratospheric Ozone Background Stratospheric Ozone Background Stratospheric Ozone Background Stratospheric Ozone Background Stratospheric Ozone Background Stratospheric Ozone Background Stratospheric Ozone Background Stratospheric Ozone Background Stratospheric Ozone Background Stratospheric Ozone Background Stratospheric Ozone Background Stratospheric Ozone Background Stratospheric Ozone Background Stratospheric Ozone Background Stratospheric Ozone Background Stratospheric Ozone Background Stratospheric Ozone Background Stratospheric Ozone Background Stratospheric Ozone Background Stratospheric Ozone Background Stratospheric Ozone Background Stratospheric Ozone Background Stratospheric Ozone Background Stratospheric Ozone Background Stratospheric Ozone Background Stratospheric Ozone Background Stratospheric Ozone Background Stratospheric Ozone Background Stratospheric Ozone Background Stratospheric Ozone Background Stratospheric Ozone Background Stratospheric Ozone Background Stratospheric Ozone Background Stratospheric Ozone Background Stratospheric Ozone Background Stratospheric Ozone Background Stratospheric Ozone Background Stratospheric Ozone Background Stratospheric Ozone Background Stratospheric Ozone Background Stratospheric Ozone Background Stratospheric Ozone Background Stratospheric Ozone Background Stratospheric Ozone Background Stratospheric Ozone Background Stratospheric Ozone Background Stratospheric Ozone Background Stratospheric Ozone Background Stratospheric Ozone Background Stratospheric Ozone Background Stratospheric Ozone Background Stratospheric Ozone Background Stratospheric Ozone Background Stratospheric Ozone Background Stratospheric Ozone Background Stratospheric Ozone Background Stratospheric Ozone Background Stratospheric Ozone Background Stratospheric Ozone Background Stratospheric Ozone Background Stratospheric Ozone Background Stratospheric Ozone Background Stratospheric Ozone Background Stratospheric Ozone Background Stratospheric Ozone Background Stratospheric Ozone Background Stratospheric Ozone Background Stratospheric Ozone Background Stratospheric Ozone Background Stratospheric Ozone Background Stratospheric Ozone Background Stratospheric Ozone Background Stratospheric Ozone Background Stratospheric Ozone Background Stratospheric Ozone Background Stratospheric Ozone Background Stratospheric Ozone Background Stratospheric Ozone Background Stratospheric Ozone Background Stratospheric Ozone Background Stratospheric Ozone Background Stratospheric Ozone Background Stratospheric Ozone Background Stratospheric Ozone Background Stratospheric Ozone Background Stratospheric Ozone Background Stratospheric Ozone Background Stratospheric Ozone Background Stratospheric Ozone Background Stratospheric Ozone Background Stratospheric Ozone Background Stratospheric Ozone Background Stratospheric Ozone Background Stratospheric Ozone Background Stratospheric Ozone Background Stratospheric Ozone Background Stratospheric Ozone Background Stratospheric Ozone Background Stratospheric Ozone Background Stratospheric Ozone Background Stratospheric Ozone Background Stratospheric Ozone Background Stratospheric Ozone Background Stratospheric Ozone Background Stratospheric Ozone Background Stratospheric Ozone Background Stratospheric Ozone Background Stratospheric Ozone Background Stratospheric Ozone Background Stratospheric Ozone Background Stratospheric Ozone Background Stratospheric Ozone Background Stratospheric Ozone Background Stratospheric Ozone Background Stratospheric Ozone Background Stratospheric Ozone Background Stratospheric Ozone Background Stratospheric Ozone Background Stratospheric Ozone Background Stratospheric Ozone Background Stratospheric Ozone Background Stratospheric Ozone Background Stratospheric Ozone Background Stratospheric Ozone Background Stratospheric Ozone Background Stratospheric Ozone Background Stratospheric Ozone Background Stratospheric Ozone Background Stratospheric Ozone Background Stratospheric Ozone Background Stratospheric Ozone Background Stratospheric Ozone Background Stratospheric Ozone Background Stratospheric Ozone Background Stratospheric Ozone Background Stratospheric Ozone Background Stratospheric Ozone Background Stratospheric Ozone Background Stratospheric Ozone Background Stratospheric Ozone Background Stratospheric Ozone Background Stratospheric Ozone Background Stratospheric Ozone Background Stratospheric Ozone Background Stratospheric Ozone Background Stratospheric Ozone Background Stratospheric Ozone Background Stratospheric Ozone Background Stratospheric Ozone Background Stratospheric Ozone Background Stratospheric Ozone Background Stratospheric Ozone Background Stratospheric Ozone Background Stratospheric Ozone Background Stratospheric Ozone Background Stratospheric Ozone Background Stratospheric Ozone Background Stratospheric Ozone Background Stratospheric Ozone Background Stratospheric Ozone Background Stratospheric Ozone Background Stratospheric Ozone Background Stratospheric Ozone Background Stratospheric Ozone Background Stratospheric Ozone Background Stratospheric Ozone Background Stratospheric Ozone Background Stratospheric Ozone
Wave One
Figure. 2
Fig. 2. Schematic showing the construction of the stratospheric
ozone column. The background stratospheric column ozone re-sults from the TOMS measured ozone column above high-altitude clouds in the Pacific Ocean area for individual latitudes, and the zonal wave-1 phase of stratospheric column ozone is computed
from ozone above high-altitude clouds between 5◦and 10◦North
latitude and between 0◦and 5◦North latitude at all longitudes. The
wave-1 phase and amplitude are resulted from fitting all data and are not constranied by any a prior assumption.
2 Data description
The CCP method uses NIMBUS-7 TOMS version-7 Level-2 daily global measurements from November 1978 to May 1993 and Earth Probe TOMS measurements from July 1996 to 2000. The THIR cloud pressure, coincident with the NIMBUS-7 TOMS observations, is available from Novem-ber 1978 to NovemNovem-ber 1984. These infrared cloud-top mea-surements, which in conjunction with National Center for Environmental Protection (NCEP) temperature profiles pro-duce cloud-top heights reported on the Level-2 Version-7 TOMS data files, are adjusted as in (Newchurch et al., 2001b) (described below). The noise equivalent tempera-ture of THIR instrument at 11.5 um and 185 K (the typical temperature of tropical upper-troposphere) is 1.5◦(Hwang, 1982). Because the THIR-measured equivalent blackbody temperature is compared with the local monthly tempera-ture profile to derive the cloud top pressure, the accuracy of the derived cloud top pressure depends on the vertical variance of temperature profile. However, at the wet adi-abatic lapse rate of 6.5 K/km, a THIR uncertainty of 1.5 K amounts to only 1/4 km cloud top altitude uncertainty. That altitude uncertainty corresponds to ozone amounts less than 1 DU. Ozone retrieval errors due to sun glint (McPeters et al., 1996) and tropospheric aerosols (Torres and Bhartia, 1999) are corrected using the Dave reflectivity code (Per-sonal communication with C. G. Wellemeyer, 1999). In order to validate the results derived from our method, we used the following SHADOZ ozonesonde data: Samoa (14S, 171W; 1998–1999), Cristobal (1S, 90W; 1998–2000), Natal (5S, 35W; 1998–1999), Ascension Island (8S, 15W; 1998–2000), Nairobi (1S, 37E; 1998–2000), and Java (8S, 113E; 1998– 2000) (Thompson and Witte, 1999; Thompson et al., 2001).
The THIR data embedded in the TOMS dataset often reports cloud-top pressures between 60–80 hPa and
some-times lower. These pressures correspond to altitudes signifi-cantly higher than the typical tropical tropopause pressure of ∼100 hPa. Comparing these values to the only available two months of revised THIR pressures reveals that the archived values for pressures less than 200 hPa are always too low. In order to use the six years of archived THIR data (1979– 1984), we scaled the archived values to higher pressures ac-cording to the relationship shown in Fig. 1 in (Newchurch et al., 2001b)
3 Cloudy point distribution
Using the THIR observations from the NIMBUS-7 platform, Fig. 1a shows the number of high-reflectivity cloud points (reflectivity >80%) in every 5◦ by 5◦ region within five-day periods averaged over 1979∼1984. The Indian Ocean and Pacific Ocean areas experience a high frequency of cloud points while the South Atlantic experiences a low fre-quency of clouds. Figure 1b indicates the average number of high-altitude cloud points (reflectivity >80% and THIR <200 hPa) that are included in Fig. 1a. We can see that the west Pacific and the east Indian oceans have the largest number of high-altitude cloud points, ∼2–7, and the south Atlantic Ocean, the southeast Pacific Ocean, and east of Africa experience almost no high-altitude cloud points, ∼0– 2. Not only the west Pacific, but also most tropical areas have high-altitude cloudy points available to calculate strato-spheric ozone. Therefore, it is possible to use all cloudy points to derive tropospheric ozone, instead of cloudy points only in the west Pacific as in the CCD method. Figure 1c displays the average five-day minimum cloud top pressure, and most areas correspond to average cloud-top pressures of 110–140 mb, close to the climatological tropical tropopause of 100 mb; however, east Africa and the area between 15◦ south latitude, 10◦south latitude, 120◦west longitude, and 10◦east longitude correspond to low-altitude clouds. There-fore, we exclude those cloudy points when we calculate the CCP tropospheric ozone.
4 Clear-Cloudy Pair method
In the Clear-Cloudy Pair method, tropospheric ozone re-sults from the difference between the total column ozone at clear-sky points and the stratospheric ozone column at paired cloudy-sky points when the cloud top reaches the tropopause. 4.1 Calculate Stratospheric Column Ozone
Figure 2 is a diagram of the stratospheric column ozone derivation where stratospheric ozone is regarded as a com-bination of a zonal flat background and a zonal wave 1 of unconstrained a priori phase and amplitude. Over five-day periods, for each 5◦-longitude by 5◦-latitude box between 15◦N and 15◦S except boxes in east Africa and between 15◦
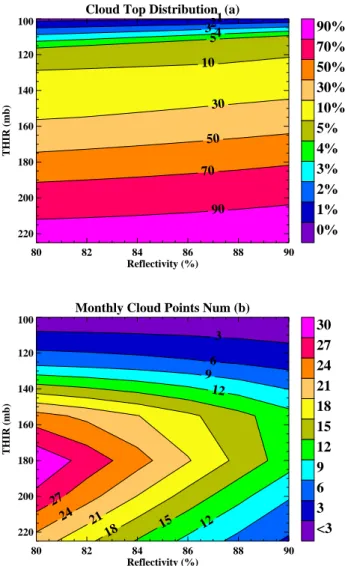
Cloud Top Distribution (a) 80 82 84 86 88 90 Reflectivity (%) 220 200 180 160 140 120 100 THIR (mb) 1 2 3 45 10 30 50 70 90 0% 1% 2% 3% 4% 5% 10% 30% 50% 70% 90%
Monthly Cloud Points Num (b)
80 82 84 86 88 90 Reflectivity (%) 220 200 180 160 140 120 100 THIR (mb) 3 6 9 12 12 15 18 21 24 27 <3 3 6 9 12 15 18 21 24 27 30
Figure 3
Fig. 3. (a) The THIR cloud-top distribution as a function of
reflec-tivity for pressures less than 225 hPa, and (b) the monthly average number of cloud points between 1979–1984 as functions of THIR pressure and reflectivity.
south latitude, 10◦south latitude, 120◦west longitude, and 10◦east longitude, which correspond to low-altitude clouds, we choose all the high-altitude cloudy-sky observations from TOMS measurements and choose the minimum of all ozone column above those clouds as the CCP estimate of strato-spheric ozone in each grid box. As shown in Fig. 1, the zone between 5◦N and 10◦N and the zone between 0◦S and 5◦S, corresponding to relatively even distribution of high-altitude cloud occurrence as in (Newchurch et al., 2001b), provides useful cloudy points to derive the phase of the stratospheric ozone wave. Every zone other than the 5◦N to 10◦N lati-tude zone and the 0◦S to 5◦S latitude zone contains insuffi-cient cloudy points to estimate the stratospheric ozone phase. Therefore, we apply the phases derived from the 5◦N to 10◦N latitude zone and from the 0◦S to 5◦S latitude zone to each zone in the Northern Hemisphere and Southern Hemisphere,
respectively. The derived phase is used in the sine fitting to all available stratospheric ozone values in each zone to derive the stratospheric ozone.
To identify high-altitude clouds with tops reaching the tropopause, we employ the following criteria: (a) 380 nm measured reflectivity is greater than 80%, because the TOMS Version-7 algorithm assumes that reflectivity greater than 80% implies a completely cloudy pixel (McPeters et al., 1996), and (b) THIR-derived cloud-top pressure is less than 200 hPa (after adjustment). Those criteria cannot guarantee that all clouds have reached the tropopause, but because few clouds penetrate the tropopause, the minimum of all col-umn ozone above the clouds in each grid box will corre-spond to the cloud closest to the tropopause. Instead of using monthly minimum of ozone above high-reflectivity clouds, the CCP technique chooses these five-day minimum ozone values above high-altitude clouds and then applies the sine wave-1 fitting to the monthly average value to get the strato-spheric ozone for the entire zone.
4.2 Calculate Total Column Ozone
Based on the TOMS algorithm, completely clear-sky points have reflectivity of less than 8% (McPeters et al., 1996). However, insufficient 8% reflectivity points are available to calculate the entire map of tropical total-column ozone, par-ticularly in continental areas. In order to acquire sufficient clear-sky points, we first calculate the surface reflectivity as described in (Herman et al., 2001; Herman and Celarier, 1997). Then we calculate the monthly average total column ozone at each 5◦by 5◦ box with points having reflectivity less than 5% above the surface reflectivity.
The CCP tropospheric column ozone then results from subtracting, for each five-day period, the stratospheric ozone from total ozone at each 5◦by 5◦box. Calculating the fun-damental CCP stratospheric column ozone over five-day pe-riods accounts for most of the perturbations of stratospheric ozone caused by Kelvin waves and Rossby-Gravity waves (Smith and Riese, 1999; Stanford et al., 1996; Ziemke and Stanford, 1994), which typically have periods longer than five days. We average these five-day samples of the strato-spheric ozone over one-month periods to reduce the random error and to increase the spatial coverage.
5 Errors in CCP technique and correcting mechanism The accuracy of CCP tropospheric ozone depends on the ac-curacy of TOMS total column ozone, the acac-curacy of the ozone above the clouds, and the correspondence of high-altitude cloud tops to the tropopause. Unfortunately, none of those three elements is perfect, so errors propagate into the derived CCP tropospheric ozone.
5.1 Lower tropospheric ozone retrieval efficiency
The retrieval efficiency error is a known and well-documented physical retrieval phenomenon that results from the less-than-perfect transmission of photons from the tro-posphere up to the space-borne instrument (Hudson et al., 1995; Kim et al., 1996; Kim et al., 2001). The magnitude of this error increases as the difference (in either direction) between actual and assumed tropospheric ozone from the TOMS algorithm increases. When the actual tropospheric ozone amount is higher than the assumed tropospheric ozone amount, TOMS underestimates column ozone. However, if actual tropospheric ozone amount is smaller than the as-sumed amount, TOMS overestimates column ozone. This phenomenon of imperfect tropospheric ozone sensing is also manifest in the situation described by (Wellemeyer et al., 1997) that shows the overestimation of TOMS total ozone at high latitude due to profile-shape error. The work of (Martin et al., 2001) also corroborates this relationship between the efficiency factor and the a priori profile. This adjustment is not offered as a “fix” to the CCP results, but only as a calcula-tion to understand the effect of the TOMS retrieval efficiency. Such an adjustment clearly requires knowledge of the true profile, which in general is an unknown quantity. The CCP dataset is archived at (http://vortex.nsstc.uah.edu/atmchem) without this efficiency adjustment, but the authors recom-mend the user combine the CCP tropospheric ozone and the correction of TOMS retrieval efficiency derived by (Martin et al., 2001) as the actual tropospheric ozone. This efficiency correction applies to version 7. The next TOMS data release, version 8, will incorporate an internal efficiency correction.
Correcting the retrieval efficiency effect requires the actual TOMS tropospheric ozone retrieval efficiency profile that de-pends on the actual tropospheric ozone profile, scan angle, solar zenith angle, and surface reflectivity. This connection is complex; however, an approximate method is available now. Using climatological tropospheric ozone profiles and typi-cal scan angle, solar zenith angle, and surface reflectivity, we run the TOMS radiative code and calculate the typical tropospheric ozone retrieval efficiency as 0.66. Therefore, TTO (Tropical Tropospheric Ozone)act ual = CCPmeasure + (1–0.66)∗(TTO
act ual – 33.8), where 33.8 is the
climatologi-cal tropospheric ozone used in the TOMS algorithm. From the above formula, we get the corrected TTO = (CCPmeasure – 33.8∗0.34)/ 0.66.
5.2 Difference between cloud top and tropopause
As shown in Fig. 1c, the five-day average highest cloud top is lower than the tropopause. This difference will introduce a tropospheric ozone underestimate of about 3 DU as esti-mated in (Newchurch et al., 2001b). Fortunately, this ozone difference is almost independent of longitude in tropical ar-eas, as described in (Newchurch et al., 2001b); therefore, it will not significantly affect the analysis of zonal CCP
tro-pospheric ozone. The latitudinal influence is not estimated because there is insufficient data.
5.3 The anomaly of ozone above the clouds
The third error source in the CCP method is the consistent large cloudy/clear total ozone difference between cloudy ar-eas and clear arar-eas after one corrects errors induced by in-correct cloud-heights (Liu et al., 2002). Analysis indicates that the remaining cloudy/clear total ozone difference result-ing from convection and enhanced chemical ozone produc-tion rate above the clouds is negligible, suggesting that the remaining cloudy ozone excess is mainly a result of ozone absorption inside the cloud. Direct estimation of the influ-ence of Ozone Above Clouds (OZAC) due to ozone inside the clouds requires the knowledge of the ozone’s distribu-tion in the cloud and the cloud’s complex optical structure. Detailed calculation of the ozone’s influence inside clouds is outside the scope of this paper. However, the analysis of the cloudy/clear total ozone difference provides an indirect way of estimating the effects related to clouds.
As described in (Liu et al., 2002), errors in OZAC due to incorrect cloud height range from −10.7 DU to −1.4 DU, with an average error of −3.9 ± 1.5 DU. Because of the in-correct climatological tropospheric ozone used in the TOMS algorithm, the added ozone below clouds has an error due to the difference between the actual and climatological ozone below cloud tops, and the clear-sky total ozone suffers from the lower retrieval efficiency for lower tropospheric ozone. To address those two problems, the monthly mean SHADOZ tropospheric profile is used and regarded as independent of latitude within the southern hemisphere and interpolated across the longitude to obtain the approximate true data for any tropical region. The approximate data in the Northern Hemisphere is six months out of phase with that in the South-ern Hemisphere. We compute errors in each 50 mb layer us-ing the height-resolved retrieval efficiency factors and inte-grate errors from surface pressure to monthly mean cloud-top pressure. The corrections range from −15 DU to 15 DU for cloudy total ozone scenes. The remaining cloudy/clear total ozone difference after accounting for errors from in-correct tropospheric climatology is ascribed to errors due to ozone absorption enhancement in the clouds, the assumption of Lambertian cloud surfaces, and other unknown errors. The result of these corrections is to reduce the amplitude of the stratospheric ozone wave 1 by a factor of two, on average.
No THIR data is available in the EP TOMS period. We reason that the errors induced by incorrect cloud height and incorrect tropospheric climatology are similar for both Nimbus-7 and EP TOMS. However, there is a consistent off-set in cloudy/clear total ozone difference between Nimbus-7 and EP TOMS data (Newchurch et al., 2001a; Ziemke and Chandra, 1999). The cloudy/clear total ozone difference in the EP-TOMS period is about 4.3 DU smaller than that of the Nimbus-7 TOMS period. This offset varies little with latitude
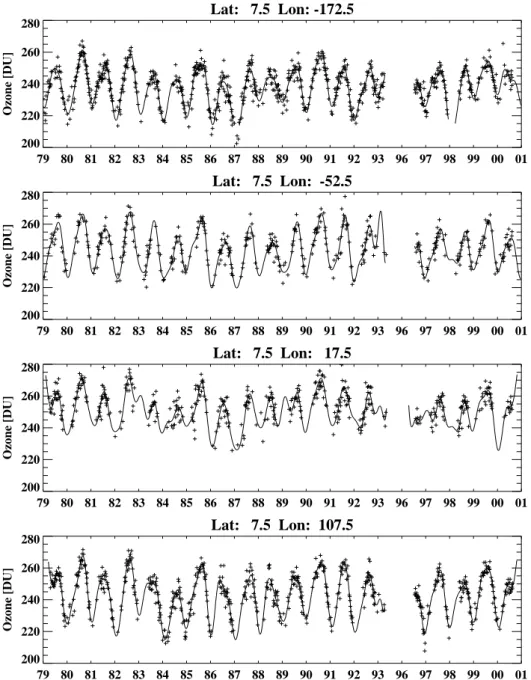
Lat: 7.5 Lon: -172.5 79 80 81 82 83 84 85 86 87 88 89 90 91 92 93 96 97 98 99 00 01 200 220 240 260 280 Ozone [DU] Lat: 7.5 Lon: -52.5 79 80 81 82 83 84 85 86 87 88 89 90 91 92 93 96 97 98 99 00 01 200 220 240 260 280 Ozone [DU] Lat: 7.5 Lon: 17.5 79 80 81 82 83 84 85 86 87 88 89 90 91 92 93 96 97 98 99 00 01 200 220 240 260 280 Ozone [DU] Lat: 7.5 Lon: 107.5 79 80 81 82 83 84 85 86 87 88 89 90 91 92 93 96 97 98 99 00 01 200 220 240 260 280 Ozone [DU]
Figure 4
Fig. 4. Time series of column ozone above clouds and their lowpass filtered values at four locations distributed longitudinally at 7.5◦N.
and season, and the reason for this Nimbus-7/EP offset is not currently clear; however, release of version 8 may show that Raman scattering by the O2dimer at 360 nm is responsible
for this offset. As a result, the cloudy anomaly correction for EP-TOMS is 4.3 DU smaller, on average, than the Nimbus-7 correction. Because this cloud anomaly correction should apply to all clear-cloudy difference methods, we apply it to the CCD method (Ziemke et al., 1998) for purposes of com-parison to SHADOZ observation (Sect. 7). This difference in the anomaly correction between Nimbus-7 / EP TOMS is of the same magnitude and sign as the Nimbus-7/EP TOMS offset in total column ozone seen by (Ziemke and Chandra,
1999) and may result from the same fundamental cause. We subtract a constant 4.3 DU from the error in OZAC derived from 1979–1984 to approximate the OZAC error during the EP-TOMS period.
6 Tropospheric ozone derivation without THIR Because THIR data is unavailable after November 1984, we cannot determine the actual cloud top altitude. However, the TOMS 380-nm reflectivity measurements provide some information to discern cloud altitude. Figure 3a indicates that, in general, more highly reflecting clouds occur at lower
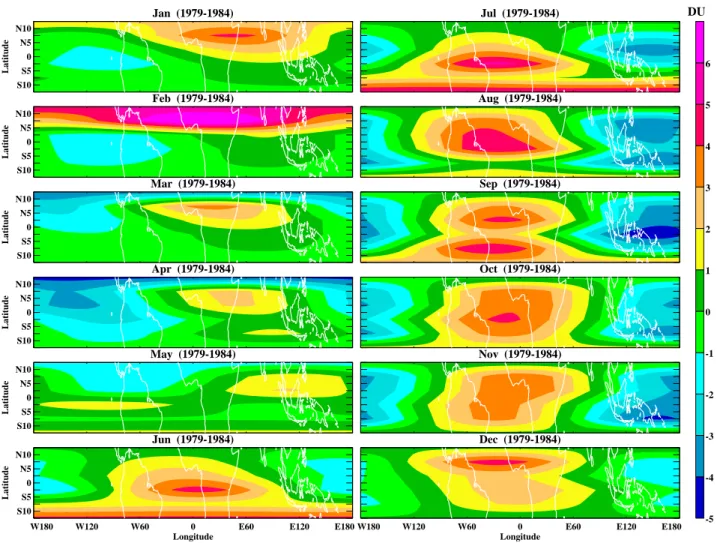
Jan (1979-1984) S10 S5 0 N5 N10 Latitude Feb (1979-1984) S10 S5 0 N5 N10 Latitude Mar (1979-1984) S10 S5 0 N5 N10 Latitude Apr (1979-1984) S10 S5 0 N5 N10 Latitude May (1979-1984) S10 S5 0 N5 N10 Latitude Jun (1979-1984)
W180 W120 W60 0 E60 E120 E180 Longitude S10 S5 0 N5 N10 Latitude Jul (1979-1984) Aug (1979-1984) Sep (1979-1984) Oct (1979-1984) Nov (1979-1984) Dec (1979-1984)
W180 W120 W60 0 E60 E120 E180 Longitude -5 -4 -3 -2 -1 0 1 2 3 4 5 6 DU
Figure 5
Fig. 5. Average monthly difference (THIR CCP minus No-THIR CCP) between tropospheric ozone derived from the CCP method with
THIR and without THIR cloud data over 1979–1984.
pressures, as previously reported (Eck et al., 1987; Stowe et al., 1988). For reflectivities greater than 80%, almost all the clouds (90%) occur at altitudes above 210 hPa (within ∼100 hPa of the tropopause). Most cloud-top pressures cor-respond to 160–200 hPa (Fig. 3b). These distributions vary somewhat with month, year, and location.
To remove low-altitude cloud points and to provide a con-tinuous record at all grid points, we apply a lowpass fre-quency filter to the time series of ozone observations above high-reflectivity (90%) cloud points for each 5◦ by 5◦ grid cell over 20 years. Figure 4 displays examples of the pentad values from four grid cells of the ozone above cloudy points and the ozone column value resulting from the lowpass fil-ter using a minimum frequency of two months. This low-pass filter is essentially a smoothing function that provides a continuous time series at every grid cell and reduces the extreme values, especially the value corresponding to high-reflectivity-but-low-altitude clouds. One limitation of this fil-tering technique is the presence of end effects in the first and last 1/4 cycles (1st and last 3 months) that will either increase
or decrease the derived tropospheric ozone, perhaps by as much as 15 DU at some locations. The CCP tropospheric ozone then results from the process described in Sections 4 and 5.
In addition to the errors identified in section 5, another er-ror source exists in the no-THIR CCP method; that is the difference of stratospheric ozone quantified by both reflec-tivity and THIR compared to ozone derived from reflecreflec-tivity only. Figure 5 shows the difference (THIR CCP minus No-THIR CCP) tropospheric ozone over 1979–1984, the period when both THIR data and reflectivity data are available. The difference in the Pacific Ocean is negative, and the differ-ences in the Atlantic and African areas usually correspond to positive values. The positive differences have a strong de-pendence on the seasonal InterTropical Convergence Zone (ITCZ) movement. In the ITCZ area the difference is small; otherwise, the difference is larger. However, the difference is within about 4 DU nearly everywhere; therefore, the ex-tended CCP method (using reflectivity observations without THIR measurements) may cause errors with typical value of
Ascension Island
0 5 10 15 20 25 Month from Jan, 1998
10 20 30 40 50
Trop Ozone (DU)
San Cristobal, Galapagos
0 5 10 15 20 25 Month from Jan, 1998
10 20 30 40 50
Trop Ozone (DU)
Natal, Brazil
0 5 10 15 20 25 Month from Jan, 1998
10 20 30 40 50
Trop Ozone (DU)
Nairobi, Kenya
0 5 10 15 20 25 Month from Jan, 1998
10 20 30 40 50
Trop Ozone (DU)
Watukosek, Java - Indonesia
0 5 10 15 20 25 Month from Jan, 1998
10 20 30 40 50
Trop Ozone (DU)
Pago Pago, American Samoa
0 5 10 15 20 25 Month from Jan, 1998
10 20 30 40 50
Trop Ozone (DU)
Figure 6
Fig. 6. Comparison of CCD and CCP tropospheric ozone with SHADOZ tropospheric ozone from 1998–2000 at six sites. Red circles are
the sonde integrated tropospheric ozone columns, vertical bars represent 1 SD of the ozonesonde monthly mean, black lines represent the CCD tropospheric columns, blue lines represent the derived CCP tropospheric columns, and green lines are the CCD results after applying the correction from the cloud anomalies offset between Nimbus-7 / EP TOMS.
4 DU. We have included this difference in the derived CCP tropospheric ozone to reduce the error related to low-altitude clouds.
7 Accuracy assessment of CCP
The comparison results of the CCP and CCD appear in Fig. 6 along with the ozonesonde monthly means ±1 standard devi-ation. The tropopause is determined using WMO tropopause
definition when integrating sonde tropospheric ozone. To quantify the comparison we show the station mean differ-ences ±1 standard deviation and 1 standard error of the mean in Table 1. The mean the of difference between SHADOZ and CCP across all stations is 0 ± 1 DU SEM. From station to station, the mean difference varies from −4 DU at Ascension to 1 DU at Samoa and San Cristobal. These mean differences are significantly smaller than the SHADOZ-CCD biases of 9 ±1 SEM.
Ascension 8601 8607 8701 8707 8801 8807 8901 8907 9001 9007 9101 9107 9201 9207 9212 10 20 30 40 50
Trop Ozone (DU)
Natal 8601 8607 8701 8707 8801 8807 8901 8907 9001 9007 9101 9107 9201 9207 9212 10 20 30 40 50
Trop Ozone (DU)
Brazzaville 8601 8607 8701 8707 8801 8807 8901 8907 9001 9007 9101 9107 9201 9207 9212 10 20 30 40 50
Trop Ozone (DU)
Samoa 8601 8607 8701 8707 8801 8807 8901 8907 9001 9007 9101 9107 9201 9207 9212 10 20 30 40 50
Trop Ozone (DU)
Figure 7
Fig. 7. Comparison of Nimbus-7 CCD and CCP tropospheric ozone with sonde measurements at four stations – Ascension Island, Natal,
Brazzaville, and Samoa – over 1986–1992. Red circles are the sonde integrated tropospheric ozone columns, vertical bars represent 1 SD of the ozonesonde monthly mean, black lines represent the CCD tropospheric columns, and blue lines represent the derived CCP tropospheric columns.
The cloud anomaly offset between Nimbus-7 and EP TOMS (cloudy/clear total ozone difference between Nimbus-7 and EP TOMS) discussed in Sect. 5.3 also works with the CCD technique because it uses cloud points to calculate stratospheric ozone as well. The green lines in Fig. 6 indi-cate the CCD values that resulted with this offset correction, which significantly improves the comparison of SHADOZ and CCD tropospheric ozone in all stations.
Nimbus-7 TOMS CCP and CCD tropospheric ozone is compared to ozonesonde observations between 1986–1992 in Fig. 7. At all stations Ascension Island, Natal, Braz-zaville and Samoa, both CCP and CCD are comparable to ozonesonde measurements.
The CCD method described by (Ziemke et al., 1998) also uses high-altitude clouds to determine the stratospheric ozone column for subtraction from the total ozone to derive
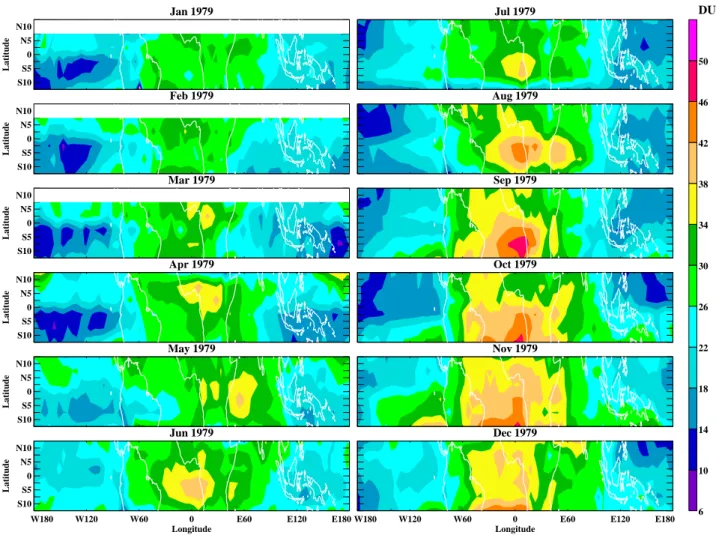
Jan 1979 S10 S5 0 N5 N10 Latitude Feb 1979 S10 S5 0 N5 N10 Latitude Mar 1979 S10 S5 0 N5 N10 Latitude Apr 1979 S10 S5 0 N5 N10 Latitude May 1979 S10 S5 0 N5 N10 Latitude Jun 1979
W180 W120 W60 0 E60 E120 E180 Longitude S10 S5 0 N5 N10 Latitude Jul 1979 Aug 1979 Sep 1979 Oct 1979 Nov 1979 Dec 1979
W180 W120 W60 0 E60 E120 E180 Longitude 6 10 14 18 22 26 30 34 38 42 46 50 D:\toms\documents\paper\ccp\1979_1984_THIR_ccp.ps Figure 8 DU
Fig. 8. CCP tropospheric ozone derived with THIR cloud-height and Nimbus-7 TOMS 380-nm reflectivity information in 1979.
Table 1. The Average Differences in % (CCx – SHADOZ) ±1 Standard Deviation (sd) and Standard Errors Of The Mean (SEM)
Differ-ences Between CCx and SHADOZ Tropospheric Ozone. The CCD data are from http://code916.gsfc.nasa.gov/People/Ziemke/ without any subtraction for NIMBUS-7/EP TOMS offset. CCD’ refers to the corrected CCD with the clear/cloud total column ozone difference of N7/EP TOMS, but without the 5 DU subtraction from EP TOMS based on a clear-sky total ozone column offset between NIMBUS-7 and EP TOMS.
SHADOZ CCP-SHADOZ CCP-SHADOZ CCD-SHADOZ CCD-SHADOZ CCD’-SHADOZ CCD’-SHADOZ
Station ±1sd SEM ±1sd SEM ±1sd SEM
Ascension 2 ± 4 1 7 ± 5 1 6 ± 5 1 San Cristobal 2 ± 5 1 8 ± 3 1 5 ± 3 1 Natal 5 ± 4 2 10 ± 6 2 8 ± 5 2 Nairobi 8 ± 4 1 7 ± 3 1 5 ± 3 1 Java 0 ± 6 1 10 ± 6 1 8 ± 6 1 Samoa 0 ± 4 1 11 ± 4 1 8 ± 5 1 Average 3 ± 5 1 9 ± 5 1 7 ± 5 1
tropospheric ozone. That method assumes the tropical strato-spheric ozone is zonally invariant and is determined by the monthly mean of minimum ozone above high-reflectivity (re-flectivity ≥90%) clouds in each 5◦by 5◦region across the Pacific Ocean from 120◦E to 120◦W. However, the CCD
method does not correct the error due to clouds, and it uses the monthly minimum ozone average over the west Pacific Ocean rather than the five-day minimum ozone over all trop-ical area used in CCP method. The CCD archived values typ-ically report 7–11 DU more tropospheric ozone than does the
Jan 1997 S10 S5 0 N5 N10 Latitude Feb 1997 S10 S5 0 N5 N10 Latitude Mar 1997 S10 S5 0 N5 N10 Latitude Apr 1997 S10 S5 0 N5 N10 Latitude May 1997 S10 S5 0 N5 N10 Latitude Jun 1997
W180 W120 W60 0 E60 E120 E180 Longitude S10 S5 0 N5 N10 Latitude Jul 1997 Aug 1997 Sep 1997 Oct 1997 Nov 1997 Dec 1997
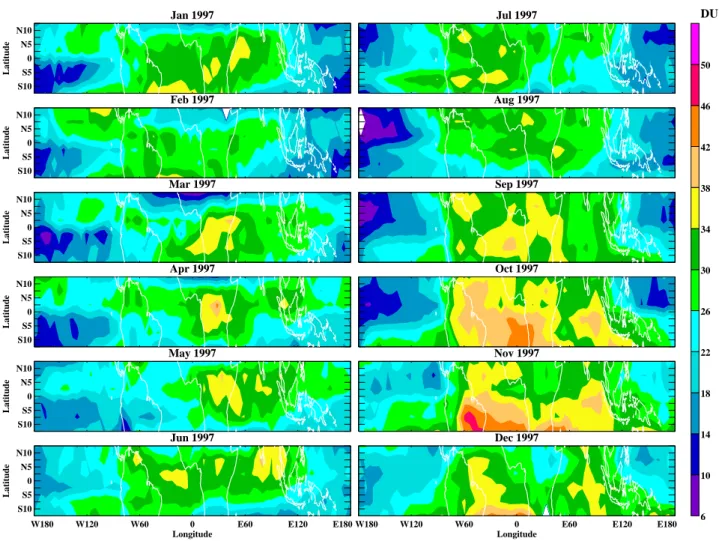
W180 W120 W60 0 E60 E120 E180 Longitude 6 10 14 18 22 26 30 34 38 42 46 50 DU D:\toms\documents\paper\ccp\1979_2000_REFL_ccp.ps Figure 9 Fig. 9. CCP tropospheric ozone derived with EP TOMS 360-nm reflectivity information in 1997.
CCP method. Overall the archived CCD tropospheric ozone column results are 9 ± 1 SEM DU higher than all SHADOZ stations, on average, while the CCP results are 3 ± 1 SEM DU higher. Because upper tropospheric ozone over the Pa-cific ocean is relatively low, the omission of these cloud ef-fects in the CCD method is fortuitously less significant than it would have been over the Atlantic ocean.
7.1 Results
CCP tropospheric ozone amounts and maps for 1979–2000 (excluding 1994–1995) and error correction data are avail-able at http://vortex.nsstc.uah.edu/atmchem. Figure 8 dis-plays the CCP tropospheric ozone derived with THIR and reflectivity in 1979. We can see that the maximum tropo-spheric ozone (∼50 DU) occurs in July to November in the south Atlantic with evidence of increased amounts in north-ern equatorial Africa in December. The westnorth-ern Pacific ex-periences the lowest tropospheric ozone (minimum ∼10 DU) with relatively less annual variation. Figure 9 indicates the CCP tropospheric ozone derived using the reflectivity
mea-surement without THIR cloud data in 1997. The highest ozone in this year occurs in the Indonesian areas, a result of forest fires and El Ni˜no (Ziemke and Chandra, 1999). Ozone amounts are significantly higher from South America to In-donesia throughout the biomass burning season of October– November.
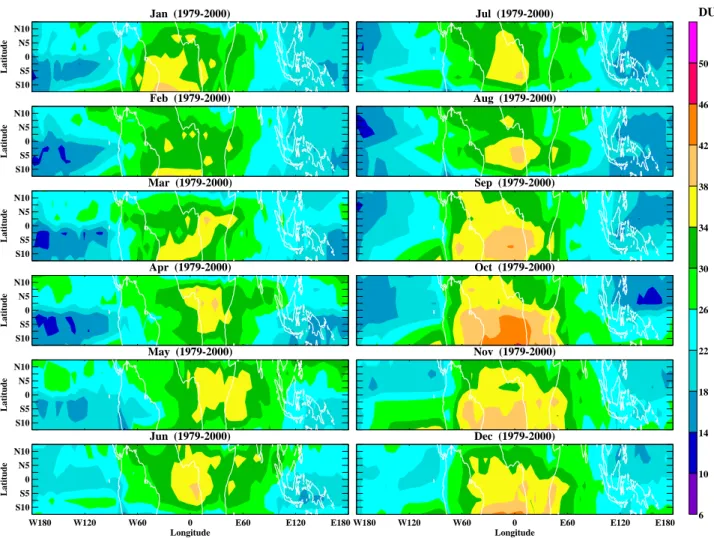
Figure 10 displays the 20-year monthly climatology of tro-pospheric ozone for 1979–2000 using the reflectivity mea-surement for cloud detection. The climatology of monthly tropospheric ozone from 1979–1984 using the THIR cloud data is very similar to that using the reflectivity data only. This climatology indicates persistent Pacific Ocean ozone amounts of 15–20 DU and seasonally varying ozone amounts of 30–40 DU in the Atlantic region. Individual months and locations show greater variations and extremes.
8 Conclusions
The Clear-Cloudy Pair (CCP) method derives tropical tro-pospheric ozone amounts from differences between TOMS
Jan (1979-2000) S10 S5 0 N5 N10 Latitude Feb (1979-2000) S10 S5 0 N5 N10 Latitude Mar (1979-2000) S10 S5 0 N5 N10 Latitude Apr (1979-2000) S10 S5 0 N5 N10 Latitude May (1979-2000) S10 S5 0 N5 N10 Latitude Jun (1979-2000)
W180 W120 W60 0 E60 E120 E180 Longitude S10 S5 0 N5 N10 Latitude Jul (1979-2000) Aug (1979-2000) Sep (1979-2000) Oct (1979-2000) Nov (1979-2000) Dec (1979-2000)
W180 W120 W60 0 E60 E120 E180 Longitude 6 10 14 18 22 26 30 34 38 42 46 50 DU D:\toms\documents\paper\ccp\1979_2000_Climate_ccp.ps Figure 10
Fig. 10. Climatology of tropospheric ozone derived from the CCP method without THIR information between 1979–2000.
observations of stratospheric ozone over high-altitude clouds and clear columns. Accounting for the zonally varying stratospheric column improves agreement between these de-rived columns and collocated ozonesonde columns. Al-though using cloud heights measured by the Temperature Humidity Infrared Radiometer (THIR) sensor (1978–1984) is more accurate than using the TOMS 380-nm reflec-tivity observations alone, using the 380-channel measure-ments as an approximation for high altitude clouds results in very similar tropospheric ozone columns. Comparison to 6 ozonesonde station observations indicates an average agree-ment in the tropospheric columns of 0 DU, varying from sta-tion to stasta-tion between −3 and 2 DU with standard errors of the mean of ∼1 DU. Results for individual months as well as climatologies over the 6-year THIR period and the 20-year TOMS period are available at http://vortex.nsstc.uah. edu/atmchem/.
Acknowledgements. We are grateful for support of this research
through the NASA/ACMAP and the international collaboration
with the Korean Ministry of Science and Technology. We
thank S. Chandra, J. Ziemke, P. K. Bhartia, C. G. Wellemeyer,
R. D. Hudson, and R. D. McPeters for enlightening discus-sions concerning use of convective clouds to derive tropospheric ozone. SHADOZ (Southern Hemisphere ADditional OZoneson-des) data was obtained from http://hyperion.gsfc.nasa.gov/Data services/shadoz/Shadoz hmpg2.html, CCD data was obtained from http://code916.gsfc.nasa.gov/People/Ziemke/.
References
Eck, T. F., Bhartia, P. K., Hwang, P. H., and Stowe, L. L.: Reflec-tivity of earth’s surface and clouds in ultraviolet from satellite observations, J. Geophys. Res., 92, 4287–4296, 1987.
Fishman, J. and Balok, A. E.: Calculation of daily tropospheric ozone residuals using TOMS and empirically improved SBUV measurements: Application to an ozone pollution episode over the eastern United States, J. Geophys. Res., 104, 30 319–30 340, 1999.
Fishman, J. and Brackett, V. G.: The climatological distribution of tropospheric ozone derived from satellite measurements using version 7 Total Ozone Mapping Spectrometer and Stratospheric Aerosol and Gas Experiment data sets, J. Geophys. Res., 102, 19 275–19 278, 1997.