Publisher’s version / Version de l'éditeur:
Proceedings of the Combustion Institute, 34, 1, pp. 1795-1802, 2012-07-19
READ THESE TERMS AND CONDITIONS CAREFULLY BEFORE USING THIS WEBSITE.
https://nrc-publications.canada.ca/eng/copyright
Vous avez des questions? Nous pouvons vous aider. Pour communiquer directement avec un auteur, consultez la
première page de la revue dans laquelle son article a été publié afin de trouver ses coordonnées. Si vous n’arrivez pas à les repérer, communiquez avec nous à [email protected].
Questions? Contact the NRC Publications Archive team at
[email protected]. If you wish to email the authors directly, please see the first page of the publication for their contact information.
NRC Publications Archive
Archives des publications du CNRC
This publication could be one of several versions: author’s original, accepted manuscript or the publisher’s version. / La version de cette publication peut être l’une des suivantes : la version prépublication de l’auteur, la version acceptée du manuscrit ou la version de l’éditeur.
For the publisher’s version, please access the DOI link below./ Pour consulter la version de l’éditeur, utilisez le lien DOI ci-dessous.
https://doi.org/10.1016/j.proci.2012.07.006
Access and use of this website and the material on it are subject to the Terms and Conditions set forth at
Soot formation in a laminar ethylene/air diffusion flame at pressures
from 1 to 8atm
Guo, Hongsheng; Gu, Zhongzhu; Thomson, Kevin A.; Smallwood, Gregory
J.; Baksh, Fazil F.
https://publications-cnrc.canada.ca/fra/droits
L’accès à ce site Web et l’utilisation de son contenu sont assujettis aux conditions présentées dans le site LISEZ CES CONDITIONS ATTENTIVEMENT AVANT D’UTILISER CE SITE WEB.
NRC Publications Record / Notice d'Archives des publications de CNRC:
https://nrc-publications.canada.ca/eng/view/object/?id=271f61a1-2715-4072-92c6-9ae088bcd407 https://publications-cnrc.canada.ca/fra/voir/objet/?id=271f61a1-2715-4072-92c6-9ae088bcd4071
Soot Formation in a Laminar Ethylene/Air Diffusion Flame at
Pressures from 1 to 8 atm
Hongsheng Guoa*
, Zhongzhu Gub, Kevin A. Thomsona, Gregory J. Smallwooda, Fazil F. Baksha
a
National Research Council of Canada, Ottawa, Ontario K1A 0R6, Canada
b
Nanjing Normal University, Nanjing 210042, Jiangsu, P.R. China
*Corresponding author:
Dr. Hongsheng Guo
National Research Council of Canada 1200 Montreal Road, Building M9 Ottawa, Ontario
Canada K1A 0R6 Phone: 1-613-991-0869 Fax: 1-613-957-7869
Email: [email protected]
Colloquium:
Soot, PAH and other large moleculesLength:
3996 + 629 + 114 + 292 + 1149 = 6180Main text: 3996 (word processor) References: (34+2)*2.3*7.6=629 Equation: 22.8*5=114
Table: 292
Figures: 1149 (Fig. 1: 479, Fig. 2: 129, Fig. 3: 130, Fig. 4: 139, Fig. 5: 133, Fig. 6: 139)
2
Abstract
The effect of pressure on soot formation in a laminar ethylene/air coflow diffusion flame was investigated by experiments and numerical simulation at pressures from 1 to 8 atm. Soot volume fraction was measured by the diffuse-light two-dimensional line-of-sight attenuation optical diagnostic method and calculated by moments model and a relatively detailed gas phase chemistry. The numerical model successfully captured the variation of soot volume fraction with increasing pressure. The detailed analysis of numerical simulation results suggests that although the rates of all soot formation sub-processes increase with increasing pressure, the rates of increase of these sub-processes differ, with that of PAH condensation being the fastest, followed by those of inception and acetylene addition, respectively. At atmosphere pressure, acetylene addition contributes most to soot formation in terms of the overall formed soot mass, while the contribution of PAH condensation significantly increases at high pressures. The variation in the soot formation mechanism is due to the different increase rates of the mole concentrations and formation of several key species that significantly affect soot inception, acetylene addition and PAH condensation.
3
1.
Introduction
Soot is one of primary pollutants emitted during the combustion of hydrocarbon fuels. It not only has a detrimental effect on human health [1,2], but also contributes significantly to global warming [3]. Various restrictions have been placed on soot emissions. Understanding the fundamental mechanisms is crucial for the development of strategies to reduce soot emissions. Since most practical combustion devices operate at higher pressure conditions, it is of great importance to understand the effect of pressure on soot formation.
Flower and Bowman [4] investigated soot formation in ethylene/air axisymmetric laminar diffusion flames at pressures from 1 to 10 atm by measuring the attenuation of laser light across the flame diameter. They observed that the maximum line-of-sight integrated soot volume fraction was proportional to the pressure raised to an exponent of about 1.2. McCrain and Roberts [5] measured soot formation in laminar ethylene and methane diffusion flames and found that both local peak soot volume fraction and integrated soot
volume fraction scaled with pn but n was different for the peak soot volume fraction and the integrated soot
volume fraction. Recently, Thomson et al. [6], Joo and Gülder [7], Bento et al. [8] and Mandatori and Gülder [9] experimentally investigated soot formation in laminar coflow diffusion flames at high pressures for various fuels. They also found that the peak carbon conversion was proportional to pressure to an nth power, with n slightly differing for different fuels and at different pressure range.
The effect of pressure on soot formation in laminar premixed flames has been studied by Mätzing and Wagner [10], Böhm et al. [11,12] and Heidermann et al. [13]. It was observed that an increase in pressure caused not only an increase in soot formation rate but also a change in the mechanism of soot formation in
premixed flames. In comparison with the soot growth rate at atmosphere pressure, acetylene (C2H2) did not
play a significant role any more for soot growth at high pressures [12].
The numerical studies on the effect of pressure on soot formation have also been conducted by a few groups. Böhm et al. [12] calculated the concentration profiles of some important species in laminar premixed ethylene/air flames at high pressures, and found that the increase rate of the maximum carbon density of acetylene was slower than that of polycyclic aromatic hydrocarbons (PAH) with increasing pressure. However, soot was not included in the calculation in [12]. Zhang and Ezekoye [14] numerically investigated soot formation at elevated pressures in a methane/air diffusion flame using a reduced gas phase chemistry and
4
showed that the increased density resulted in the higher soot concentration at high pressures. Liu et al. [15] and Charest et al. [16-18] numerically investigated soot formation in methane/air and ethylene/air diffusion flames by using relatively detailed gas phase chemistry. They also concluded that the effect of pressure on soot formation was largely attributed to the increased density. The numerical studies in [14-18] have used
simplified C2H2 based two-equation soot model and neglected PAH chemistry. It has been shown that C2H2
based soot model may fail to capture some important process in soot formation [19,20]. Further, due to the neglect of PAH chemistry in [14-18] for diffusion flames, the observed difference in the increasing rates of
carbon densities of C2H2 and PAH with increasing pressure in premixed flames by Böhm et al. [12] were not
examined. Consequently, it is not clear yet if an increase in pressure also causes a variation in the rate determining process of soot formation in diffusion flames. Therefore, it is of interest to further numerically investigate the effect of pressure on soot formation in diffusion flames using a more detailed soot model and chemistry which includes PAH.
In this paper, soot formation in a laminar ethylene/air diffusion flame at different pressures is investigated by experiment and numerical simulation using a relatively detailed soot model and a complex gas phase chemistry including PAH. The purpose is to investigate the mechanisms of soot formation in laminar diffusion flames at different pressures. The numerical results are validated by the measured data and then the details from numerical simulation are used to analyze the effect of pressure on soot formation. The paper starts with the description of experimental methodology, followed by the numerical model. Then the experimental and numerical results are demonstrated and compared, and the discussion on the mechanism of the effect of pressure on soot formation is provided.
2. Experimental Methodology
The flames were experimentally generated by a coflow laminar diffusion flame burner that was installed inside a pressure vessel. The burner consisted of a fuel nozzle with inner diameter of 2.29 mm and outer diameter of 4.76 mm and an annual concentric air tube with inner diameter of 25.4 mm. A tapered fuel nozzle exit was designed to reduce recirculation from the burner tip, which resulted in an exit diameter of 3.06 mm for the fuel nozzle. Sintered metal foam elements were included in the fuel and air nozzles to straighten and reduce instabilities in the flow. The pressure vessel is a large cylinder, with an internal height of 600 mm and
5
an internal diameter of 240 mm. Optical access to the vessel was possible through three viewing ports so that line-of-sight measurements were possible. Further details of the burner and pressure vessel can be found elsewhere [6].
Soot volume fraction was measured using the diffuse-light two-dimensional line-of-sight attenuation (LOSA) optical diagnostic method [21]. The light source for the experiments was a mercury arc lamp diffused by an integrating sphere and imaged to the flame center with a pair of achromatic lens doublets. The flame center was imaged with a commercial 150 mm focal length cameralens (Sigma Corporation) onto a CCD array filtered with a 450 nm narrow band filter. The magnification of the system was such that each square pixel
images a square of 33 x 33 µm2. The data was binned horizontally and vertically to reduce shot noise and the
final spatial resolution was 132 x 528 µm2. A soot refractive index light absorption function, E(m), of 0.27 [6]
was used in the data analysis.
The measurement was conducted at pressures of 1, 3, 6 and 8 atm for an ethylene/air diffusion flame. Higher pressures would result in smoking flames and thus were not conducted. The ethylene and air were supplied at room temperature. The mass flow rates of ethylene and air were kept constant at 0.48 mg/s and 0.40 g/s, respectively, for all pressures.
3. Numerical Scheme and Soot Model
The above experimentally measured flames were also modeled by numerical simulation. The low Mach number assumption was adopted. The SIMPLE numerical scheme [22] was used. The diffusion terms in the conservation equations were discretized by the central difference method and the convective terms were discretized by the power law method [22]. The discretized governing equations of gas species and soot moments were, respectively, solved in a fully coupled fashion at each control volume. Those of momentum, energy and pressure correction were solved using the tri-diagonal matrix algorithm. More details of numerical scheme can be found elsewhere [19,20].
The flames were simulated in two dimensional cylindrical coordinate system. The computational domain covers an area from 0 to 12 mm in the radial (r) direction and 0 to 28 mm in the axial (z) direction. The inflow boundary (z = 0 mm) corresponds to the region immediately above the fuel nozzle. In total, 160 (z) x 218 (r)
6
reaction zone and near the fuel nozzle exit region. The symmetric condition was used for the centerline in the simulation. The free slip boundary condition was used for the side boundary, and zero-gradient condition was employed for the top outlet. At the bottom of the domain, uniform velocities, temperatures and compositions were specified for the center fuel tube region and outer concentric space, respectively, based on supplied fuel and air. Radiation heat transfer was calculated by the discrete ordinate method coupled to a statistical
narrow-band correlated-K (SNBCK) based wide narrow-band model for the radiating properties of CO, CO2, H2O and soot
[23].
The formation and evolution of soot particles were simulated by the method of moments [24]. This method was selected because it can reasonably describe soot formation as well as requires less computational time than the more detailed sectional models [25-29]. Six concentration moments were used, with the moments being defined as
1 r r i i i M m N ∞ = =
∑
(1)where Mr is the rth moment of soot particle distribution, and mi and Ni are the mass and the particle number
density, respectively, of the soot particles of size class i. The governing equations of soot concentration moments can be found in [20]. The inception of soot particles was assumed to be due to the coalescence of two large PAH molecules, pyrene (A4). Then the particle size increases or decreases due to particle coagulation, surface growth and oxidation. The gas phase chemistry and the calculation methods for the particle inception, coagulation, surface growth and oxidation are basically those developed by Appel et al. [30]. However, some modifications were made for surface growth calculation and gas phase chemistry since the original method and chemistry significantly underpredicted soot volume fraction.
The first modification was for the gas phase chemistry. The reaction rate of the propargyl (C3H3)
combination reaction C3H3 + C3H3 => A1- (phenyl) + H was raised from 5.E+12 to 2.E+13 (cm
3
/mol-s). In addition, more routes and reactions, which have been shown to be important in PAH formation and growth by other researchers, were added to the base chemistry. Table 1 lists the details of the added reactions.
The second modification was for the calculation of coagulation. The free molecular regime was employed. However, we limited the particle coagulation by setting the coagulation rate as zero when the mean
7
particle diameter is greater than 25 nm. This was based on the experimental observation that generally the maximum diameter of a primary particle is about 25 ~ 30 nm.
Thirdly, we increased the surface growth rate by raising the parameter α, the fraction of surface sites available for surface reactions. Basically, the parameter α was still calculated by the equation proposed in [30], i.e.
1
tanh( / loga b)
α
=μ
+ (2)where
μ
1 is the first size moment of the soot particle distribution [24]. However, the parameters aand b inthe equation were modified as
3 3.0 (12.65 5.63 10 ) a= × − × − ×T (3) 3 1.38 1.02 10 b= − + × − ×T (4)
with T being local temperature.
Lastly, we reduced the scrubbing factor of pyrene αA4 from 1.0to 0.03, i.e. the reaction rate of pyrene was
calculated by
4 , 4 4 , 4
A g A A s A
r
=
r
+
α
⋅
r
(5)where rA4, rg,A4, rs,A4 and αA4 are the net rate, the rate due to gas phase reactions, the rate due to soot formation
and the scrubbing factor of pyrene, respectively. This treatment follows a similar idea of Smooke et al. [25], and is an ad hoc one. However, it should not affect the primary conclusion of this paper, since we focus on the relative variation when pressure changes and the same scrubbing factor was used for all pressures. The scrubbing factors for all other species are unity. Without the modification and addition of the mentioned
reactions for PAH formation and growth, the scrubbing factor of pyrene, αA4 in Eq. 5, would have to be
reduced from 0.03 to about 0.0005 to obtain relatively reasonable soot volume fraction in centerline region.
4. Results and Discussion
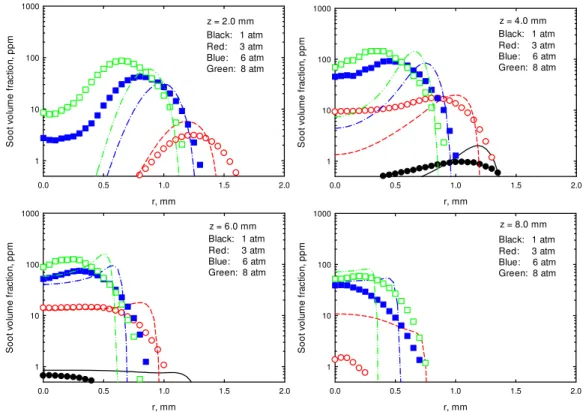
Figure 1 displays the measured and calculated radial profiles of soot volume fraction (SVF) at four axial heights (z = 2.0, 4.0, 6.0 and 8.0 mm, with z being the distance above burner exit) that cover the primary soot formation region for all four studied pressures. Note that soot volume fraction at z = 2.0 and 8.0 mm is too low to be observed in Fig. 1 for the flame at atmosphere pressure. It is revealed that the numerical simulation
8
captured the primary features obtained by experiment, although the calculated radial position of the maximum soot volume fraction at each axial height is slightly farther from centerline than the measured. For all pressures, with an increase in axial height, soot volume fraction first increases and then decreases. The maximum soot volume fractions appear in an annular wing region for all studied flames. Both experiment and simulation show that at each axial height, with an increase in pressure, soot volume fraction quickly increases. In addition, radial position of the maximum soot volume fraction moves toward the centerline, suggesting that a pressure increase intensifies soot formation rate and reduces the flame diameter. These are qualitatively consistent with the results from previous experimental and numerical studies [5,15,16] for other high pressure flames.
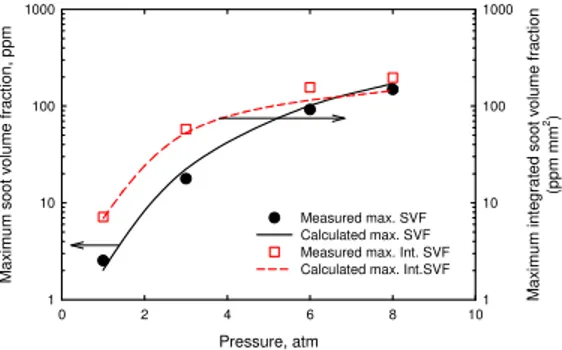
Figure 2 shows the variations of the maximum local soot volume fraction and the maximum annularly
integrated soot volume fraction (obtained by 2π
∫
f rdrv , with fv being local soot volume fraction). Themeasured maximum local soot volume fraction scales with pn with n being 1.98 which is slightly higher than
the measured value of 1.70 in [5]. Given the difference between this study and [5] in burner configuration and measurement method, the disparity in the measured value of n should be acceptable. The measured maximum
annularly integrated soot volume fraction is also proportional to pn with n being 1.62, which cannot be directly
compared with that in [5] since it was not provided by McCrain and Roberts.
The simulation successfully captured the measured magnitudes and trends of both the maximum local soot volume fraction and the maximum annularly integrated soot volume fraction. Both experiment and simulation show that with an increase in pressure, the rates of increase of the two quantities differ, with that of the maximum local soot volume fraction being higher. This is also qualitatively similar to the observation in [5] that the rate of increase of the maximum local soot volume fraction was higher than that of the line-of-sight integrated soot volume fraction at 65% of the flame height. The higher rate of increase of the maximum local soot volume fraction than that of the maximum integrated soot volume fraction can be attributed to the
reduction in flame diameter when pressure increases, as mentioned above and shown in Fig. 1.
The comparison in Figs. 1 and 2 shows that the numerical simulation captured the primary feature of the pressure effect on soot formation in the laminar ethylene/air diffusion flame. Therefore, the details of simulation results can be used to analyze the mechanisms of the pressure effect on soot formation.
9
The effect of pressure on soot formation due to the variations in mixture density and air entrainment into the fuel stream has been discussed in the previous numerical studies [14-18]. This paper will not repeat the similar discussion. Alternately, this paper will focus on the mechanisms of soot formation at different pressures.
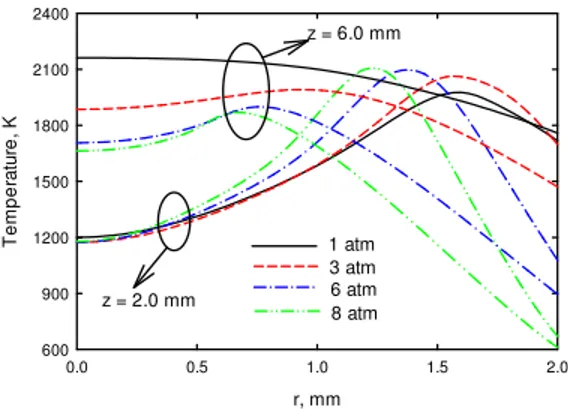
Figure 3 displays the calculated temperature profiles at two axial heights. It is observed that except for at z = 2.0 mm when pressure increases from 1 to 3 atm, an increase in pressure does not cause an increase or even cause a decrease in temperature. This is because the significant increase in soot volume fraction leads to an increase in radiation heat loss at higher pressures. At z = 2.0 mm and atmosphere pressure, soot volume fraction is negligible (Fig. 1) and thus temperature increases with increasing pressure from 1 to 3 atm. However, with further increasing pressure, soot volume fraction at z = 2.0 mm starts to increase and then temperature does not significantly change. Therefore, temperature should not be a primary factor that results in the significant increase in soot formation at high pressures.
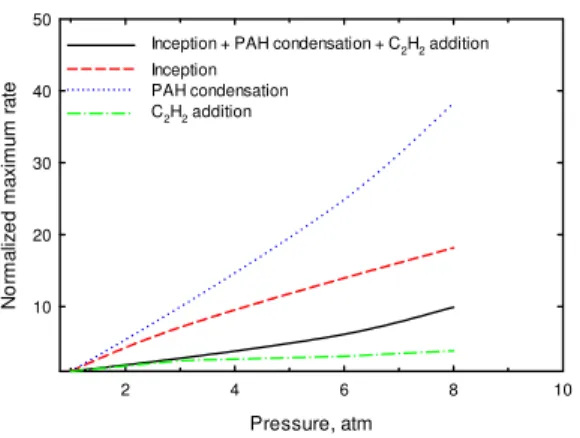
Soot formation primarily consists of inception and surface growth. Surface growth includes PAH condensation and acetylene addition. Figure 4 shows the variations of the normalized local maximum total
soot formation rate (inception + PAH condensation + C2H2 addition) and the normalized local maximum rates
of the three sub-processes, inception, PAH condensation and acetylene addition. Each of the normalized local maximum quantities is obtained by dividing the local maximum rate at an elevated pressure by the corresponding local maximum rate at atmosphere pressure. It is noted that with an increase in pressure, all of these local maximum rates increase. However, the rates of increase differ, with that of the local maximum PAH condensation rate being the fastest and that of the local maximum acetylene addition rate being the slowest. This difference among the rates of increase of the three sub-processes suggests that an increase in pressure may result in a change in the relative contributions of the three soot formation sub-processes in an ethylene/air diffusion flame.
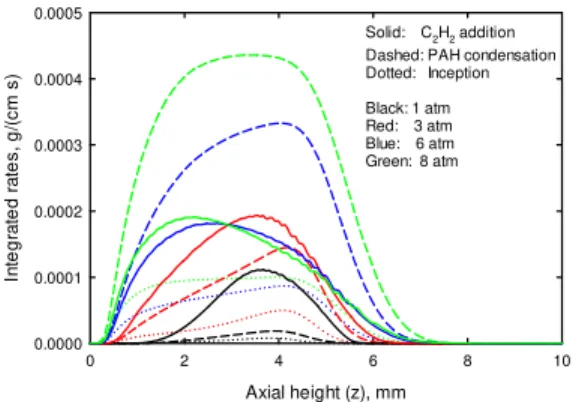
Figure 5 displays the distributions of the calculated integrated soot inception, PAH condensation and acetylene addition rates along axial height for all pressures. Each of these integrated rates was obtained by annular integration of the rate term. The integrated rate can more exactly reflect the contribution of each sub-process than the corresponding local maximum rate. It is revealed that at atmosphere pressure, acetylene addition dominates soot formation. However, with an increase in pressure, PAH condensation rate quickly
10
increases and finally exceeds acetylene addition rate at pressures of 6 and 8 atm. Inception rate is lower than PAH condensation and acetylene addition rates at all pressures, but its relative contribution increases at higher pressures. These observed trends further confirm that an increase in pressure causes not only an increase in total soot formation rate but also a variation in the mechanisms of soot formation. This phenomenon in laminar diffusion flames has never been reported before, since previous numerical studies for soot formation in laminar diffusion flames [14-18] at higher pressures did not include PAH chemistry. However, it qualitatively supports the observation obtained in laminar premixed flames [12], i.e. acetylene might not play a significant role any more for soot growth process at high pressures.
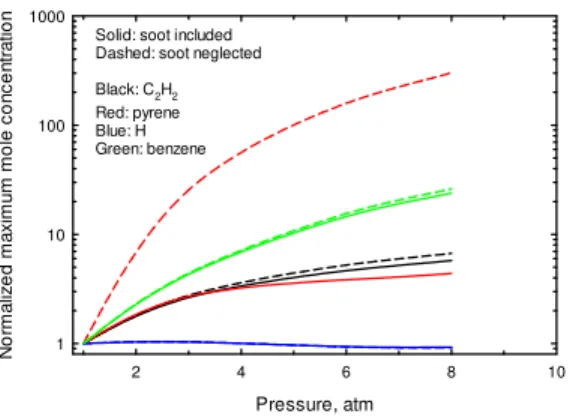
The difference in the rates of increase of the three soot formation sub-processes and the variation in the relative contributions mentioned above result from the different changing rates of the concentrations and formation of some species as pressure increases. Figure 6 shows the variations in the normalized local
maximum mole concentrations (mole/cm3) of four key species, acetylene, benzene, pyrene and atomic
hydrogen (H), as a function of pressure. Two sets of calculated data are shown in Fig. 6, with one set (solid lines) being obtained from the normal simulation that includes soot formation and provides all data in Figs. 1-5 and the other set (dashed lines) being obtained from an artificial simulation that neglects soot formation. Similarly, the normalized concentration was obtained by dividing the local maximum mole concentration at an elevated pressure by the corresponding value at atmosphere pressure. It reveals that as pressure increases, the maximum mole concentration of benzene has the fastest increase rate, followed by that of acetylene and pyrene, respectively, in the normal simulation. The maximum mole concentration of radical H slightly decreases with increasing pressure. The slower rate of increase of pyrene mole concentration than that of benzene mole concentration in the normal simulation is inconsistent with the observation by Böhm et al. [12] for premixed flames. This is due to the neglect of the consumption of pyrene by soot formation in [12]. The data from the artificial simulation neglecting soot formation (dashed lines) confirms that pyrene mole concentration would have had the fastest rate of increase as pressure increases if soot formation would not consume pyrene, suggesting that the rate of increase of pyrene formation rises fastest with increasing pressure.
The variations in the mole concentrations and formation rates of these species can explain the observation in Figs. 4 and 5. In the soot model employed, particle inception is assumed to be due to the coalescence of two pyrene molecules. As a result, an increase in the formation rate of pyrene results in an increase in the
11
inception rate, when pressure increases. PAH condensation is assumed to be due to the collision between pyrene molecules and particle surface, and thus the PAH condensation rate depends on both the formation of pyrene and particle surface area that is closely related to particle number density and inception rate. Therefore, the dependence of PAH condensation rate on pressure is stronger than that of inception rate. Acetylene addition rate is calculated by the model of hydrogen-abstraction-carbon-addition (HACA) [30] in which the rate of acetylene addition depends on temperature and concentrations of acetylene and radical H. The slower rate of increase of acetylene formation and the slightly decreased mole concentration and formation rate of radical H cause the rate of acetylene addition to increase more slowly than those of inception and PAH condensation, as pressure increases.
Since PAHs play a significant role in soot formation at higher pressures, it is of also interest to examine the effect of pressure on formation of PAHs. Although not shown due to space limit, the numerical result suggests that an increase in pressure also results in a variation in the mechanism of the formation of the first aromatic ring, benzene. At atmosphere pressure, the formation of benzene is primarily due to the
inter-conversion of phenyl (A1-) to benzene (A1) and the reaction C2H3 + C4H4 = A1 + H. The formation of phenyl
is dominated by the propargyl combination reaction C3H3 + C3H3 => A1- + H. However, the contribution of
the reaction C2H3 + C4H4 = A1 + H that was suggested by Lindstedt and Skevis [32] dominates the formation
of benzene at high pressures. The simulation also suggests that the formation of larger PAH still follows the mechanism of hydrogen-abstraction-carbon-addition at high pressures. Therefore, an increase in pressure also causes a variation in the formation mechanism of the first aromatic ring, benzene, but does not significantly affect the mechanism of the further growth from benzene or phenyl to larger size PAH.
5. Conclusions
Soot formation in a laminar ethylene/air diffusion flame at pressures from 1 to 8 atm has been investigated by experiment and numerical simulation using complex chemistry and a relatively detailed soot model. The numerical simulation successfully captured the variation trend of pressure effect on soot formation. (1) Both experiment and simulation show that soot volume fraction increases and the radial position of the maximum soot volume fraction moves toward the centerline, as pressure increases. The peak soot volume fraction and the peak integrated soot volume fractions have different rates of increase with increasing pressure
12
because of the reduction in flame diameter. (2) Further analysis of the details of numerical results suggests that an increase in pressure causes the increase in the rates of all soot formation sub-processes, but the rates of increase of different sub-processes differ, with that of PAH condensation being the fastest. As pressure increases, the mole concentrations and formation rates of large size PAHs quickly increase, which results in a quick increase in PAH condensation rate. The rate of increase of acetylene formation is relatively slower and the formation rate of radical H slightly decreases, which leads to a slower increasing rate of acetylene addition than that of PAH condensation, when pressure increases. As a result, at atmosphere pressure, soot formation is dominated by acetylene addition, followed by PAH condensation and inception. However, the contribution of PAH condensation quickly increases with increasing pressure and may finally exceed the contribution of acetylene addition at high pressures. (3) Finally, an increase in pressure also results in a variation in the mechanism of the formation of the first aromatic ring, benzene. At atmosphere pressure, the formation of
benzene is primarily due to both the reaction C2H3 + C4H4 = A1 + H and the inter-conversion of phenyl to
benzene, while the formation of benzene is dominated by the reaction C2H3 + C4H4 = A1 + H at high
pressures. However, an increase in pressure does not significantly affect the mechanism of the further growth from benzene or phenyl to larger size PAHs.
Acknowledgement
Funding for this work was provided by Natural Resources Canada through the Program of Energy Research and Development, AFTER Project C23.006. ZG acknowledges the financial support of the Jiangsu Government Scholarship for Overseas Studies (JS-2006-024) and the National Natural Science Foundation of China (No.50778090).
References
[1]. J. Ferin, G. Oberdörster, D.P. Penney, S.C. Soderholm, R. Gelein, H.C. Piper, J. Aerosol Sci. 21
(1990) 381-384.
[2]. G. Oberdörster, J. Ferin, G. Finkelstein, P. Wade, N. Corson, J. Aerosol Sci. 21 (1990) 384-387.
13
[4]. W. Flower, C.T. Bowman, Proc. Combust. Inst. 21 (1986) 1115-1124.
[5]. L.L. McCrain, W.L. Roberts, Combust. Flame 140 (2005) 60-69.
[6]. K. Thomson, Ö.L. Gülder, E.J. Weckman, R.A. Fraser, G.J. Smallwood, D.R. Snelling, Combust.
Flame 140 (2005): 222-232.
[7]. H.I. Joo, Ö.L. Gülder, Proc. Combust. Inst. 32 (2009) 769-775.
[8]. D.S. Bento, K.A. Thomson, Ö.L. Gülder, Combust. Flame 145 (2006) 765-778.
[9]. P.M. Mandatori, Ö.L. Gülder, Proc. Combust. Inst. 33 (2010) 577-584.
[10]. H. Mätzing, H. GG. Wagner, Proc. Combust. Inst. 21 (1986) 1047-1055.
[11]. H. Böhm, D. Hesse, H. Jander, B. Lüers, J. Pietscher, H. GG. Wagner, M. Weiss, Proc. Combust. Inst.
22 (1988) 403-411.
[12]. H. Böhm, CHR. Feldermann, Th. Heidermann, H. Jander, B. Lüers, H. GG. Wagner, Proc. Combust.
Inst. 24 (1992) 991-998.
[13]. Th. Heidermann, H. Jander, H. GG. Wagner, Phys. Chem. Chem. Phys. 1 (1999) 3497-3502.
[14]. Z. Zhang, O.A. Ezekoye, Combust. Sci. Tech. 137 (1998) 323-346.
[15]. F. Liu, K.A. Thomson, H. Guo, G.J. Smallwood, Combust. Flame 164 (2006) 456-471.
[16]. M.R.J. Charest, H.I. Joo, Ö.L. Gülder, C.P.T. Growth, Proc. Combust. Inst. 33 (2011) 549-557.
[17]. M.R.J. Charest, C.P.T. Groth, Ö.L. Gülder, Combust. Flame 158 (2011) 860-875.
[18]. M.R.J. Charest, C.P.T. Groth, Ö.L. Gülder, Combust. Flame 158 (2011) 1933-1945.
[19]. H. Guo, F. Liu, G.J. Smallwood, Ö.L. Gülder, Combust. Flame 145 (2006) 324-338.
[20]. H. Guo, K.A. Thomson, G.J. Smallwood, Combust. Flame 156 (2009): 1135-1142.
[21]. K.A. Thomson, M.J. Johnson, D.R. Snelling, G.J. Smallwood, Applied Optics 47 (2008) 694-703.
[22]. S.V. Patankar, Numerical heat transfer and fluid flow, Hemisphere, New York, 1980.
14
[24]. M. Frenklach, H. Wang, in: H. Bockhorn (Eds.), Soot Formation in Combustion: Mechanisms and
Models, Springer-Verlag, 59, 1994, pp. 162-196.
[25]. M.D. Smooke, M.B. Long, B.C. Connelly, M.B. Colket, and R.J. Hall, Combust. Flame 143 (2005)
613-628.
[26]. Q.A. Zhang, M.J. Thomson, H. Guo, F. Liu, G.J. Smallwood, Combust. Flame 156 (2009) 697-705.
[27]. Q.A. Zhang, H. Guo, F. Liu, G.J. Smallwood, M.J. Thomson, Proc. Combust. Inst. 32 (2009) 761–
768.
[28]. Q.A. Zhang, H. Guo, F. Liu, G.J. Smallwood, M.J. Thomson, Combust. Theory Modelling 12 (2008)
621-641.
[29]. A. D’Anna, J.H. Kent, Combust. Flame 144 (2006) 249-260.
[30]. J. Appel, H. Bockhorn, M. Frenklach, Combust. Flame 121 (2000) 122-136.
[31]. A. D’Anna, A. D’Alessio, Combust. Flame 125 (2001) 1196-1206.
[32]. P. Lindstedt, G. Skevis, Proc. Combust. Inst. 26 (1996) 703-709.
[33]. N.M. Marinov, W.J. Pitz, C.K. Westbrook, M.J. Castaldi, S.M. Senhan, Combust. Sci. and Tech.
116-117 (1996) 211-287.
15
Table 1 List of reactions added to the base gas-phase chemistry. The reaction rate is calculated as ATn
exp(-E/RT). A n E(cal/mol) Ref. C3H3 +C3H2 => A1- 3.00E+12 0.0 0.0 [31] i-C4H5 + H = CH3CCCH2 + H 1.00E+14 0.0 0.0 [29] CH3CCCH2 + C3H3 = C6H5CH2 + H 3.00E+12 0.0 0.0 [29] C6H5CH2 + H = C6H5CH3 1.80E+14 0.0 0.0 [29] C6H5CH3 + H = A1 + CH3 1.20E+13 0.0 5148.0 [29] C2H3 + C4H4 = A1 + H 1.90E+12 0.0 2510.0 [32] C6H5CH2 + C3H3 = A2 + H + H 1.00E+13 0.0 0.0 [29] C5H5 + C5H5 = A2 + H + H 1.0E+13 0.0 0.0 [29]
Indenyl + H = Indene 2.00E+14 0.0 0.0 [33]
C6H5CH2 + C2H2 = Indene + H 3.20E+11 0.0 7000.0 [33]
Indene + H = Indenyl + H2 2.19E+08 1.77 3000.0 [33]
Indenyl + C5H5 = A3 + 2H 1.00E+13 0.0 4000.0 [33]
A2-1 + A1 => A4 + H + H2 1.00E+12 0.0 5000.0 [34]
A2-2 + A1 => A4 + H + H2 1.00E+12 0.0 5000.0 [34]
16 z = 2.0 mm r, mm 0.0 0.5 1.0 1.5 2.0 Soot v o lu m e f ra c ti on , ppm 1 10 100 1000 Black: 1 atm Red: 3 atm Blue: 6 atm Green: 8 atm z = 4.0 mm r, mm 0.0 0.5 1.0 1.5 2.0 So ot v o lu m e f ra c ti on , pp m 1 10 100 1000 Black: 1 atm Red: 3 atm Blue: 6 atm Green: 8 atm z = 6.0 mm r, mm 0.0 0.5 1.0 1.5 2.0 S o o t v o lu m e fr a c ti on , ppm 1 10 100 1000 Black: 1 atm Red: 3 atm Blue: 6 atm Green: 8 atm z = 8.0 mm r, mm 0.0 0.5 1.0 1.5 2.0 S o o t vo lu m e f ra c tio n , p p m 1 10 100 1000 Black: 1 atm Red: 3 atm Blue: 6 atm Green: 8 atm
17 Pressure, atm 0 2 4 6 8 10 M a x imum s oot v o lum e f rac tio n , ppm 1 10 100 1000 M a x imum i n te grat ed soo t v o lu me fra c ti on (ppm mm 2) 1 10 100 1000 Measured max. SVF Calculated max. SVF Measured max. Int. SVF Calculated max. Int.SVF
Fig. 2 Measured and calculated maximum soot volume fraction (SVF) and maximum integrated soot volume fraction (Int. SVF).
18 z = 2.0 mm r, mm 0.0 0.5 1.0 1.5 2.0 Temper a tu re , K 600 900 1200 1500 1800 2100 2400 1 atm 6 atm 3 atm 8 atm z = 6.0 mm
19 Pressure, atm 2 4 6 8 10 N o rm a liz e d ma x imu m r a te 10 20 30 40 50
Inception + PAH condensation + C2H2 addition
Inception PAH condensation C2H2 addition
20 Axial height (z), mm 0 2 4 6 8 10 In te g rate d ra te s , g /(c m s ) 0.0000 0.0001 0.0002 0.0003 0.0004 0.0005 Solid: C2H2 addition Dashed: PAH condensation Dotted: Inception Black: 1 atm Red: 3 atm Blue: 6 atm Green: 8 atm
21 Pressure, atm 2 4 6 8 10 N o rm a liz e d m a x im u m m o le c o n c e n tr a tio n 1 10 100 1000
Solid: soot included Dashed: soot neglected Black: C2H2
Red: pyrene Blue: H Green: benzene
22
Table Captions:
Table 1 List of reactions added to the base gas-phase chemistry. The reaction rate is calculated as ATn
exp(-E/RT).
Figure Captions:
Fig. 1 Measured (symbols) and calculated (lines) soot volume fractions at different axial heights.
Fig. 2 Measured and calculated maximum soot volume fraction (SVF) and maximum integrated soot volume fraction (Int. SVF).
Fig. 3 Calculated temperatures at different axial heights.
Fig. 4 Variations of the normalized maximum soot formation rates.
Fig. 5 Integrated inception, PAH condensation and acetylene (C2H2) addition rates.
Fig. 6 Variations of the normalized maximum mole concentrations of C2H2, benzene, pyrene, propargyl and