Publisher’s version / Version de l'éditeur:
Fire Technology Journal, 47, 1, pp. 163-189, 2011-01-01
READ THESE TERMS AND CONDITIONS CAREFULLY BEFORE USING THIS WEBSITE. https://nrc-publications.canada.ca/eng/copyright
Vous avez des questions? Nous pouvons vous aider. Pour communiquer directement avec un auteur, consultez la
première page de la revue dans laquelle son article a été publié afin de trouver ses coordonnées. Si vous n’arrivez pas à les repérer, communiquez avec nous à PublicationsArchive-ArchivesPublications@nrc-cnrc.gc.ca.
Questions? Contact the NRC Publications Archive team at
PublicationsArchive-ArchivesPublications@nrc-cnrc.gc.ca. If you wish to email the authors directly, please see the first page of the publication for their contact information.
NRC Publications Archive
Archives des publications du CNRC
This publication could be one of several versions: author’s original, accepted manuscript or the publisher’s version. / La version de cette publication peut être l’une des suivantes : la version prépublication de l’auteur, la version acceptée du manuscrit ou la version de l’éditeur.
For the publisher’s version, please access the DOI link below./ Pour consulter la version de l’éditeur, utilisez le lien DOI ci-dessous.
https://doi.org/10.1007/s10694-010-0142-4
Access and use of this website and the material on it are subject to the Terms and Conditions set forth at Investigation on the performance of fire detection systems for tunnel applications - Part 1: full-scale experiments at a laboratory tunnel
Liu, Z. G.; Kashef, A.; Lougheed, G. D.; Crampton, G. P.
https://publications-cnrc.canada.ca/fra/droits
L’accès à ce site Web et l’utilisation de son contenu sont assujettis aux conditions présentées dans le site LISEZ CES CONDITIONS ATTENTIVEMENT AVANT D’UTILISER CE SITE WEB.
NRC Publications Record / Notice d'Archives des publications de CNRC:
https://nrc-publications.canada.ca/eng/view/object/?id=9296bcbb-650b-46e0-a55f-fd50d051af9b https://publications-cnrc.canada.ca/fra/voir/objet/?id=9296bcbb-650b-46e0-a55f-fd50d051af9b
http://www.nrc-cnrc.gc.ca/irc
I nve st iga t ion on t he pe rform a nc e of fire de t e c t ion syst e m s for t unne l a pplic a t ions - Pa rt 1 : full-sc a le e x pe rim e nt s a t a la bora t ory t unne l
N R C C - 5 3 9 6 5
L i u , Z . G . ; K a s h e f , A . ; L o u g h e e d , G . D . ; C r a m p t o n , G . P .
J a n u a r y 2 0 1 1
A version of this document is published in / Une version de ce document se trouve dans: Fire Technology Journal, 47, (1), pp. 163-189, January 01, 2011, DOI:
10.1007/s10694-010-0142-4
The material in this document is covered by the provisions of the Copyright Act, by Canadian laws, policies, regulations and international agreements. Such provisions serve to identify the information source and, in specific instances, to prohibit reproduction of materials without written permission. For more information visit http://laws.justice.gc.ca/en/showtdm/cs/C-42
Les renseignements dans ce document sont protégés par la Loi sur le droit d'auteur, par les lois, les politiques et les règlements du Canada et des accords internationaux. Ces dispositions permettent d'identifier la source de l'information et, dans certains cas, d'interdire la copie de documents sans permission écrite. Pour obtenir de plus amples renseignements : http://lois.justice.gc.ca/fr/showtdm/cs/C-42
1
Now with CAFS UNIT Inc., Ottawa, ON
*Correspondence should be addressed to: Gary Lougheed, E-mail: gary.lougheed@nrc.ca
INVESTIGATION ON THE PERFORMANCE OF FIRE DETECTION SYSTEMS FOR TUNNEL APPLICATIONS – PART 1: FULL-SCALE EXPERIMENTS AT A
LABORATORY TUNNEL
Z. G. Liu1, A. Kashef, G. Lougheed*, and G. Crampton Fire Research Program, Institute for Research in Construction National Research Council of Canada, Ottawa, Canada, K1A 0R6,
ABSTRACT
A two-year international road tunnel fire detection research project (Phase II) was completed recently. As part of this project, a series of fire tests were conducted in a laboratory tunnel facility under minimum and longitudinal airflow conditions. In addition, fire tests were also conducted in the Carré-Viger tunnel in Montreal.
This paper presents the results of the full-scale experiments conducted in the laboratory tunnel under minimum airflow conditions. The performance of nine fire detection systems representing five types of fire detection technologies was investigated using representative tunnel fire scenarios. Test results showed that the response of fire detection systems to a tunnel fire was dependent on the size, location and growth rate of the fire, the type of fuel as well as the method of detection.
Key words: road tunnel, fire detection, pool fire, stationary vehicle fire and moving fire
1. INTRODUCTION
Road tunnels are critical components of the transportation systems. Ensuring fire safety in road tunnels is more challenging than ever due to an increase in traffic, and length and complexity of the tunnels, the specific features of the tunnel infrastructure, as well as inadequate safety rules on vehicles [1]. Catastrophic tunnel fires have resulted in loss of life and severe property damage.
Fire detection systems play a crucial role in ensuring fire safety in road tunnels. Reliable and early fire detection can provide the tunnel operator with an early warning of a fire incident and its location, allowing for timely activation of emergency systems and firefighting. Detection can make the difference between a manageable fire and one that gets out-of-control [2-4].
Information on the performance of current fire detection technologies in a tunnel environment and guidelines for the use of the detection systems in road tunnels are limited [2-5]. Relatively few test programs that have been carried out in Europe and Japan have been focused on the performance of linear heat detection systems and optical flame detectors [6-17]. Many other types of the fire detection technologies for tunnel application, such as spot heat detectors and smoke detection systems, have not been studied systematically. Moreover, interest in the use of video image detection systems has increased, but limited information on their performance has been reported [17].
There are no generally acceptable test protocols and performance criteria for use in the evaluation of fire detection systems for tunnel application. The test conditions and fire scenarios were changed from one test program to another [5, 6, 8, 10, 11, 13]. The performances of fire detection systems in these programs were evaluated mostly with pool fires of up to 3 MW. Other types of tunnel fire scenarios, such as slowly growing stationary vehicle fires and moving vehicle fires, were not considered.
Another concern regarding the fire detection systems for tunnel applications is that their reliabilities, including the nuisance alarms and maintenance requirements in smoky, dirty and humid tunnel environments, have not been investigated. Fire detection systems that work in building environments may not work well in harsh tunnel environments.
A two-year international research project, with support of government organizations, industry and private sector organizations, was conducted to investigate currently available fire detection technologies for tunnel applications [18]. The studies included development of appropriate tunnel fire scenarios; full-scale fire tests in a laboratory tunnel facility under minimum airflow (approximately 0 m/s) and longitudinal airflow conditions; full-scale fire tests in the Carré-Viger tunnel in Montreal, Canada; environmental and fire tests in the Lincoln Tunnel in New York City; as well as a computer modeling study.
This paper presents the results of the full-scale experiments conducted in the laboratory tunnel under minimum airflow conditions. The research results of other parts of the project are presented in separate papers. The performances of eight fire detection systems, including their response times to various fire scenarios and ability to locate and monitor a fire in the tunnel under minimum airflow conditions, are discussed. Fire characteristics, such as their growth rate, heat flux, temperature and smoke spread in the tunnel, are also reported. In addition, the fire scenarios that were used for evaluation of fire detection systems for tunnel applications are described.
2. TEST TUNNEL
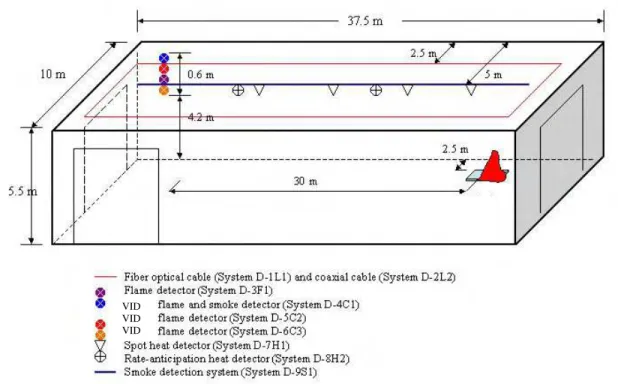
The laboratory tunnel facility is 37.5 m long, 10 m wide and 5.5 m high. The tunnel has two end doors, one large side door at the West end of the tunnel, two side louvers at the East end of the tunnel and five ceiling openings to the duct and fan system located above the tunnel. A schematic of the test tunnel is shown in Figure 1.
Figure 1. Schematic of the laboratory tunnel.
E
The two end doors of the tunnel were closed during the tests. The two side louvers at the East end of the tunnel, however, were partially opened to provide an air supply for the fire. The opening of two side louvers was 1.5 m wide by 4.9 m high for the North louver, and 2.75 m wide by 4.9 m high for the South louver. The large side door that was located far from the fire source was also partially opened with an opening of 0.6 m wide for observing and entering the tunnel during the tests.
Smoke produced in the tests was collected and exhausted through a duct and fan system mounted on the tunnel facility. For the present work, however, the mechanical duct and ventilation system was not operated. Only natural ventilation under ambient conditions was maintained in the tunnel during the tests. The smoke produced in the tests was naturally vented through ceiling openings with a total size of 32.25 m2 located at the West end of the tunnel.
3. FIRE DETECTION SYSTEMS AND SETUPS
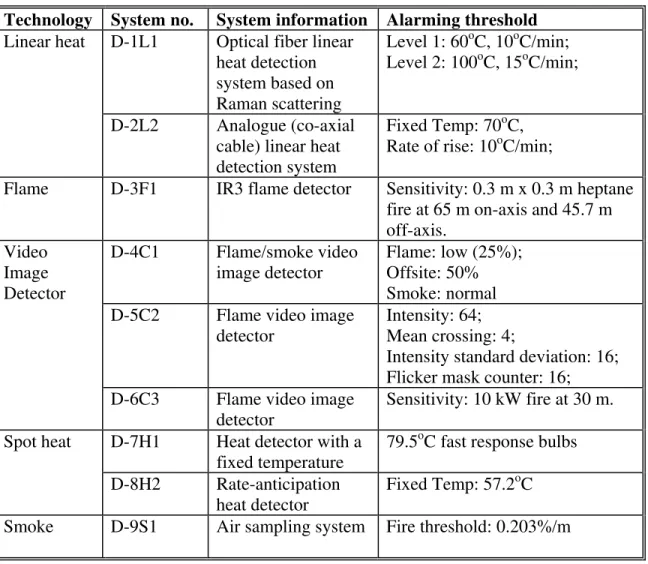
Eight fire detection systems that were representative of currently available fire detection technologies for use in tunnels were evaluated in the project. The detection systems and their sensitivities are summarized in Table 1. Detailed descriptions on these systems were reported in the reference [20].
The system suppliers installed the fire detection systems in the tunnel. The configuration and installation of the fire detection systems in the laboratory tunnel were based on the design of a system to protect an operating road tunnel. The installation configuration was not changed during the tests. The location of the detection systems in the laboratory tunnel facility is shown in Figure 2.
Table 1. Fire Detection Systems in Test Program.
Technology System no. System information Alarming threshold
Linear heat D-1L1 Optical fiber linear
heat detection system based on Raman scattering Level 1: 60oC, 10oC/min; Level 2: 100oC, 15oC/min; D-2L2 Analogue (co-axial
cable) linear heat detection system
Fixed Temp: 70oC, Rate of rise: 10oC/min;
Flame D-3F1 IR3 flame detector Sensitivity: 0.3 m x 0.3 m heptane
fire at 65 m on-axis and 45.7 m off-axis. Video Image Detector D-4C1 Flame/smoke video image detector Flame: low (25%); Offsite: 50% Smoke: normal
D-5C2 Flame video image
detector
Intensity: 64; Mean crossing: 4;
Intensity standard deviation: 16; Flicker mask counter: 16;
D-6C3 Flame video image
detector
Sensitivity: 10 kW fire at 30 m.
Spot heat D-7H1 Heat detector with a
fixed temperature
79.5oC fast response bulbs D-8H2 Rate-anticipation
heat detector
Fixed Temp: 57.2oC
Smoke D-9S1 Air sampling system Fire threshold: 0.203%/m
The sensing cables of the two linear heat detection systems were installed on the ceiling of the tunnel to form a loop. Each cable was located at approximately 80 mm from the ceiling, 2.5 m from the walls.
For System D-1L1, a 2,198 m length of the optical fiber cable was used in the test series. The cable section installed at the ceiling of the tunnel was from 2,000 m to 2,198 m, which is the maximum sensing length of the system recommended by the supplier. The remaining cable length was stored on the floor of the test facility. The optical fiber cable in the tunnel was protected with a 2 mm diameter stainless steel tube.
For System D-2L2, a 90 m length of the cable was installed in the test tunnel. This represented one detection section for the system.
The optical flame detector and three VID systems were installed on the North wall of the tunnel. The distance of the detectors above the ground ranged from 4.2 m to 4.8 m.
For System D-7H1, two 15 m long zones of 12.7 mm steel pipes were installed along the center of the test tunnel. The pipes were pressurized with air and a decreased pressure in the pipe with the activation of one of the sprinklers was used to determine the system response to the fire. Five 79.5oC fast response sprinkler heads were installed in each zone at 3 m spacing and 200 mm below the ceiling.
For System D-8H2, two 57.2oC heat detectors were installed along the center of the tunnel ceiling at 15 m spacing and 110 mm below the ceiling.
For System D-9S1, a 34 m long sampling pipe with 6 sampling holes at a 5.6 m spacing was installed along the center of the tunnel ceiling. The pipe installed in the test tunnel represents 28% of the total coverage area of one smoke detector.
VID VID VID
Figure 2. Schematic of detector/detection system setup in the test tunnel.
4. INSTRUMENTATION
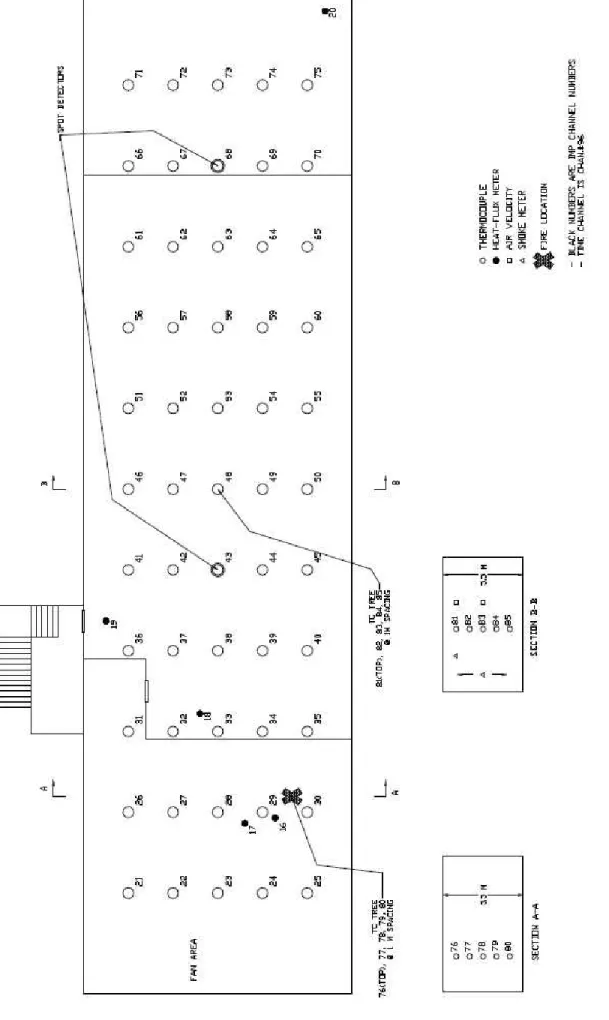
Various instruments were used to monitor the fire tests. These included thermocouples, heat flux meters, smoke meters, velocity meters and video cameras. The location of each instrument in the tunnel is shown in Figure 3.
Fifty-five thermocouples (Type K, 18 gauge) were installed at the ceiling of the tunnel facility for temperature measurements. As shown in Figure 3, the transverse and
longitudinal distances between thermocouples were 1.67 m and 3.125 m, respectively, and each thermocouple was located 150 mm below the ceiling.
Two thermocouple trees were dropped from the ceiling of the tunnel. One was located above the fire to measure the flame temperatures of the fire source and to monitor the fire development. The second thermocouple tree was located at the middle of the tunnel (18.7 m from the end of the tunnel and 5 m from the wall of the tunnel) to monitor fire conditions in the tunnel. There were five thermocouples on each thermocouple tree spaced at 1.1 m intervals starting 0.6 m above the tunnel floor.
Three smoke meters were used to measure smoke optical density in the tunnel. They were located at the middle of the tunnel approximately 12 m from the fire source. One sampling-obscuration smoke system was used to measure the smoke optical density in the hot layer. The inlet was located 150 mm below the tunnel ceiling. Two straight-line obscuration smoke meters were used to measure the smoke optical density 1.53 m and 2.5 m above the tunnel floor. The measuring methods of these two types of smoke meters are described in Reference [19].
Hand held anemometers with remote vane sensors mounted on 4 m long aluminum poles were used to measure the air velocity in the tunnel. The measurements were taken at the middle of the tunnel at 3 heights: 150 mm below the ceiling, 2.75 m above the ground and 0.7 m above the ground.
Five heat flux meters were used to measure the heat and radiant flux from the fire, and to monitor the fire development. They were located 1 m, 2 m, 5 m, 10 m and 29 m from the fire source and 1.45 m above the ground, as shown in Figure 3. The radiometer that was located 29 m from the fire source was placed near the end of the tunnel close to the fire detectors. It was used to measure the radiant energy at the detector location.
Two digital video cameras were used to provide a video record for the tests. One video camera was located near the fire source to monitor the fire. The second was located 29 m from the fire source to monitor the fire and smoke development in the tunnel.
The location of the instrumentation was not changed during the test series. The test data together with outputs of the detectors/detection systems were collected at one second intervals by a data acquisition system.
Figure 3. Sc hematic of ins tru ment a tion in the tes t tun n e l.
5. TEST PROCEDURE
The general test procedure used in the test series was as follows:
• Started the data acquisition system and video recorders for 60 s, and then manually ignited the fire;
• Terminated the test by using a compressed air foam system to extinguish the fire when:
o All the detectors activated;
o Or 4 minutes after the fire reached its maximum heat release rate;
o Or a maximum safe operating temperature of 200oC at the ceiling 3 m from the fire source was reached. This was used to ensure that the detection systems mounted in the tunnel were not damaged.
• Checked each detection system to determine if they still functioned properly after the fire test.
6. FIRE SCENARIOS
Fire scenarios were developed to evaluate the performance of the fire detection systems in the tests [20]. These fire scenarios were considered representative of the majority of tunnel fire incidents, and presented a challenge to the fire detection systems. They included:
• Small-unobstructed pool fires. This scenario was used to investigate the detection capability of the detectors to small fires in tunnel environments.
• Pool fires underneath a simulated vehicle. This scenario simulated an incident in which two vehicles collided and fuel leaked from one of the vehicles, resulting in a flammable pool fire underneath the vehicle.
• Pool fires behind a large vehicle. This scenario simulated a tunnel fire incident in which an open gasoline pool fire developed behind a large vehicle due to an accident or mechanical failure of the vehicle.
• Engine compartment fire. This scenario simulated a tunnel fire incident in which a fire developed in the engine compartment of the vehicle. The fire grew slowly due to its location and the type of fuel involved [21, 22].
• Passenger compartment fire. This scenario simulated a tunnel fire incident in which a fire involved in solid fuels developed in the passenger compartment of the vehicle. The fire also grew slowly due to its location and the type of fuel involved [21, 22].
• Moving vehicle fire. This scenario simulated a tunnel fire incident in which a vehicle with a small fire was driven through the tunnel without the awareness of the driver.
These fire scenarios included not only pool fires with a fast growth rate followed by a steady heat release rate, but also stationary vehicle fires with a slow growth rate. The fuel types included gasoline, propane, wood cribs and polyurethane foam. The fire sizes varied from 125 kW to 3,400 kW. The heat release rate produced by each fire scenario was
measured in tests using an open calorimeter [20]. Since the tunnel facility is a large open area, the fire sizes are assumed to be comparable to those measured using the open calorimeter. The peak heat releases referenced in this paper are those used for the open calorimeter.
All the detectors/detection systems were evaluated under the same fire conditions. The fire source was kept at the same location in all the tests: 6.5 m from the East end of the tunnel and 2.5 m from North wall of the tunnel. This simulated a fire in the side lane of a tunnel. At this position, the fire source was located below the cables of Systems D-1L1 and D-2L2, 30 m from the optical flame and VID detectors (Systems D-3F1 to D-6C3), approximately 3 m from the nearest sprinkler of System D-7H1, approximately 7.5 m from the nearest spot heat detector of System D-8H2 and approximately 4 m from the nearest sampling hole of System D-9S1.
7. TEST RESULTS
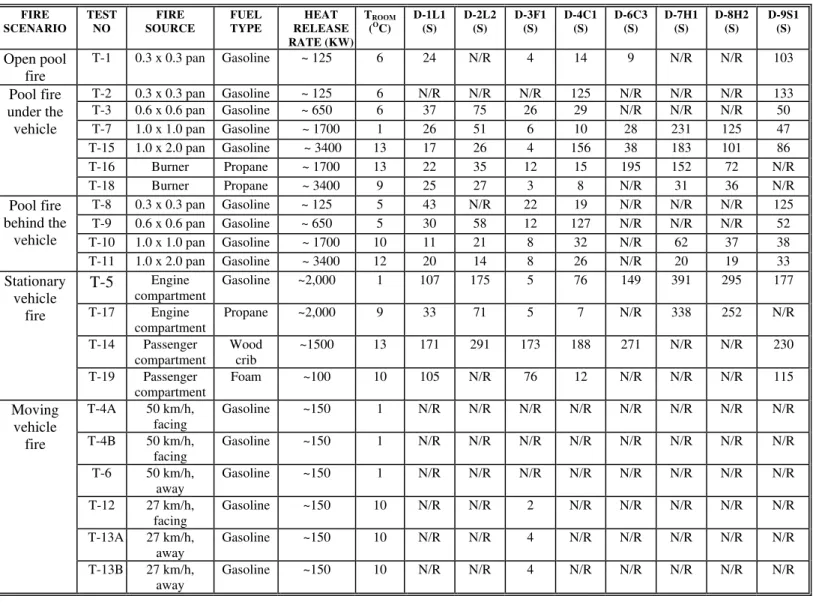
Twenty-one full-scale fire tests were conducted in the test tunnel under minimum airflow conditions (approximately 0 m/s). The fire characteristics produced by the fire scenarios, such as the fire growth rates, temperatures and smoke spread in the tunnel, were measured. The activation time of each detector/detection system was recorded. The ability of the detection systems to locate and monitor the fire incident was also evaluated. The test conditions and results are listed in Table 2. There was no test data collected from the VID flame detection system D-5C2, because of its technical problems.
7.1. Small-unobstructed Pool Fire
A 0.3 m x 0.3 m gasoline pool fire with a heat release rate ~100-125 kW was used. There was no obstacle around the fire source. The fire was allowed to burn freely for approximately 12 minutes during the test until the gasoline in the pan was burnt out. The rate of rise of the ceiling temperature above the fire source was approximately 15°C/min. The temperature measured at the ceiling above the fire source increased by approximately 22°C. A small amount of dark smokes was generated and accumulated below the ceiling. The smoke did not obstruct the view of the VID detectors during the test.
As shown in Table 2, the optical flame and VID detectors responded quickly to the open gasoline pool fire. The response times were less than 15 s. The linear optical fiber heat detection system D-1L1 also quickly detected the fire at 22 s as the rate of rise of the ceiling temperature was higher than its alarm threshold. The linear heat detection system D-2L2 did not respond to the fire although it set the same value of the rate of the rise of the temperature as the system D-1L1 for its alarm threshold. It demonstrated that the linear fiber optic heat detection system D-1L1 had a high temperature resolution, because of its light mass. The smoke detection system detected the fire at approximately 103 s, once the smoke layer formed below the ceiling. There was no response from the two spot heat detectors as the ceiling temperature was below their alarm thresholds.
FIRE SCENARIO TEST NO FIRE SOURCE FUEL TYPE HEAT RELEASE RATE (KW) TROOM (OC) D-1L1 (S) D-2L2 (S) D-3F1 (S) D-4C1 (S) D-6C3 (S) D-7H1 (S) D-8H2 (S) D-9S1 (S) Open pool fire T-1 0.3 x 0.3 pan Gasoline ~ 125 6 24 N/R 4 14 9 N/R N/R 103 Pool fire under the vehicle T-2 0.3 x 0.3 pan Gasoline ~ 125 6 N/R N/R N/R 125 N/R N/R N/R 133 T-3 0.6 x 0.6 pan Gasoline ~ 650 6 37 75 26 29 N/R N/R N/R 50 T-7 1.0 x 1.0 pan Gasoline ~ 1700 1 26 51 6 10 28 231 125 47 T-15 1.0 x 2.0 pan Gasoline ~ 3400 13 17 26 4 156 38 183 101 86 T-16 Burner Propane ~ 1700 13 22 35 12 15 195 152 72 N/R T-18 Burner Propane ~ 3400 9 25 27 3 8 N/R 31 36 N/R Pool fire behind the vehicle T-8 0.3 x 0.3 pan Gasoline ~ 125 5 43 N/R 22 19 N/R N/R N/R 125 T-9 0.6 x 0.6 pan Gasoline ~ 650 5 30 58 12 127 N/R N/R N/R 52 T-10 1.0 x 1.0 pan Gasoline ~ 1700 10 11 21 8 32 N/R 62 37 38 T-11 1.0 x 2.0 pan Gasoline ~ 3400 12 20 14 8 26 N/R 20 19 33 Stationary vehicle fire T-5 Engine compartment Gasoline ~2,000 1 107 175 5 76 149 391 295 177 T-17 Engine compartment Propane ~2,000 9 33 71 5 7 N/R 338 252 N/R T-14 Passenger compartment Wood crib ~1500 13 171 291 173 188 271 N/R N/R 230 T-19 Passenger compartment Foam ~100 10 105 N/R 76 12 N/R N/R N/R 115 Moving vehicle fire T-4A 50 km/h, facing Gasoline ~150 1 N/R N/R N/R N/R N/R N/R N/R N/R T-4B 50 km/h, facing Gasoline ~150 1 N/R N/R N/R N/R N/R N/R N/R N/R T-6 50 km/h, away Gasoline ~150 1 N/R N/R N/R N/R N/R N/R N/R N/R T-12 27 km/h, facing Gasoline ~150 10 N/R N/R 2 N/R N/R N/R N/R N/R T-13A 27 km/h, away Gasoline ~150 10 N/R N/R 4 N/R N/R N/R N/R N/R T-13B 27 km/h, away Gasoline ~150 10 N/R N/R 4 N/R N/R N/R N/R N/R
Table 2. Test Conditions and Results in Tunnel Fire Tests.
Note:
• N/R: no response
7.2. Pool Fires underneath a Simulated Vehicle
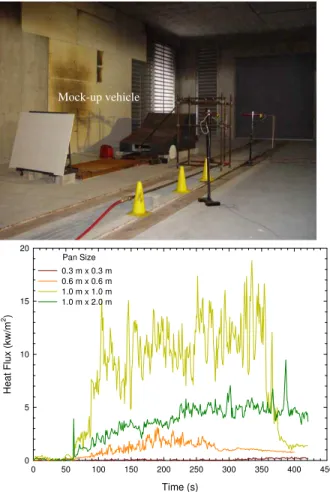
The setup of the fire scenario is shown in Figure 4. A 1.5 m wide by 1.2 m high plate was used to simulate a crashed car located between the fire source and the wall-mounted detectors. It was placed 0.3 m above the ground and 1.5 m in front of the simulated vehicle with the fire. The simulated vehicle had the same footprint (1.5 m wide by 2.4 m long) as the bottom area of a standard passenger vehicle. The gap between the vehicle bottom and the ground was 0.3 m. Four gasoline pans with sizes of 0.3 m x 0.3 m, 0.6 m x 0.6 m, 1.0 m x
1.0 m and 1 m x 2.0 m and one propane burneri were placed underneath the simulated
vehicle to produce various sizes and fuel types of the fire in the tests.
Figure 5. Heat flux measured 1 m from the fire . Figure 4. Photograph of the setup of a pool fire
located underneath a simulated vehicle.
Time (s) 0 50 100 150 200 250 300 350 400 450 Heat Flu x (kw /m 2) 0 5 10 15 20 0.3 m x 0.3 m 0.6 m x 0.6 m 1.0 m x 1.0 m 1.0 m x 2.0 m Pan Size Mock-up vehicle
As observed during tests, the combustion of the pool fire located underneath a simulated vehicle was affected by the vehicle body above the fire source. The flames and heat produced by the fire were confined by the vehicle body. The view of the flames from the front of the vehicle was also partially obstructed by the simulated vehicle that was placed between the detectors and the fires.
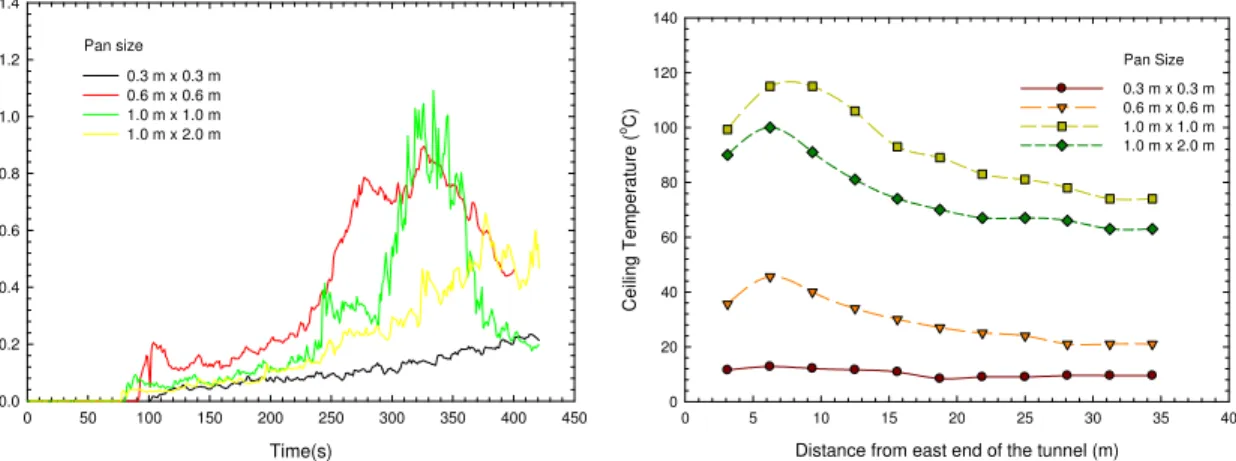
Figures 5 through 7 show the heat flux measured 1 m from the fire source, the smoke optical density measured 150 mm below the tunnel ceiling, the maximum ceiling temperatures along the center of the tunnel with four pan sizes located under the simulated vehicle. The heat flux, smoke density and ceiling temperatures increased with an increase in pan size. However, the heat flux, smoke density and maximum ceiling temperatures produced from the 1.0 m x 2.0 m pan fire were lower than those measured with the 1.0 m x 1.0 m pan. The test results suggested that the fire with the largest pan did not fully burn, because the air supply was restricted by the vehicle body positioned above the fuel pool.
Time(s)
0 50 100 150 200 250 300 350 400 450
Smoke Optical Dens
it y (OD/m ) 0.0 0.2 0.4 0.6 0.8 1.0 1.2 1.4 0.3 m x 0.3 m 0.6 m x 0.6 m 1.0 m x 1.0 m 1.0 m x 2.0 m Pan size
Distance from east end of the tunnel (m)
0 5 10 15 20 25 30 35 40 Ce ilin g Te mp er at u re ( oC) 0 20 40 60 80 100 120 140 0.3 m x 0.3 m 0.6 m x 0.6 m 1.0 m x 1.0 m 1.0 m x 2.0 m Pan Size
Figure 6. Smoke optical densities measured
150 mm below the ceiling. Figure 7. Maximum ceiling temperatures along center of the tunnel.
The response times of the detection systems to the gasoline pool fires located underneath the vehicle are summarized in Table 2 and Figure 8. The pool fire located underneath the vehicle was a challenging fire for the detection systems. For the small fire (125 kW), only the flame/smoke VID detector 4C1) and the smoke detection system (D-9S1) detected the fire at 125 s and 133 s after ignition, respectively, based on the smoke characteristics produced by the fire. With an increase in fire size, more detection systems responded to the fire, and the detection times also reduced. However, the response of two VID detectors and the smoke detection system to a 2 m2 gasoline pool fire was slower than their responses to a 1 m2 fire, as the flame size and smoke produced by the fire were reduced. The flame VID detector D-6C3, and both spot heat detectors D-7H1 and D-8H2 only responded to the two largest fires.
The VID detector D-4C1 was able to provide images on fire conditions in the tunnel during the entire test with the 0.3 m x 0.3 m gasoline pool fire. The camera view was, however, obstructed with larger fires, as the smoke accumulated in the tunnel increased. The time at which the view of the camera was completely obstructed was approximately 210 s for the 0.6 m x 0.6 m gasoline pool fire, 225 s for the 1.0 m x 1.0 m gasoline pool fire, and 280 s for the 1.0 m x 2.0 m gasoline pool fire.
Pan Size (m2) 0.0 0.5 1.0 1.5 2.0 2.5 Re spo n s e Time ( s) 0 50 100 150 200 250 Linear system D-1L1 Linear system D-2L2 Flame detector D-3F1 VID detector D-4C1 VID detector D-6C3 Spot detector D-7H1 Spot detector D-8H2 Smoke system D-9S1 Detection systems
Figure 8. Detection times of fire detection systems to gasoline pool fires underneath a vehicle.
The flames generated by the propane burner located underneath the vehicle were similar to the fire produced by the gasoline pool fire. However, no visible smoke was produced by the propane fires and the smoke detection system D-9S1 did not respond to the fires. The VID flame detector D-6C3 also had difficulty in detecting the propane fires. It detected the 1,700 kW fire at 195 s and could not detect the large fire with 3,400 kW. All other detection systems were able to detect the propane fires with response times ranging from 3 s to 152 s, depending on the detection type and the fire size. The response time decreased with an increase in propane fire size.
7.3. Pool Fires behind a Large Simulated Vehicle
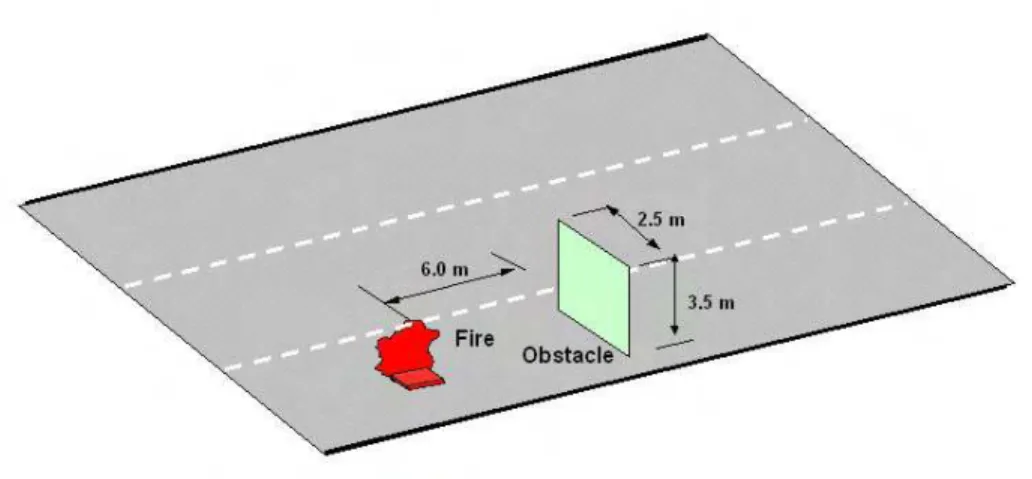
The fire scenario was constructed by placing an open pan fire behind a 2.5 m wide by 3.5 m high plate (Figure 9). It was placed 0.3 m above the ground, and 6 m in front of the pool fire, simulating the front portion of a crashed truck located between the pool fire and the detectors mounted on the tunnel wall. The distance between the edge of the plate and the wall of the tunnel was 1.2 m. Four gasoline pans with sizes of 0.3 m x 0.3 m, 0.6 m x 0.6 m, 1.0 m x 1.0 m and 1 m x 2.0 m were placed behind the simulated truck to produce various sizes of the fire in the tests.
Figure 9. Schematic of the setup of a pool fire located behind a large simulated vehicle.
Unlike a fire located underneath the vehicle, the pool fire located behind a large vehicle was a freely burning fire. The large vehicle body in front of the fire did not affect the burning process of the fire and temperature development and smoke spread in the tunnel. However, the view of the flames was obstructed by the vehicle. When the fire was small, the flame could only be observed in the gap between the bottom of the vehicle and the ground (Figure 10). With an increase in fire size, the flame became bigger and higher, and the tip of the flame became visible above the vehicle. However, a smoke layer quickly formed beneath the ceiling and obstructed the flames, as shown in Figure 11 with a 1.0 m x 2.0 m fire at 25 s after ignition.
Figure 10. Front view of a 0.3 m x0.3 m gasoline pool fire located behind a large simulated vehicle .
Figure 11. Front view of a 1.0 m x 2.0 m gasoline pool fire behind a large vehicle at 25 s after ignition.
Figure 12 shows the heat flux measured 1 m from the fire source produced with the four different fire sizes. The growth rate and peak heat releases were different from those
observed in pool fires located underneath the vehicle. The large fires produced higher heat fluxes and had a faster growth rate.
Figure 13 is the smoke optical density measured 150 mm below the tunnel ceiling with four fire sizes. With an increase in fire size, the smoke density substantially increased, and the smoke spread in the tunnel was also faster. As indicated in Figure 13, it took approximately 40 s after ignition for the smoke produced by the 125 kW fire to reach the center of the tunnel, but only approximately 15 s for the smoke produced by the 1.0 m x 2.0 m gasoline pan fire to reach the same location.
Time (s) 0 50 100 150 200 250 300 350 400 450 Heat Flux (k w/m 2) 0 10 20 30 40 0.3 m x 0.3 m 0.6 m x 0.6 m 1.0 m x 1.0 m 1.0 x 2.0 m Pan Size Time(s) 0 20 40 60 80 100 120 140 160 180 200
Smoke Optical Dens
it y (OD/m ) 0.0 0.5 1.0 1.5 2.0 2.5 0.3 m x 0.3 m 0.6 m x 0.6 m 1.0 m x 1.0 m 1.0 m x 2.0 m Pan Size Ignition
Figure 12. Heat flux measured for four pool fires located behind the large simulated vehicle .
Figure 13. Smoke optical density measured for four pool fires located behind the large simulated vehicle.
Figure 14 shows the maximum ceiling temperatures along the center of the tunnel for pool fires located behind a vehicle. The ceiling temperatures increased with fire size. The maximum ceiling temperature near the fire location produced by the 1.0 m x 2.0 m pan fire was 419oC. It was almost two times higher than that produced by the 1.0 m2 pan fire. The ceiling temperatures along the center of the tunnel decreased with an increase in distance from the fire.
The response times of the fire detection systems to gasoline pool fires located behind a simulated large vehicle are summarized in Table 2 and Figure 15. In comparison to the fires located underneath a vehicle, more detection systems were able to detect small fires located behind a vehicle, since the large vehicle body in front of the fire did not affect the burning process of the fire as well as temperature development and smoke spread in the tunnel. With an increase in fire size, the response times of the detection systems decreased. The difference in the response time between the detection systems also decreased for the large fires. The response time of all the fire detection systems to a 2 m2 gasoline pool fire was less than 35 s. However, the pool fire located behind a large vehicle was a challenging fire for those detectors that detected fires based on the characteristics of the flames. The flame VID detector D-6C3 did not respond to the fires behind the vehicle, since its view of the flames was obstructed.
Distance from east end of the tunnel (m) 0 5 10 15 20 25 30 35 40 C e ilin g Te mpe ra tu re ( oC) 0 50 100 150 200 250 300 0.3 m x 0.3 m 0.6 m x 0.6 m 1.0 m x 1.0 m 1.0 m x 2.0 m Pan Size Fire Size (kW) 0 1000 2000 3000 4000 Resp onse T ime ( s ) 0 20 40 60 80 100 120 140 Linear system D-1L1 Linear system D-2L2 Flame detector D-3F1 VID detector D-4C1 Spot detector D-7H1 Spot detector D-8H2 Smoke system D-9S1 Detection Systems
Figure 14. Maximum ceiling temperatures along center of the tunnel.
Figure 15. Detection times to gasoline pool fires behind a large vehicle.
The VID camera provided video images showing the fire conditions in the tunnel for the initial 360 s of the test with a 0.3 m x 0.3 m fire located behind the simulated vehicle. When the fire size increased, the period of time available for monitoring the tunnel conditions decreased, as more smoke was produced. The time at which the camera view was completely obstructed by the smoke was approximately 180 s for the 0.6 m x 0.6 m fire, 88 s for the 1.0 m x 1.0 m fire, and only 34 seconds for the 1.0 m x 2.0 m fire. These times were consistent with smoke density measured in the tests and much shorter than those for the tests with the fire located underneath the vehicle.
The optical fiber linear heat detection system D-1L1 was able to provide information on the temperature along the cable. It could also identify the fire position within a 2 m range.
7.4. Engine Compartment Fires
A simulated vehicle engine compartment with dimensions of 1.5 m wide x 1.2 m long x 0.67 m high was built, as shown in Figure 16. A gasoline fuel pan with a movable lid was placed inside the engine compartment. The dimension of the fuel pan was 1.0 m wide by 2.0m long by 0.2 m high. During the test, the size of the opening of the pan gradually increased to simulate the fire growth rate produced by a real vehicle engine compartment fire [21, 22]. The maximum heat release rate produced in the test was approximately 2,000 kW.
A propane burner was also used to simulate a vehicle engine compartment fire. The burner was placed inside the engine compartment. The growth rate and heat release rate during the test were controlled manually and were similar to those produced by a real vehicle engine compartment fire [21, 22].
Time (s) 0 10 20 30 40
Heat flux location 1 m 2 m 0 100 200 300 400 500 600 700 Hea t F lux (k w /m 2) 5 m 10 m 29 m Ignition
Figure 16. Picture of the setup for an engine compartment fire.
Figure 17. Heat flux produced by a simulated engine compartment fire (T-5).
The fire in the engine compartment grew slowly. The flames were confined inside the engine compartment during the initial stage of the fire and then gradually developed outside the compartment. The fire development and smoke spread in the tunnel could be observed clearly, since there was no obstacle around the simulated vehicle. The test with gasoline (T-5) was terminated using a compressed air foam (CAF) system when the fire reached its maximum heat release rate of approximately 2,000 kW at 510 s after ignition. An initial increase in fire size was produced with the discharge of foam, which agitated the fire.
Figure 17 shows the heat flux produced by the engine compartment fire measured at different locations in the tunnel. The fire developed slowly and produced a continuous increase in heat release rate. The results were different from those observed in pool fires located underneath and behind the vehicle which had an initial rapidly increase in heat flux followed by a steady burning.
The variation of ceiling temperatures along the center of the tunnel is shown in Figures 18. The ceiling temperatures increased slowly with time and reached their maximum temperatures of 150oC after approximately 480 s.
Figure 19 is the smoke optical density measured at the middle of the tunnel. The smoke density at 150 mm below the ceiling was very low during the initial 2 minutes, and then gradually increased. The smoke densities measured at 1.53 m and 2.50 m above the tunnel floor started to increase approximately 240 s after ignition.
Figure 18. Ceiling temperatures along center of the tunnel. 0 50 100 150 200 0.0 0.2 0.4 0.6 0.8 1.0 1.2 1.4 Time(s) 0 100 200 300 400 500 600 700 S m oke Opti cal Density (O D/m ) 2.5 m above ground 1.53 m above ground 0.15 m below ceiling Location Time (s) TC location from east end of tunnel (m)
3.12 6.25 C e iling Temp era ture ( oC) 9.38 0 100 200 300 400 500 600 700 12.50 15.62 18.75 21.88 25.00 28.12 31.25 34.38 ignition Ignition
Figure 19. Smoke optical density below the ceiling at center of the tunnel.
The fire detection systems generally had slow response to the simulated engine compartment fire (T-5), as the fire grew slowly. As shown in Figure 20 and Table 2, the linear heat detection systems D-1L1 and D-2L2 detected the fire at 107 s and 175 s, respectively. The two spot heat detectors D-7H1 and D-8H2 detected the fire at 391 s and 295 s. The smoke detection system D-9S1 responded to the fire at 177 s. The VID detectors D-4C1 and D-6C3 detected the fire at 76 s and 149 s, respectively. The optical flame detector D-3F1 detected the fire at 5 s after ignition.
For the test with the propane burner, flames were observed from the two sides of the engine compartment but no smoke was generated. The response times of the linear heat detection systems, spot heat detectors and VID D-4C1 to the propane fire were shorter than with the gasoline pan fire (Table 2). However, the flame VID D-6C3 detector and the smoke detection system D-9S1 did not detect the propane burner fire as limited smoke was produced.
Res pons e Time (s ) 0 100 200 300 400 500
Engine compartment fire Passenger compartment fire
D-1L1 D-2L2 D-3F1 D-4C1 D-6C3 D-7H1 D-8H2 D-9S1
Figure 20. Detection times of fire detectors/detection systems to engine and passenger compartment fires
7.5. Passenger Compartment Fires
A mock-up simulating the front portion of a vehicle passenger compartment with a dimension of 1.5 m wide x 1.2 m long x 1.2 m high was built. It was assumed that during the fire incident, the door on the driver side of the vehicle was left open, as the driver escaped from the burning vehicle. The flames and smoke escaped from the passenger compartment through the open door. The fuel in the passenger compartment is mainly solid fuels. For the present test series, a wood crib with a dimension of 0.8 m x 0.8 m x 0.7 m and a weight of 62.5 kg was placed inside the compartment. Three small pans with 100 ml of methyl hydrate per pan were placed underneath the wood crib in a triangular arrangement. They were used as ignition sources. The setup of the passenger compartment fire scenario is shown in Figure 21.
The wood crib fire was repeatable and easily controlled in the tests. It could produce a fire that had a similar heat release rate and growth rate as those produced in a real vehicle passenger compartment fire [21, 22]. The heat release rate of the simulated passenger compartment fire produced by the wood crib fire was measured [20]. The maximum heat release rate produced in the test was approximately 1,200 kW.
Figure 21. Photograph of the setup for a passenger compartment fire.
Figure 22. Simulated passenger compartment fire with wood cribs.
The simulated passenger compartment fire with the wood crib developed slowly. In the initial stage of the fire, no visible flame was observed outside the compartment and the amount of smoke produced was limited. After 180-240 s, the flames were observed outside the compartment through the opening, as shown in Figure 22.
The growth of the passenger compartment fire is illustrated by the change in heat flux (Figure 23). The fire size started to increase after 120 s, and it took approximately 360 s for the fire to reach its maximum heat output. The fire size remained steady for another 540 s until the fuel gradually burnt out. The test lasted approximately 18 minutes before the fire was extinguished. Compared to the engine compartment fire, the simulated passenger compartment fire was smaller and had a different growth rate.
0 5 10 15 20 Time (s)
Heat flux meter location 1 m 2 m 0 200 400 600 800 1000 1200 1400 H eat Flux (k W/m 2 5 m 10 m ) 29 m ignition
Figure 23. Heat flux produced by a simulated passenger compartment fire (T-14).
Ceiling temperatures in the tunnel had the same trend as the heat flux. As indicated in Figure 24, the ceiling temperatures across the tunnel near the fire started to increase a few minutes after ignition. The ceiling temperatures gradually increased to a maximum of 100oC near the fire and subsequently remained constant.
Figure 25 shows the smoke optical density produced by the simulated passenger compartment fire. The smoke optical density was low, compared to the simulated engine compartment fire involving gasoline. The difference in smoke optical density measured at different vertical locations in the tunnel ceiling was not significant. This was consistent with the observation during the test in which light smoke filled the entire tunnel and there was no distinct hot smoke layer in the tunnel. The flame/smoke VID detector D-4C1 was able to provide video images showing fire conditions in the tunnel during the entire test.
Time (s) 0 20 40 60 80 100 120 140 0.0 0.2 0.4 0.6 0.8 1.0 0 200 400 600 800 1000 1200 1400 2.5 m above ground 1.53 m above ground 0.15 m below ceiling Location Sm ok e Op tic al D en s ity ( O D /m)
Figure 24. Ceiling temperatures across the tunnel near fire.
Figure 25. Smoke optical density below the ceiling at center of the tunnel.
Time (s)
TC location from north wall of tunnel (m) 8.34 6.67 5.0 3.34 Te mper a tur e ( o C) 1.67 ignition Ignition 0 200 400 600 800 1000 1200
The response of fire detection systems to the simulated passenger compartment fire with wood cribs (T-14) was slower than to the engine compartment fire. As shown in Figure 20 and Table 2, the two linear heat detection systems D-1L1 and D-2L2 detected the fire at 171 s and 291 s, respectively. The optical flame detector D-3F1 also had a slow response to the fire at 173 s. The two VID detectors D-4C1 and D-6C3 detected the fire at 188 s and 271 s, respectively. The smoke detection system D-9S1 responded to the fire at 230 s. The two spot heat detectors D-7H1 and D-8H2 did not respond to the fire.
A test was conducted with a 0.6 m x 0.6 m x 0.1 m thick polyurethane foam. The foam was sprayed with 100 ml of methyl hydrate and placed behind the simulated passenger compartment. The fire grew quickly and produced a small flame and dark smoke. Since the fire was small and obstructed, only the linear heat detection system D-1L1, the optical flame detector D-3F1, the VID D-4C1detector and the smoke detection system D-9S1 responded to the fire.
7.3. Moving Fires and Response of Detection Systems
A small moving fire, which was fully open to the optical based detectors, was used to determine if a moving fire could be detected. In actual vehicle fires, the fire may be partially or wholly obscured making such fires even more difficult to detect.
A ceramic fibre pad with a dimension of 0.3 m x 0.3 m was used to be a fire source during tests. Fifty ml of gasoline was sprayed on the pad, producing a 100 ~ 150 kW of the heat release rate, when the fire source was at rest. During the tests, the pad was ignited inside a box, preventing the fire from being detected before moving. After ignition, the fire
source was dragged by a cable using a high-speed winch apparatus in the lane close to the south wall of the tunnel.
Six fire tests with two different driving speeds (approximately 27 km/h and 50 km/h) and two driving directions relative to the wall-mounted detectors (toward and away from the detectors) were conducted. Figure 26 shows a moving fire in the tunnel at the speed of 27 km/h. There was no change in temperature and no smoke production was observed when the fire traveled through the tunnel.
Moving fire Moving fire
Figure 26. Photo of a moving fire in the tunnel at the speed of 27 km/h.
Only the optical flame detector D-3F1 detected the moving fire at a speed of 27 km/h with the detection time ranging from 2 s to 4 s, as indicated in Table 2. The response time was shorter when the fire moved toward the detector than that when the fire moved away from the detector. The optical flame detector did not respond to the fire when it moved at the speed of 50 km/h.
SUMMARY
The tests conducted in a laboratory tunnel facility showed that the response of fire detection systems to a tunnel fire incident was dependent on the size, location and growth rate of the fire, fuel type as well as the detection method.
Most of fire detection systems evaluated in the tests were able to quickly detect small and unobstructed pool fires. The pool fires located underneath a simulated vehicle was a challenging scenario for the detection systems. The flames and heat produced by the fire were confined by the vehicle body, and the flames were also partially obstructed by the vehicle that was located between the wall-mounted detectors and fires.
The pool fires located behind a large vehicle presented less of a challenge for the fire detection systems, compared to the fire located underneath the vehicle, as the vehicle body in front of the fire did not affect the burning process of the fire as well as smoke spread in the tunnel. However, it was difficult for the flame VID detector to detect the fire, as the flames was obstructed by the large vehicle body.
The response of the detection systems to the stationary vehicle fires was slow, because the fires grew very slowly. The small moving vehicle fires were difficult to detect. They did not produce any changes in the temperature and smoke optical density in the tunnel when they traveled through the tunnel.
The general performance of each type of technology is summarized as follows:
1. Linear heat detection systems. The linear heat detection systems had good response
to the fires, based on rate of temperature rise. They detected most of fires presented in the tests, including a small-unobstructed pool fire that was detected by the optical fiber detection system. Their detection times were mainly determined by the fire size and fuel type. The fire position, whether it was obstructed or not, had a limited influence on their performance. The fibre-optical based linear heat detection system was also able to determine the fire location.
2. Flame detector. The detector with a high sensitivity performed well in the tests. It was able to quickly detect most of fires. It was the only detector that responded to the moving fire at a low moving speed.
3. Video imaging detection (VID) systems. All the VID systems were able to detect small-unobstructed fires quickly. The flame VID detection system that relied on flame characteristics had difficulty detecting concealed fires (under a vehicle, behind a vehicle or inside a vehicle), as the field of view was obstructed. The flame/smoke VID detectors that utilized both flame and smoke characteristics had better response for the concealed fire scenarios. The VID D-4C1 detected all the fires, except the moving fires. It was able to provide video images to monitor fire conditions in the tunnel. The time period available for monitoring fire conditions changed with the fire size, location and growth rate of the fire, and fuel type. For the large fires with a quick growth rate, the available monitoring time was very short as the smoke quickly filled the tunnel.
4. Spot heat detectors. The spot heat detectors were not able to detect small fires.
They only responded to fires of 1,500 kW or larger.
5. Smoke detection system. The smoke detection system was able to detect most of the
fires in the tests. It had no response to the small moving fires and propane fires that produced a limited amount of smoke. Its detection time was mainly determined by the fire size and fuel type. The fire position, whether it was obstructed or not, had a limited effect on its performance.
ACKNOWLEDGEMENTS
The project was conducted under the auspices of the Fire Protection Research Foundation (FPRF). The authors would like to acknowledge the support of the Technical Panel and Sponsors for the project. A special acknowledgement is noted to Kathleen Almand of the FPRF for managing the project. The support of the technical staff that conducted the tests is also acknowledged.
REFERENCES
1. B. Brousse, “Comparison of fire safety problems for the various transport modes in tunnels,” First International Symposium on safe & Reliable Tunnels, Prague 2004. 2. PIARC, “Fire and smoke control in road tunnels,” World Road Association, 1999. 3. NFPA 502, “Standard for Road Tunnels, Bridges, and other Limited Access
Highways,” National Fire Protection Association, 2004
4. U.S. Department of Transportation, Federal Highway Administration, “Prevention and Control of Highway Tunnel Fires,” FHWA-RD-83-032, 1984.
5. Zalosh, R and Chantranuwat, P., “International Road Tunnel Fire Detection Research Project, Phase 1: Review of Prior Test Programs and Tunnel Fires,” The Fire Protection Research Foundation, November 2003.
6. H. Ishii, K. Kawamura, T. Ono, H. Megumi, and A. Kikkawa, “A fire detection system using optical fibres for utility tunnels,” Fire Safety J. 29 (1997) 87-98.
7. H. Mashimo, “State of the Road Tunnel Safety Technology in Japan,” Tunnelling and Underground Space Technology, 17 (2002) 145-152.
8. Capaul, T., “Evaluation linear temperature sensor response testing in Mositunnel, Switzerland, June 11-12, 1992,” Cerberus Report, 1992.
9. Magerle, R., “Fire Protection Systems for Traffic Tunnels Under Test,” Proceedings AUBE 01 Conference, NIST, 2001.
10. Wieser, D. and Brupbacher, T., “Smoke Detection in Tunnels Using Video Images,” Proceedings AUBE 01 Conference, NIST, 2001.
11. Webb, K., “Hot Smoke Tests in the South East Transit Project Busway Tunnel Section 1B – Ernest Street and Water Street,” BCE Doc. 00/351, CSIRO, September 2000.
12. Juzo Unpki and Shoichi Kimura, “New Fire Detecor for Road Tunnels,” Fire Safety Journal, P.215-224, 6, 1983.
13. Azuma, T., Gunki, S., Ichikawa, A. and Yokota, M., “Effectiveness of a Flame
Sensing Type Fire Detector in a Large Tunnel,” 6th International Conference on
Safety in Road and Rail Tunnels, Marseilles, France, October 2004
14. Brugger, S. “Rapid Fire Detection Concept for Road Tunnels,” 5th International Conference on Safety in Road and Rail Tunnels, Marseilles, France, October 2003 15. FIT European Thematic Network, “Fire Safety Design – Road Tunnel” Draft 2,
September 2003
16. Ingason, H. Lonnermark, A., “Recent Achievements Regarding Measuring of Time-Heat and Time Temperature Development in Tunnels,” 1st International Symposium on Safe & Reliable Tunnels, Prague, April 2004.
17. Versavel, J. and Collins, S., “Automatic Incident Video Detection: the Standard its Technology Today for Traffic and Tunnel Safety,” 6th International Conference on Safety in Road and Rail Tunnels, Marseillse, France, October 2004.
18. Liu, Z.G., Kashef, A., Lougheed, G.D., Su, J.Z., Bénichou, N., Almand, K. H., "An Overview of the international road tunnel fire detection research project," 10th Fire Suppression and Detection Research Application Symposium, Orlando, FL., U.S.A. February 01, 2006
19. G. Crampton, G. Lougheed, “Comparison of Smoke Measurement with Standard and Non-Standard Systems,” NRC-IRC Research Report: IRC-RR-183, November 2004 20. Liu, Z. G., Crampton, G. P., Kashef, A. H., Lougheed, G. D., Gibbs, E., Su, J. Z.
and Benichou, N., “ International Road Tunnel Fire Detection Research Project – Phase II: Task 1, Fire Detectors, Fire Scenarios and Test Protocols,” National Research Council Canada, Fire Protection Research Foundation, Report (B-4179.1), July 2006
21. J. Mangs and O. Keski-Rahkonen, “Characterization of the Fire Behaviour of a Burning Passenger Car, Part I: Car Fire Experiments,” Fire Safety Journal 23 (1994) 17-35
22. J. Mangs and O. Keski-Rahkonen, “Characterization of the Fire Behaviour of a Burning Passenger Car, Part II: Parametrization of Measured Rate of Heat Release Curves,” Fire Safety Journal 23 (1994) 37-49
i
At the time of tests conducted in this paper, it was not known if hydrocarbon pool fires could be used in the tunnel in Montreal used for the tests discussed in Part 2 of this paper. A propane burner fire was used for a limited number of tests to provide baseline data in case such a system was used for the tests in Montreal. The results are included in this paper as they provide useful data for several of the detection systems.