Exp Brain Res (2003) 153: 614–627 DOI 10.1007/s00221-003-1613-3
R E S E A R C H A RT I C L E
Caroline Durif . Christophe Jouffrais .
Eric M. Rouiller
Single-unit responses in the auditory cortex of monkeys
performing a conditional acousticomotor task
Received: 11 November 2002 / Accepted: 14 June 2003 / Published online: 25 October 2003 # Springer-Verlag 2003
Abstract The general goal of the present study was to
assess the response properties to tones of single neurons in
the auditory cortex (primary auditory area, A1, and middle
lateral auditory belt, ML) of two macaque monkeys while
performing an acousticomotor discrimination task
requir-ing a controlled level of attention and motivation. For each
neuron, an approximation of the frequency receptive field
(FRF) was first established. Second, based on the FRF,
sets of paired tone frequencies were defined in which two
different tone frequencies had to be associated by the
monkey, following a trial and error strategy, to a left or a
right key-press with the left arm. After acquisition of the
association, the two tones of the pair were presented
randomly (
“instruction stimulus”) and, if the monkey
touched the correct key, the stimulus was repeated
(
“confirmation stimulus”) and a reward was delivered.
The majority of units (63%) had a FRF formed by multiple
peaks, whereas 25% and 12% of units exhibited a simple
U-shaped FRF and a
“mosaic” FRF, composed of several
separated zones of response, respectively. Five principal
response patterns were observed: On, Off, On-Off,
Sustained, and Inhibition. In relation to the acousticomotor
association task, some auditory cortical neurons (33%)
exhibited a different response to the same stimulus when
presented, in the same trials, as instruction or as
confirmation. It was also observed that the response to
the same instruction stimulus could differ when comparing
correct trials with erroneous trials (wrong motor response).
In conclusion, the response properties of auditory cortical
neurons in behaving monkeys are strongly dependent on
the physical parameters of sounds (frequency, intensity,
etc.) as indicated by FRF characteristics, but a substantial
influence of the behavioral context and performance may
also play an important role.
Keywords Sensorimotor . Primate . Behavior . Tones .
Response pattern . Receptive field.
Introduction
Responsiveness to complex sounds in the auditory cortex
was studied in nonhuman primates (anesthetized
prepara-tions: Rauschecker et al. 1995; Wang et al. 1995;
Rauschecker 1998a, 1998b; Wang and Kadia 2001;
Nagarajan et al. 2002; awake preparations: Manley and
Muller-Preuss 1978; Glass and Wollberg 1979; Schwarz
and Tomlinson 1990; Pelleg-Toiba and Wollberg 1991;
Bieser and Muller-Preuss 1996; Bieser 1998; Fishman et
al. 2000; Liang et al. 2002). To investigate more basic
properties, responses to simple sound stimuli were
examined, with emphasis on tonotopy in Old World
(anesthetized preparations: Merzenich and Brugge 1973;
Morel et al. 1993; Kosaki et al. 1997; Rauschecker et al.
1997; awake preparations: Recanzone et al. 2000a) and
New World monkeys (anesthetized preparations: Imig et
al. 1977; Aitkin et al. 1986; Luethke at al. 1989; Morel
and Kaas 1992; Recanzone et al. 1999; awake
prepara-tions: Cheung et al. 2001a). A tonotopic arrangement has
been observed in the primary auditory cortex, as well as in
other auditory cortical areas in both cats and monkeys
(Brugge and Merzenich 1973; Merzenich et al. 1975;
Reale and Imig 1980; Aitkin et al. 1986; Cheung et al.
2001a). Experiments conducted in behaving macaque
monkeys showed a considerable variability of other
response properties across neurons, such as threshold,
peak activity, latency, frequency tuning, and intensity
function. These investigations did not reveal a clear
C. Durif . C. Jouffrais . E. M. Rouiller (*)
Division of Physiology and Program in Neurosciences, Department of Medicine, Faculty of Sciences, University of Fribourg, Chemin du Musée 5, 1700 Fribourg, Switzerland e-mail: [email protected] Tel.: +44-26-3008609 Fax: +44-26-3009675 Present address: C. Jouffrais
Centre de Recherche Cerveau et Cognition, CNRS-UPS UMR 5549, Université Paul Sabatier,
133 route de Narbonne, 31062 Toulouse Cedex, France
functional specialization, but instead supported the notion
that the auditory cortical areas differ in a probabilistic
manner, in the sense that the proportions of the different
response types varied from one area to the next
(Recanzone et al. 2000a). Nevertheless, in the lateral belt
areas, neurons
’ preferences for complex sounds revealed a
specificity of the anterolateral area for monkey calls,
whereas the caudolateral area exhibited the greatest spatial
selectivity (Rauschecker et al. 1995; Rauschecker and Tian
2000; Tian et al. 2001). These data, together with the
parallel arrangement of the connections between the
auditory cortex and the prefrontal cortex (Romanski et
al. 1999a, 1999b; Kaas and Hackett 1999), were taken as
evidence for a processing of the
“what” and “where”
attributes of acoustic stimuli along largely separate
streams. Such segregation of information processing
related to sound recognition, and sound localization is
consistent with recent data derived from human subjects
(Maeder et al. 2001; Adriani et al. 2003).
Tonotopy is an important organizational principle
(Calford et al. 1983), but it is only one of many stimulus
dimensions potentially encoded in the auditory cortex. For
instance, a neuron is also defined by its frequency
selectivity, determined by its
“frequency tuning curve”
(FTC). Fairly stereotyped FTCs were recorded from
primary auditory neurons but, at progressively higher
stages of the auditory pathways, neurons exhibit more and
more complex FTCs (Recanzone et al. 2000b; Sutter
2000). Frequency selectivity was demonstrated to be
substantially modified by the level of anesthesia (Pfingst et
al. 1977; Benson et al. 1981; Zurita et al. 1994; Kisley and
Gerstein 1999; Cheung et al. 2001b; Gaese and Ostwald
2001) and, in awake animals, by different conditions of
attention or of learning (Pfingst et al. 1977; Benson et al.
1981; Diamond and Weinberger 1989; Bakin and
Weinberger 1990; Edeline and Weinberger 1993; Edeline
et al. 1993; Weinberger et al. 1993; Ohl and Scheich 1997;
Ahissar et al. 1998; Kisley and Gerstein 2001). Complex
FTCs were particularly prominent in the auditory cortex of
awake squirrel monkeys (Funkenstein and Winter 1973;
Pelleg-Toiba and Wollberg 1989).
Criteria established in the cochlear nucleus (Kiang
1965; Kiang et al. 1965; Pfeiffer and Kiang 1965; Pfeiffer
1966; Rhode and Kettner 1987; Young et al. 1988) were
applicable to most response patterns observed in the
inferior colliculus of monkeys (Ryan and Miller 1977,
1978). Recently, Recanzone (2000a) examined whether
the response pattern categorization elaborated in the CN
can be transposed to single neurons in the primary
auditory cortex (A1) of behaving macaque monkeys.
Although some basic response patterns described in the
CN were also observed in A1, the responses were rather
found to form a continuum across several patterns, in
contrast to discrete and well-separated classes.
Further-more, in sharp contrast to the CN, A1 neurons frequently
exhibited either excitatory or inhibitory responses
follow-ing the offset of the stimulus. In a study conducted in
behaving macaque monkeys (Pfingst and O
’Connor
1981), responses of auditory cortical neurons were
described as phasic, when restricted to the onset of the
stimulus, or tonic, when maintained throughout the
stimulus duration.
The activity of neurons in the primate auditory cortex is
strongly affected by the level of anesthesia, motivation,
and the level of attention (Benson et al. 1981). In other
words, it is likely that the response of an auditory cortical
neuron may be modified if, instead of being stimulated
passively, the animal expects the presentation of stimuli
(Miller et al. 1972; Pfingst et al. 1977). Even more
prominent effects may be expected if the stimulus carries
crucial information for the selection of an appropriate
behavioral response giving access to a reward (Hocherman
et al. 1981). For this reason, a first aim of the present study
was to establish the response patterns and tuning
proper-ties of single auditory cortical neurons of monkeys in the
context of a complex acousticomotor delayed task
requiring a sustained and controlled level attention and
motivation of the animal.
Although the response properties of auditory cortical
neurons are generally considered to be largely determined
by the physical parameters of the stimulus (frequency and
intensity for a pure tone), an influence of the behavioral
dimension is likely. For instance, it has been shown that
the response of a given auditory cortical neuron to a tone
burst or a noise burst differs when the same stimulus
instructs different motor responses (Vaadia et al. 1982). In
order to extend these data, a comparable, but more
elaborated acousticomotor task was designed in the
present study, in which monkeys had to associate, by
trial and error, tones with reaching movements aimed to
different targets while recording neuronal activity in the
auditory cortex. This paradigm allowed us to investigate
different facets of the influence of the behavioral context
on the responses of auditory cortex neurons to
behavio-rally significant acoustic stimuli. More specifically, the
two following questions will be addressed. Does a tone
generate a similar neuronal response when presented as
“instructing” stimulus or as stimulus “confirming” that the
motor selection was correct (context effect)? Does the
neuronal response to a tone instructing a motor selection
differ whether the animal produced a correct or an
erroneous behavioral response (
“predictive” effect)?
Methods
AnimalsExperiments were conducted on two rhesus monkeys (Macaca mulatta), 3.5 years old (MK1) and 9 years old (MK2), weighing 4 and 8 kg, respectively. Sucrose and grain-based pellets were used as the primary reward during the training and experimental sessions. At no time were the monkeys deprived of food, but they proved to be sufficiently motivated to execute daily a number of trials ranging from 300 to 500. Rewards (pellets of grain-based and purified diets) obtained during the daily sessions were the first food access of the day. Additional food (animals’ maintenance food, fruit and cereals) was provided after the daily sessions. The animals had free access to water, and their body weight was checked daily and remained stable. The experimental protocols were performed in accordance with the
National Institutes of Health Guide for the Care and Use of Laboratory Animals (1996), the European Community’s Guidelines for Animal Protection and Use for Experimentation, and approved by the Swiss veterinary authorities.
Stimulus generation and delivery
Experiments were conducted in a double-walled, sound-attenuation room (Eckel audiometric booth, type AB200), and stimuli were delivered under free-field conditions through two MLi-691P speak-ers located 0.4 m lateral to the monkey’s head. The sound-delivery system was calibrated with a sound-level meter (Brüel and Kjaer, 2231), using a microphone (Brüel and Kjaer, 4155; prepolarized free-field half-inch) placed at the position of the animal’s left and right ears. Stimuli were generated digitally using the Virtual Waves 2.23 software, shaped routinely into 500-ms bursts, with 10 ms rise and fall time. The standard stimuli consisted of pure-tone bursts (11 frequencies available: 0.2, 0.4, 0.8, 1.2, 1.6, 2.4, 3.2, 4.8, 6.4, 9.6, and 12.8 kHz). Additional stimuli included tone sweeps (500 ms; up and down) covering narrow frequency ranges (0.25–1 kHz, 1– 5 kHz, 5–10 kHz, 10–15 kHz, 15–20 kHz), complex sounds (including species-specific vocalizations) and white-noise bursts.
Behavioral task
The monkeys were initially trained over 10-12 months to execute an acousticomotor conditional task with the head unrestrained. It should be noted here that the training of macaque monkeys to a conditional motor task instructed acoustically turned out to be much longer than training to a motor task based on visual instructions (Kermadi et al. 1998; Wannier et al. 2002). During each daily session, the animal was exposed to several sets of paired pure tones delivered at 60 dB SPL. In each set, two different tone frequencies were presented and, by trial and error, the monkey had to associate each of the two tones to a specific motor response, namely a left or a right key-touch performed with the left arm. After acquisition of the association (usually 90% of correct responses), obtained usually after 5-10 trials, the two tone bursts were presented randomly. After 12 correct trials for each paired stimulus, a new set of two frequencies had to be acquired by the monkey.
The monkey faced a vertical transparent glass, in front of a monitor screen. Below the monitor, at arm’s distance, a horizontal touch-sensitive pad was used by the animal to place the left hand after a white square appeared on the screen, triggering the initiation of a trial (Fig. 1A). In front of the monkey and next to the initiation pad, a pellet basin was used to distribute the reward. The transparent glass was adorned by a panel composed of two key-detectors corresponding to the targets for the monkey’s motor response. The initiation of the trial was followed by a random delay, ranging from
Fig. 1A, B Schematic repre-sentation of a typical (correct) trial (A) and its time structure (B). A Schematic representation of the experimental setup. The monkey, sat in its primate chair, faced a vertical transparent glass, in front of a monitor screen. Below the monitor, a horizontal touch-sensitive pad (bottom left, gray rectangle) was used as start-lever for initiating a trial. Next to the start-lever, a pellet basin was used to deliver the reward (not shown). The transparent glass is adorned by a panel composed of two key-detectors (black squares corre-sponding to the left and right motor response targets). B Schematic representation of the temporal sequence of events during a typical trial of the acousticomotor task (see text for details). Row 1 indicates the position of the different events imposed to the monkey (stimuli, variable delays, etc.). Row 2 illustrates the monkey’s motor behavior. From trial initiation, the monkey maintained the left hand on the start pad until the go-signal, followed by a reac-tion time (RT) preceding the pointing movement to the se-lected target. (IS instructing stimulus, CS confirmation stim-ulus)
1,200 to 2,500 ms, before the presentation of one of the two tones of the set, corresponding to the instruction stimulus (IS). After a second random delay (ranging from 400 to 1,400 ms), a visual go-signal (gray rectangle) appeared on the top of the monitor, instructing the animal to execute the motor response (left or right key-touch). If the monkey touched the correct key, the stimulus was repeated, corresponding to the so-called confirmation stimulus (CS). Finally, a reward was delivered 200 ms after the CS. On the other hand, if the monkey touched the wrong key an error-signal was delivered (dark-blue rectangle displayed in the middle of the monitor) and the trial was aborted. In MK1, in some recording sessions, the visual error-signal was accompanied by presentation of the tone associated to the wrong key, thus corresponding to an acoustic error-signal. The monkey was given a maximum time of 6-7 s to perform the entire sequence, although the duration of the trials usually ranged from 4 to 5.5 s (Fig. 1B).
Surgery
When the monkeys reached a daily stable level of performance (80– 90% of correct responses), a head-fixation bar in titanium (63 mm long, 4–8 mm wide, and 10 mm high) was implanted longitudinally above the midline. The head fixation device was anchored to the skull using 10 titanium screws and orthopedic cement (Palacos R-40 + 500 mg gentamicin). The monkey was then retrained in order to perform the task having the head fixed. When the daily stable level of performance was recovered, a cylindrical, stainless steel recording chamber (skull-mounting chamber—Narishige MO-95 skull mounting hydraulic microdrive) was implanted vertically on the left side, to allow subsequent vertical electrode penetrations to reach the left auditory cortex. A CT scan of the monkey’s head was performed before implantation in order to optimize the positioning of the recording chamber, together with the stereotaxic landmarks. The shape of the head-fixation device was also adjusted based on the shape of the skull as seen on the CT scan.
Surgeries for the implantation of the head-fixation bar and recording chamber were performed as follows under aseptic conditions. Antibiotics (Albipen: ampicillin 10%, 15–30 mg/kg s. c. or i.m.) were given before the surgery and for 5 days postoperatively, as well as the analgesic carprofen (Rimadyl, 4 mg/kg s.c.) to prevent pain. Anesthesia was induced by injection of ketamine hydrochloride (Ketalar, 5 mg/kg i.m.). Atropine sulfate (0.05 ml/kg i.m.), dexamethasone (Decadron, 0.05 ml/kg diluted 1:1 in saline, i.m.) and the analgesic Carprofen were then administered. During implantation, performed under deep anesthesia maintained by perfusion of propofol 1% (Fresenius, 3 ml/kg per hour i.v.), heart and respiration rates, rectal temperature, O2 blood saturation, and
expiratory CO2content were continuously monitored. A craniotomy
was performed in order to expose the dura above the relevant cortical region (centered 10 mm AP and 25 mm lateral, based on coordinates derived from CT scans of the two monkeys and the rhesus monkey brain atlas; Paxinos et al. 2000). The chamber (18 mm inside-diameter) was anchored to the skull with titanium-screws and cemented with orthopedic cement. A stainless steel cap was screwed onto the chamber to seal it in between recording sessions. The dura was left intact, the muscles and the skin were then sutured. The animals were allowed at least 2 weeks to recover before the recording sessions began. During the entire recording period, the head and the chamber were cleaned daily with a iodine solution (Betadine) and locally treated with an antibiotic (Nebacetin: neomycin and bacitracin).
Recording procedure
During the recording session, the monkey sat in a primate chair and was observed via a video camera. Action potentials were recorded extracellularly with tungsten microelectrodes (FHC, Brunswick, Maine, USA; impedance adjusted to 2–4 MΩ at 1 kHz). The microelectrode was advanced vertically to the auditory cortex using
a skull-mounting hydraulic microdrive system (Narishige MO-95), fixed to the chronically implanted chamber (Pfingst and O’Connor 1980). A cannula guide, added to the drive system, ensured vertical penetrations. The microelectrode was advanced successively through the dura, the parietal cortex, the white matter, the dorsal bank of the lateral sulcus, crossed the lateral sulcus itself, where an absence of neural activity was observed, to finally access the ventral bank of the lateral sulcus. Recordings were made at depths ranging from approximately 7 to 19 mm below the pial surface. Activity was recorded from single neurons in the left auditory cortex. After recording a neuron, a minimum displacement of the electrode of 250μm was made before searching another cell. Neuronal activity was amplified (×10,000; AC differential amplifiers, model MDA-4; BAK Electronics), filtered (0.5–5 kHz) and displayed on an oscilloscope. The action potentials were discriminated from back-ground activity with an amplitude discriminator system (FHC, type Slope/Height; ×4), and the resulting trigger pulses were stored on-line in digital form (resolution 1 ms) on a PC computer using the freeware data acquisition software Cortex (developed at the NIMH: http://www.cortex.salk.edu). The same software allowed presenta-tion of the visual and acoustic stimuli, as well as the control of the behavioral task.
Following isolation of a single unit, the 11 frequency tone bursts were delivered to the monkey at 5 intensities (40, 50, 60, 70, and 80 dB SPL), in order to determine the patterns of response to tones and the FRF. Each tone burst at a given frequency and intensity was repeated 3–5 times along a pseudorandom sequence. Two consecutive tone bursts were separated by a period of silence of 300 ms. Based on the FRF, 3–5 tones were selected in order to define sets of 2 frequencies that would be used for the behavioral task (see above). If, after completion of the behavioral task, the unit was still present, the procedure of FRF determination was repeated.
Data analysis
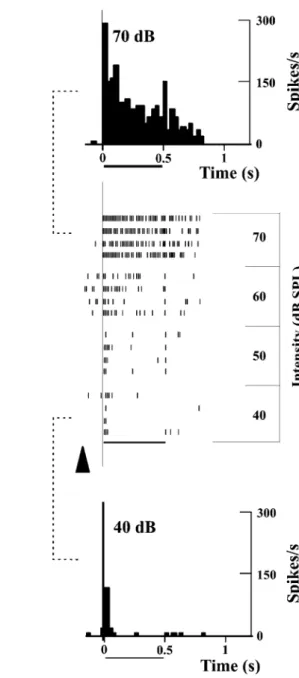
Data collected during the FRF assessment were analyzed off line, using raster displays and peristimulus time histograms (PSTHs), in which trials were aligned to the onset of the tone bursts. In contrast to the trials recorded during the behavioral task (see below), the rapid pseudorandom presentation of the tone bursts did not allow establishment quantitatively of an“activity of reference” of the unit. Therefore, the FRF and the patterns of response were determined on the basis of visual inspection of the PSTHs and dot rasters, by comparing the activity during and preceding the tone bursts. Response patterns were classified into five groups: (1) an “On” response was defined as a phasic increase in discharge rate within the first 200 ms of the tone burst; (2) an “Off” response corresponded to a phasic increase in activity following the offset of the stimulus; (3) a combination of the two responses above was referred to as an“On–Off” response; (4) a “sustained” response was defined as an increase in discharge rate maintained throughout the 500 ms of the stimulus presentation; (5) a decrease in activity during the tone burst was referred to as an“inhibition”.
The behavioral performance was assessed using trigger signals corresponding to discrete events of the task, generated by sensors (pad pressed or released, touching of target, delivery of reward, etc.). Neuronal activity was analyzed off-line, using raster displays and PSTHs, in which the trials were aligned to different events. A statistical criterion was applied in order to establish whether an activity was considered as a significant modulation in relation to the task. A mean baseline activity (“activity of reference”) of the neuron and its standard deviation (SD) were calculated, while the animal was sitting quietly with the left hand on the touch-sensitive pad, on a 600-ms window of activity taken in the random delay preceding the IS. A level of activity which was higher, or lower, than the mean activity of reference ±3 SDs was considered as a significant task-related increase (excitation) or decrease (inhibition), respectively, of firing rate.
Results
Extracellular activity was recorded from a total of 82
auditory cortical neurons responsive to tones, sampled
along 56 electrode penetrations (n=40 in MK1 and n=16 in
MK2) aimed mainly toward the core of the auditory
cortex, principally to A1 (Rauschecker et al. 1997; Hackett
et al. 2001). These units were all tested for their responses
to tones, as determined by the presentation of the 11
frequencies available. Among them, a subgroup of 45
units were recorded sufficiently long in order to perform
the behavioral paradigm.
For each monkey, a surface map of the stereotaxic
coordinates of all electrode penetrations was established.
Electrode penetrations were distant from each other by
0.5 mm along the rostrocaudal and mediolateral axes. In
both monkeys, the zone on the surface map containing all
electrode penetrations covered a rostrocaudal extent of
6 mm and 5 mm along the mediolateral axis. A
reconstruction of electrode penetrations and determination
of unit location on histological sections was not possible in
MK1 due to a massive hemorrhage that occurred after a
recording session, along the electrode track while crossing
the parietal lobe. As a result, a considerable distortion of
the left hemisphere took place, affecting substantially the
auditory cortex.
After killing MK2, postmortem landmarks were made,
based on the stereotaxic coordinate system, in order to
transpose the position of the surface map on histological
sections. In addition, marks left by electrode penetrations
performed during the few sessions preceding the death of
the animal were observed on histological sections. The
most caudal electrode penetrations were located at the
rostrocaudal stereotaxic coordinate 4.2 mm (as defined in
the atlas of the rhesus monkey brain; Paxinos et al. 2000),
corresponding to the caudal limit of the auditory
konio-cortex (areas AKL and AKM), considered also as the
caudal limit of A1; Hackett et al. 1998). Considering a
rostrocaudal extent of 10 mm for A1 (Hackett et al. 1998),
all our electrode penetrations were thus comprised within
the rostrocaudal extent of A1. Mediolaterally, transposed
on the atlas of the monkey brain, the electrode penetrations
were located between the stereotaxic coordinates 21 and
26 mm from midline (between 22 and 25 mm for the most
rostral electrode tracks). This general location indicates
that the majority of the electrode penetrations in MK2 are
in the auditory koniocortex (in other words, in A1),
although a few of them (the most lateral ones) may have
rather crossed the lateral belt, more precisely the middle
lateral auditory belt (ML), as defined by Hackett et al.
(1998).
As explained above, histological reconstruction was not
possible in MK1. However, the area covered by the
electrode penetrations was similar (6 mm by 5 mm) and
the same stereotaxic targets were aimed. In addition, the
response characteristics were comparable between the two
monkeys. Therefore, we tend to assume that the
distribu-tion of the electrode penetradistribu-tions was comparable in MK1,
in other words focused mainly to A1 and, to a lesser
extent, ML. In the present report, reference to units located
in the
“auditory cortex” thus means belonging to the areas
A1 or ML.
Assessment of FRF and response patterns
As explained in the Methods section, a pseudorandom
sequence of 55 tone bursts (11 frequencies at 5 intensity
levels) was delivered 3
–5 times while the monkey was
waiting for the initiation of the rewarded behavioral task.
A typical response of an auditory cortical neuron to the
eleven frequencies presented at 2 intensities (40 and 70 dB
SPL) is shown in Fig. 2. This neuron exhibited a complex
behavior, as reflected by a response present at several
frequencies and intensities tested. In addition, the patterns
of response were quite variable across frequency and
intensity. Representative examples of the five main
temporal patterns of response to tones (On, Off, On
–Off,
sustained and inhibition) are shown in Fig. 3.
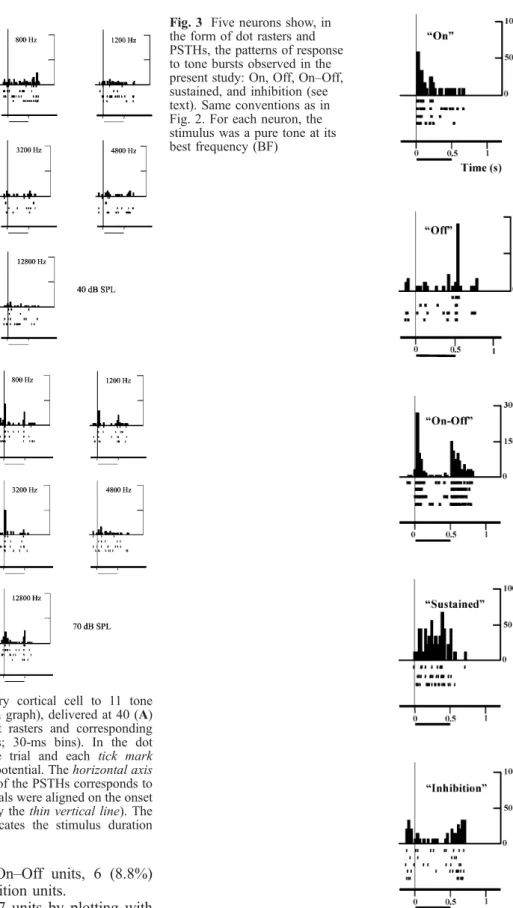
The variability of response patterns to tone bursts
observed for a given neuron is illustrated in more detail in
Figs. 4, 5, 6. First, response patterns were influenced by
the intensity. In response to pure-tone bursts at best
frequency (BF), increasing the intensity from 40 to 80 dB
SPL led to a change from an On response at 40 and 50 dB
SPL to an On
–Off response at 60, 70, and 80 dB SPL
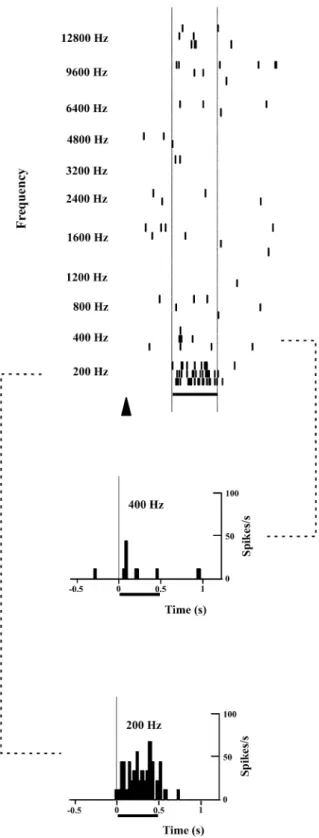
(Fig. 4). Another neuron displayed a progressive change
from an On to a sustained response when the intensity was
increased from 40 to 70 dB SPL (Fig. 5). Second, it is well
known that, at a fixed intensity, the response pattern may
vary with frequency. The neuron in Fig. 6 exhibited a
limited frequency domain of selectivity characterized by a
strong, sustained excitation at 200 Hz, whereas at 400 Hz
the response was limited to an onset component (On
response). No clear response was observed at other
frequencies. Overall, with respect to their patterns of
response to tones, 3.8% of neurons were purely intensity
dependent, 11.5% of neurons were purely frequency
dependent, whereas the vast majority of them (53.8%)
were both frequency and intensity dependent. In the latter
case, this means that more than one pattern of response
was observed at a given frequency and, similarly, more
than one pattern of response was observed at a given
intensity. The remaining tone responsive neurons (30.8%)
showed a response pattern that was not clearly affected by
either the frequency or the intensity of the tone bursts. The
only change was, at most, a gradual increase or decrease in
discharge rate without change of response pattern and/or a
narrowing in the effective range of frequencies as the
intensity of the stimulus was reduced. Due to this
variability of response patterns observed for a single
neuron, it was meaningless to classify neurons based on
that property. Nevertheless, for a subpopulation of cells
where a BF could be tentatively defined (n=68), the units
were distributed according to their response patterns
observed at BF and at threshold (or at 40 dB SPL). The
following distribution was obtained: 48 (70.6%) On units,
6 (8.8%) Off units, 6 (8.8%) On
–Off units, 6 (8.8%)
sustained units, and 2 (3%) inhibition units.
FRFs were approximated in 77 units by plotting with
different symbols the response pattern observed at a given
combination of frequency and intensity among the 55 tone
bursts tested. Different symbols were used to distinguish
the five response patterns (Fig. 7). Finally, an outline
surrounding all symbols was drawn, thus approximating
the FRF (Fig. 7). Units were distributed in 3 groups based
on the shape of their FRF: single FRF with multiple peaks
(group I in Fig. 7A), single FRF with one peak or U shape
FRF (group II in Fig. 7B) and mosaic FRF (group III in
Fig. 7C). The latter group was characterized by the
presence of separated zones of frequency sensitivity. The
Fig. 2A, B Responses of an auditory cortical cell to 11 tone frequencies (indicated in hertz for each graph), delivered at 40 (A) and 70 dB SPL (B), as seen on dot rasters and corresponding peristimulus time histograms (PSTHs; 30-ms bins). In the dot rasters, each row represents a single trial and each tick mark represents the occurrence of an action potential. The horizontal axis is time (seconds) and the vertical axis of the PSTHs corresponds to the number of spikes per second. All trials were aligned on the onset of the stimulus (time zero, indicated by the thin vertical line). The solid bar below each dot raster indicates the stimulus duration (500 ms)
Fig. 3 Five neurons show, in the form of dot rasters and PSTHs, the patterns of response to tone bursts observed in the present study: On, Off, On–Off, sustained, and inhibition (see text). Same conventions as in Fig. 2. For each neuron, the stimulus was a pure tone at its best frequency (BF)
absolute numbers of groups I, II, and III FRFs are given in
Table 1 and they represented 63.6%, 24.7% and 11.7% of
all units, respectively.
Group II units, characterized by a restricted zone of
frequency sensitivity, exhibited in general a relatively
limited variability of response pattern (Table 1). Indeed,
group II units presented only one (42.1%) or two (57.9%)
patterns of response across the FRF. In contrast, as
illustrated in Fig. 7, most group I units (57.1%) exhibited
three response patterns across the FRF. Group III units
presented a variation across their FRF with either two
(22.2%) or four (22.2%) patterns of response (Table 1). A
typical, complex variation of response patterns is
illu-strated for a group I unit in Fig. 8. This unit was
responsive to two frequency domains at low intensity
(40 dB SP), namely from 200 to 1,200 Hz and from 4,800
to 9,600 Hz. These two frequency domains became larger
at 50 dB SPL and finally merged at higher intensity (60
and 70 dB SPL). Note that at least three patterns of
response can be seen: On, On
–Off, and sustained.
Fig. 4 Responses of a single auditory cortical cell to a tone burst at best frequency (BF; 400 Hz) presented at five in-tensities, illustrating the depen-dency of response pattern onto intensity. Same conventions as in Fig. 2
Fig. 5 Responses of a single auditory cortical cell to a tone burst at BF (200 Hz) presented at four intensities, illustrating in the form of dot rasters a gradual change of response strength, from On to sustained. Collection of data began for each trial at the time point indicated by the arrowhead. The response at the lowest (40 dB SPL) and highest (70 dB SPL) intensities are also represented by a PSTH. Same conventions as in Fig. 2
Behavioral task
A total of 45 neurons could be recorded long enough in
order to perform the behavioral paradigm for at least one
set of 2 frequencies presented in the 2 epochs in which
each frequency was associated successively to the left and
right targets, as explained in the Methods section.
Behavioral data regarding the reaction time (RT) and the
movement time (MT) were derived from the sessions in
which the activity of the 45 neurons included in the
present analysis was recorded. As illustrated in Fig. 1, RT
is the time separating the go-signal from the initiation of
the movement of the left hand. MT is the time interval
between the initiation of the movement of the left hand
and the touch of the left or right target. RT and MT values
are given in Table 2, separately for the two monkeys. It
appeared that MK1 exhibited statistically significant
shorter RTs and MTs than MK2 (P<0.01), with the
exception of the RT for the left target trials (P=0.074). In
general, SDs were relatively small (Table 2), indicating
that the behavioral performance was stable, suggesting
that the levels of attention and motivation were fairly
constant. RT values were in a range consistent with
previous experiments in our laboratory, where monkeys
performed a visuomotor unimanual conditional task
(Kermadi et al. 1998), in which RTs ranged from 220 to
286 ms. Therefore, RTs appear to be comparable for
unimanual motor tasks instructed visually or acoustically.
There was no difference between trials aimed toward the
left target versus the right target, except for the RTs in
MK1 (Table 2).
With respect to single-unit data, it was found that some
auditory cortical neurons exhibited a clear influence of the
Fig. 6 Dot rasters illustrate the responses of a single auditory cortical cell to tone bursts of different frequency presented at a stable intensity of 80 dB SPL. The responses to 200-Hz and 400-Hz tone bursts are represented in the form of PSTHs also. Same conventions as in Figs. 2 and 5
Table 1 Number of response patterns in the frequency receptive field (FRF). For each FRF group, the number and percentage of units exhibiting 1, 2, 3, 4, or 5 different response patterns within their FRF are indicated. The sum of all percentages in each FRF group is 100%. Note that FRF group I units tend to have more variability of response patterns within their FRF than the other two groups
FRF groups Response patterns Units (n=77)
1 2 3 4 5
n % n % n % n % n % n %
Group I 12 24.6 6 12.2 28 57.1 3 6.1 49 100
Group II 8 42.1 11 57.9 19 100
Group III 5 55.6 2 22.2 2 22.2 9 100
Table 2. Behavioural data given by mean values of reaction times and movement times
Reaction time (ms) Movement time (ms) Left target Right target Left target Right target
Mean SD Mean SD Mean SD Mean SD
Monkey 1 251* 21 231 9 203 17 222 20
Monkey 2 282 39 275 40 316 9 310 24
*Significant difference of reaction times between trials aimed to the left target versus trials aimed to the right target: P<0.009 (SYSTAT: two-sample Kolmogorov-Smirnov). The other differences between left and right targets were not statistically significant: P>0.05
behavioral context, both on their discharge rate and
temporal response pattern. For instance, the response to
the tone instructing a given movement (instruction
stim-ulus, IS) was different from the response to the same tone
delivered when the monkey reached the target, thus
confirming that the behavioral response was correct
(confirmation stimulus, CS). It should be pointed out
here that the IS and the CS were delivered one after the
other in the same trials, separated by a delay ranging from
approximately 1,500 to 2,800 ms, including the
“waiting
period
” preceding the go-signal, the RT and the motor
response time. The neuron illustrated in Fig. 9 exhibited a
dramatic difference between the activity related to the IS
versus to the CS. A statistically significant On response
was observed when the trials were aligned to the onset of
the IS, a response that did not appear when the same trials
were aligned to the onset of the same stimulus presented as
CS. Such an effect (IS versus CS) was observed in 33.2%
of neurons tested for the behavioral paradigm. Responses
latencies to the IS and CS were compared and did not
shown statistically significant differences. In details, for
On responses, the mean latency to the IS was 30 ms (SD
10 ms) whereas it was 31.3 ms (SD 4.3 ms) for the CS. For
Off responses, the mean latencies were 23.8 (SD 7.5 ms)
and 21.1 ms (SD 6.1 ms), following the offset of the IS
and CS, respectively.
As mentioned earlier, the monkey reached a level of
performance higher than 90% and therefore relatively few
errors were made (pointing the wrong target). However, in
rare cases, the animal made more erroneous trials than
Fig. 7 Three single auditory cortical neurons illustrate the three types (groups) of FRFs, as defined in the text. The response patterns observed at each com-bination of frequency and in-tensity are distinguished by dif-ferent symbols. Note the vari-ability of response patterns ob-served within the FRF of the two units representative of the groups I and III
usual, offering the possibility to compare the response to
the IS between correct and erroneous trials. For some units
(3.7%) there was a statistically significant difference
between the two activities. The neuron shown in Fig. 10
exhibited an On
–Off response to an IS (1,200 Hz)
delivered in trials where the monkey performed a correct
left-target touch (Fig. 10, top panel). In contrast, the same
stimulus presented as IS did not elicit a clear response in
trials where the monkey pointed incorrectly to the right
target (Fig. 10, bottom panel).
Discussion
To reduce the duration of the protocol of stimulation and
to put emphasis on the behavioral acousticomotor
paradigm, the determination of the FRF was shortened,
limited to an approximation based on 11 tone frequencies
presented at 5 intensity levels. As a result, we did not
establish quantitatively the frequency tuning curves given
by iso-rate contours, as done by Recanzone et al.
(Recanzone 2000b; Recanzone et al. 2000a). Instead, we
obtained a qualitative approximation of the FRF,
suffi-cient, however, to categorize units in 3 groups (Fig. 7) and
assess the variability of response patterns within the FRF,
an issue rarely addressed so far in the auditory cortex of
the awake macaque monkey. As a result, a direct
comparison with previous studies concerning frequency
selectivity is therefore not straightforward. Nevertheless,
qualitatively, the three groups of FRFs reported here
(Fig. 7) also appear in the figures illustrating the frequency
response areas determined on the basis of discharge rate
(Schwartz and Tomlinson 1990; Recanzone 2000b;
Recanzone et al. 2000a). Due to our protocol compromise,
we did not establish systematically the threshold at BF and
therefore our data do not allow a comparison of frequency
tuning with studies where this parameter was established
quantitatively with Q
10or Q
40values (Pelleg-Toiba and
Wollberg 1989; Recanzone et al. 2000a).
The patterns of response to tone bursts reported here
(On, Off, On
–Off, sustained, and inhibition) were
observed in the awake squirrel monkey exposed to passive
tonal stimulation (Funkenstein and Winter 1973;
Pelleg-Toiba and Wollberg 1989) and in the awake macaque
monkey performing a simple reaction-time auditory task
(Pfingst and O
’Connor 1981). Response patterns to tone
and noise bursts in the auditory cortex of primate were
compared with patterns defined in the cochlear nucleus
(Recanzone 2000a). If some response patterns were
common for the two structures (On, sustained), responses
classified as
“primary-like” or “chopper” in the cochlear
nucleus were not seen in the auditory cortex (Recanzone
2000a; present study). On the other hand, Off responses
were frequently observed in the auditory cortex of primate
but not in the cochlear nucleus (Recanzone 2000a; present
study). The attribution of a response pattern to a unit is
unequivocal in the cochlear nucleus, by taking as criterion
the response profile observed at characteristic frequency
(CF) 10 dB above threshold (Pfeiffer and Kiang 1965;
Pfeiffer 1966). In the auditory cortex, the application of
such criterion is less reliable in the sense that the BF may
be difficult to define, for instance in units exhibiting
multiple peaks of sensitivity in their FRF (e.g., our FRF
groups I and III). After eliminating ambiguous cases, we
tentatively attributed a response pattern to a unit, defined
as the response profile observed at BF for the lowest
intensity tested generating a response. Recanzone (2000a)
classified the units in two main classes,
“tonic” and
“phasic,” representing 30–40% and 60–70% of units in the
areas A1 and the caudomedial area (CM), respectively.
One may tentatively consider that the response patterns
sustained and inhibition observed in the present report
Fig. 8 Responses of a single auditory cortical cell to 44 combinations of frequency and intensity, illustrating a group I FRF and the variability of re-sponse patterns. Same conven-tions as in Figs. 2 and 5
would roughly correspond to the class
“tonic” and would
thus amount to 12%. How to explain the lowest proportion
of tonically responsive units in the present study? First, the
tone bursts used by Recanzone (2000a) were much shorter
(200 ms) than in the present study (500 ms). Units
responding for approximately 200 ms and classified as
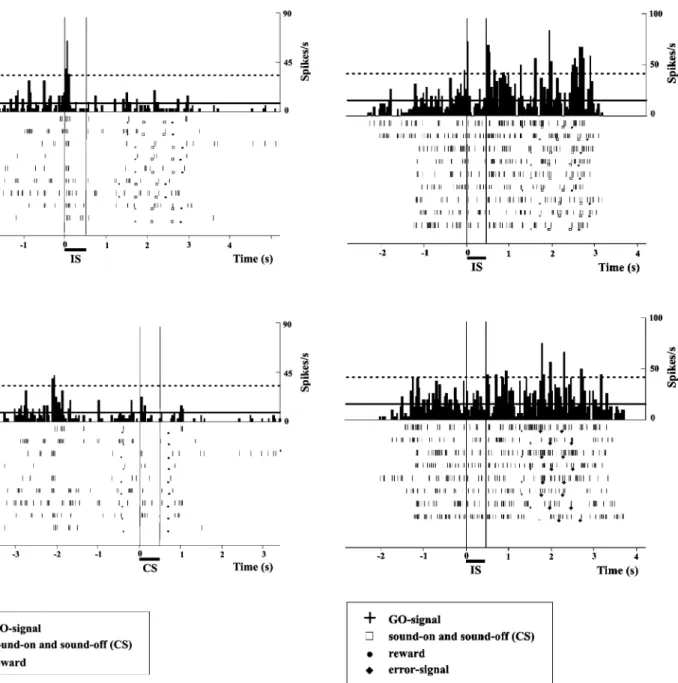
Fig. 9 PSTHs (bin width 40 ms) and dot rasters illustrate the responses of a single auditory cortical cell to a pure tone at BF (200 Hz), presented at 60 dB SPL either as instructing stimulus (IS, top panel) or as confirmation stimulus (CS, bottom panel). The same trials are depicted in the two panels, but they were aligned on the IS in the top panel and on the CS in the bottom panel. The onset of stimulus is indicated by the thin vertical line at time zero. In the dot rasters, the second thin vertical line indicates stimulus offset, at time 0.5 s. In the PSTHs, the solid horizontal line represents the mean activity of reference and the dashed horizontal line, a deviation from the mean activity of reference of +3 SDs (see Methods). Discrete events in the task are represented by different symbols in the dot rasters. Note the presence of an On response to the IS (top panel), which does not appear when the same stimulus was presented as CS (bottom panel)
Fig. 10 PSTHs (bin width 40 ms) and dot rasters illustrate the responses of a single auditory cortical cell to a pure tone at 1,200 Hz (60 dB SPL), presented as instruction stimulus (IS) and instructing a left target touch, for correct trials (top panel) or for incorrect trials (bottom panel). Trials were aligned on the IS in the two panels. The onset of stimulus is indicated by the thin vertical line at time zero. The second thin vertical line indicates stimulus offset, at time 0.5 s. In PSTHs, the solid horizontal line represents the mean activity of reference and the dashed horizontal line a deviation from the mean activity of reference of +3 SDs (see Methods). Discrete events in the task are represented by different symbols in the dot rasters. Note an On–Off response to the IS in the top panel, absent or dramatically reduced in the bottom panel, although the stimulus was the same. Note in the upper PSTHs the presence of several significant bins later during the trials, corresponding to a possible activation of the unit in response to the subsequent presentation of the same stimulus as confirmation (CS) and/or delivery of reward. In the lower PSTH, the presence of several significant bins later during the trials are also due to the presentation, in this case in MK1, of an acoustic error-signal (see Methods) and/or related to the delivery of reward
tonic by Recanzone (2000a) may become phasic if the
stimulus lasts longer. In addition, the criteria used to define
a tonic unit are not the same in the two studies. Finally, our
definition of response patterns based on visual inspection
of dot rasters and PSTHs may contribute to underestimate
the proportions of tonic Inhibitions, particularly when the
spontaneous discharge rate is low, a property relatively
frequently exhibited by the units included in the present
analysis.
A major conclusion of the present report is the
variability of response patterns to tones observed for a
given unit within its FRF. Several units illustrated in the
present report displayed a progressive change of response
pattern when varying stimulus parameters (frequency and/
or intensity; see Figs. 4, 5, 6, 8). Most units exhibited a
FRF classified as group I (multiple peaks) and, among
them, the majority included three different response
patterns in their FRF (Table 1). Overall, 68% of units
displayed at least one change of response pattern in the
FRF, a figure fairly comparable with the proportion of
approximately 60% reported by Pelleg-Toiba and
Woll-berg (1989) in the squirrel monkey. The observation that a
majority of units changed their response patterns to tones
within their FRF emphasizes the notion that this parameter
does not allow an unequivocal classification of units in the
auditory cortex of awake and behaving monkeys.
Furthermore, in agreement with the conclusions of
Recanzone (2000a), the frequent and progressive changes
of response patterns observed here in the FRFs argue for a
continuum from one response pattern to another rather
than for strictly separated categories.
The behavioral acousticomotor association task
de-scribed here is reminiscent of the paradigm reported by
Vaadia et al. (1982). These authors showed two examples
of units in the auditory cortex exhibiting a variation of
response to tone (1 unit) or to noise (the other unit) when
the same stimulus instructed first a left and then a right
shift of a lever using the arm. The proportion of units
exhibiting this behavioral meaning effect was 17% (Vaadia
et al. 1982). Such units reflecting the processing of
acousticomotor association were also observed in our
paradigm, but they will be described in details in a
separate report. As an original contribution with respect to
the study of Vaadia et al. (1982), the present report
provides evidence that the same stimulus can produce a
different response when presented as
“instruction cue” or
as
“confirmation stimulus” (Fig. 9). Such an observation
reflecting a context effect, observed in approximately
one-third of units, can be interpreted in different ways: (1) a
more prominent response to the same stimulus when
presented as IS than as CS may reflect a more focused
attention of the monkey to the IS than to the CS. Indeed,
the IS is crucial in order to select the correct movement,
whereas the CS is presented after the behavioral response
and therefore cannot influence the performance; (2) a
certain level of attention (different to that focused on the
IS) may be associated to the CS, because the latter informs
the monkey whether its motor selection was correct or not.
In other words, in contrast to the IS, the CS includes a
component of positive reinforcement; (3) the sensory
response to the CS may be influenced by the fact that it is
a stimulus that was already presented earlier during the
trial. Indeed, it was shown that a forward masking or
enhancement effect due to a preceding stimulus can
influence the second response (Brosch and Schreiner
1997; Brosch et al. 1999); however, the absence of
response to the CS in Fig. 9 is unlikely to be due to such a
forward masking, because of the relatively long delay
between the IS and the CS (at least 1.5 s). Another
possible source of suppression of response to the second
stimulus is adaptation, corresponding to a decrease in
responsiveness to repeated or prolonged stimulation, thus
becoming behaviorally irrelevant. In the present paradigm,
the IS and CS are neither prolonged nor irrelevant, thus
excluding such dramatic adaptation effect on the second
response; (4) in contrast to the IS, the CS
“predicts” the
delivery of a reward, a condition known to influence the
discharge properties of neurons in the basal ganglia,
prefrontal, and cingulate cortices (see Schultz et al. 2000;
Hikosaka and Watanabe 2000 for review; Shima and Tanji
1998). Whether responses in the auditory cortex can be
modulated by the expectation of a reward remains to be
determined by designing specific behavioral paradigms
focused on the reward delivery.
In absence of monitoring of movements of the eyes, one
cannot completely exclude that some of the effects
observed here in the auditory cortex may derive from an
influence of eye position. Indeed, an effect of eye position
has been recently reported for approximately 20% of
neurons in the core area of the auditory cortex of macaque
monkeys (Werner-Reiss et al. 2003). However, the
proportion of responding units was higher than 20% in
the present study. Furthermore, systematic and precisely
time-locked onset or offset responses to the IS and CS
with short latencies (20
–30 ms on average) as observed
here can hardly be produced by systematic changes in eye
position locked to the acoustic stimulus. Indeed, in the
present experimental conditions, the acoustic stimulus was
not delivered at a restricted position of the acoustic space
to which the animal may have produced a saccade.
Moreover, signals coming from the frontal eye field or
from other oculomotor centers are likely to take more time
than 20
–30 ms to reach the auditory cortex.
Also original, as far as we know, is the observation of
auditory cortical neurons whose responses to an
instruct-ing tonal stimulus varied significantly dependinstruct-ing on
whether the monkey performed correctly or not the
acousticomotor association (Fig. 10). In a way, these
units seem to
“predict,” at the level of single cell in the
auditory cortex, the motor behavior of the animal. Due to
the rarity of erroneous trials after intensive training of the
animals, opportunities to collect enough incorrect trials are
few and therefore it was not possible to infer the
proportion of such
“predicting” units in the auditory
cortex, without making an underestimation. Of course, this
type of units is likely to be encountered fairly frequently in
the prefrontal cortex, in particular in areas involved in the
selection of the motor response. The presence of such units
early in the acousticomotor loop, at the level of the
auditory cortex, remains to be explained. It may well
represent the result of a feedback information from the
prefrontal cortex to the auditory cortex. The anatomical
support of this feedback influence may be the dense
projections, demonstrated anatomically, from areas 10, 12,
45, and 46 of the prefrontal cortex and terminating in the
belt and parabelt regions of the auditory cortex (Romanski
et al. 1999a, 1999b).
Acknowledgements The authors thank V. Moret, F. Tinguely, and C. Roulin for histology; A. Gaillard, B. Aebischer, and E. Regli for designing and building the mechanics and electronics of home-made equipment as well as maintenance; J. Corpataux and B. Morandi for taking care of the animals in the animal room; L. Monney for informatics. The work was supported financially by the Swiss National Science Foundation (grant 31-61857.00) and the National Center for Competence in Research (NCCR, Neural Plasticity and Repair). We thank Dr. Hoogewoud and Mr. Devaud (Cantonal Hospital of Fribourg) for the collection of CT scan data.
References
Adriani M, Maeder P, Meuli R et al. (2003) Sound recognition and localisation in man: specialised cortical networks and acute effects of circumscribed lesions. Exp Brain Res
Ahissar E, Abeles M, Ahissar M, Haidarliu S, Vaadia E (1998) Hebbian-like functional plasticity in the auditory cortex of the behaving monkey. Neuropharmacology 37:633–655
Aitkin LM, Merzenich MM, Irvine DRF, Clarey JC, Nelson JE (1986) Frequency representation in the auditory cortex of the common marmoset (Callithrix jacchus jacchus). J Comp Neurol 252:175–185
Bakin JS, Weinberger NM (1990) Classical conditioning induces CS-specific receptive field plasticity in the auditory cortex of the guinea pig. Brain Res 536:271–286
Benson DA, Hienz RD, Goldstein MH Jr (1981) Single-unit activity in the auditory cortex of monkeys actively localizing sound sources: spatial tuning and behavioral dependency. Brain Res 219:249–267
Bieser A (1998) Processing of twitter-call fundamental frequencies in insula and auditory cortex of squirrel monkeys. Exp Brain Res 122:139–148
Bieser A, Muller-Preuss P (1996) Auditory responsive cortex in the squirrel monkey: neural responses to amplitude-modulated sounds. Exp Brain Res 108:273–284
Brosch M, Schreiner CE (1997) Time course of forward masking tuning curves in cat primary auditory cortex. J Neurophysiol 77:923–943
Brosch M, Schulz A, Scheich H (1999) Processing of sound sequences in macaque auditory cortex: response enhancement. J. Neurophysiol 82:1542–1559
Brugge JF, Merzenich MM (1973) Responses of neurons in auditory cortex of the macaque monkey to monaural and binaural stimulation. J Neurophysiol 36:1138–1159
Calford MB, Webster WR, Semple MM (1983) Measurement of frequency selectivity of single neurons in the central auditory pathway. Hear Res 11:395–401
Cheung SW, Bedenbaugh PH, Nagarajan SS, Schreiner CE (2001a) Functional organization of squirrel monkey primary auditory cortex: responses to pure tone. J Neurophysiol 85:1732–1749 Cheung SW, Nagarajan SS, Bedenbaugh PH et al. (2001b) Auditory
cortical neuron response differences under isoflurane versus pentobarbital anesthesia. Hear Res 156:115–127
Diamond DM, Weinberger NM (1989) Role of context in the expression of learning-induced plasticity of single neurons in auditory cortex. Behav Neurosci 103:471–494
Edeline J-M, Weinberger NM (1993) Receptive field plasticity in the auditory cortex during frequency discrimination training: selective retuning independent of task difficulty. Behav Neu-rosci 107:82–103
Edeline J-M, Pham P, Weinberger NM (1993) Rapid development of learning-induced receptive field plasticity in the auditory cortex. Behav Neurosci 107:539–551
Fishman YI, Reser DH, Arezzo JC, Steinschneider M (2000) Complex tone processing in primary auditory cortex of the awake monkey. I. Neural ensemble correlates of roughness. J Acoust Soc Am 108:235–246
Funkenstein HH, Winter P (1973) Responses to acoustic stimuli of units in the auditory cortex of awake squirrel monkeys. Exp Brain Res 18:464–488
Gaese BH, Ostwald J (2001) Anesthesia changes frequency tuning of neurons in the rat primary auditory cortex. J Neurophysiol 86:1062–1066
Glass I, Wollberg Z (1979) Lability in the responses of cells in the auditory cortex of squirrel monkeys to species-specific vocalizations. Exp Brain Res 34:489–498
Hackett TA, Stepniewska I, Kaas JH (1998) Subdivisions of auditory cortex and ipsilateral cortical connections of the parabelt auditory cortex in macaque monkeys. J Comp Neurol 394:475–495
Hackett TA, Preuss TM, Kaas JH (2001) Architectonic identification of the core region in auditory cortex of macaques, chimpanzees, and humans. J Comp Neurol 441:197–222
Hikosaka K, Watanabe M (2000) Delay activity of orbital and lateral prefrontal neurons of the monkey varying with different rewards. Cereb Cortex 10:263–271
Hocherman S, Itzhaki A, Gilat E (1981) The response of single units in the auditory cortex of rhesus monkeys to predicted and to unpredicted sound stimuli. Brain Res 230:65–86
Imig TS, Ruggero MA, Kitzes LM, Javel E, Brugge JF (1977) Organization of auditory cortex in the owl monkey. J Comp Neurol 171:111–128
Kaas JH, Hackett TA (1999)“What” and “where” processing in the auditory cortex. Nat Neurosci 2:1045–1047
Kermadi I, Liu Y, Tempini A, Calciati E, Rouiller EM (1998) Neuronal activity in the primate supplementary motor area and the primary motor cortex in relation to spatio-temporal bimanual coordination. Somatosens Mot Res 15:287–308 Kiang NYS (1965) Stimulus coding in the auditory nerve and
cochlear nucleus. Acta Otolaryngol 59:186–200
Kiang NYS, Pfeiffer RR, Warr WB, Backus ASN (1965) Stimulus coding in the cochlear nucleus. Ann Otol Rhinol Laryngol 74:463–485
Kisley MA, Gerstein GL (1999) Trial-to-trial variability and state-dependent modulation of auditory-evoked responses in cortex. J Neurosci 19:10451–10460
Kisley MA, Gerstein GL (2001) Daily variation and appetitive conditioning-induced plasticity of auditory cortex receptive fields. Eur J Neurosci 13:1993–2003
Kosaki H, Hashikawa T, He J, Jones EG (1997) Tonotopic organization of auditory cortical field delineated by parvalbu-min immunoreactivity in macaque monkeys. J Comp Neurol 386:304–316
Liang L, Lu T, Wang X (2002) Neural representation of sinusoidal amplitude and frequency modulations in the primary auditory cortex of awake primates. J Neurophysiol 87:2237–2261 Luethke LE, Krubitzer LA, Kaas JH (1989) Connections of primary
auditory cortex in the new world monkey (Saguinus). J Comp Neurol 285:487–513
Maeder P, Meuli R, Adriani M et al. (2001) Distinct pathways involved in sound recognition and localization: a human fMRI study. Neuroimage 14:802–816
Manley JA, Muller-Preuss P (1978) Response variability of auditory cortex cells in the squirrel monkey to constant acoustic stimuli. Exp Brain Res 32:171–180
Merzenich MM, Brugge JF (1973) Representation of the cochlear partition on the superior temporal plane of the macaque monkey. Brain Res 50:275–296
Merzenich MM, Knight PL, Roth GL (1975) Representation of the cochlea within primary auditory cortex in the cat. J Neurophy-siol 38:231–249
Miller JM, Sutton D, Pfingst B et al. (1972) Single-cell activity in the auditory cortex of rhesus monkeys: behavioral dependency. Science 177:449–451
Morel A, Kaas JH (1992) Subdivisions and connections of auditory cortex in owl monkeys. J Comp Neurol 318:27–63
Morel A, Garraghty PE, Kaas JH (1993) Tonotopic organization, architectonic fields, and connections of auditory cortex in macaque monkeys. J Comp Neurol 335:437–459
Nagarajan SS, Cheung SW, Bedenbaugh P et al. (2002) Representa-tion of spectral and temporal envelope of twitter vocalizaRepresenta-tions in common marmoset primary auditory cortex. J Neurophysiol 87:1723–1737
Ohl FW, Scheich H (1997) Learning-induced dynamic receptive field changes in primary auditory cortex of the unanaesthetized Mongolian gerbil. J Comp Physiol [A] 181:685–696
Paxinos G, Huang XF, Toga AW (2000) The rhesus monkey brain in stereotaxic coordinates. Academic, London, pp 1–165 Pelleg-Toiba R, Wollberg Z (1989) Tuning properties of auditory
cortex cells in the awake squirrel monkey. Exp Brain Res 74:353–364
Pelleg-Toiba R, Wollberg Z (1991) Discrimination of communica-tion calls in the squirrel monkey: “call detectors” or “cell ensembles”? J Basic Clin Physiol Pharmacol 2:257–272 Pfeiffer RR (1966) Classification of response patterns of spike
discharges for units in the cochlear nucleus: tone burst stimulation. Exp Brain Res 1:220–235
Pfeiffer RR, Kiang NYS (1965) Spike discharge pattern of spontaneous and continuously stimulated activity in the cochlear nucleus of anaesthetized cats. Biophys J 5:301–316 Pfingst BE, O’Connor TA (1980) A vertical stereotaxic approach to
auditory cortex in the unanesthetized monkey. J Neurosci Methods 2:33–45
Pfingst BE, O’Connor TA (1981) Characteristics of neurons in auditory cortex of monkeys performing a simple auditory task. J Neurophysiol 45:16–34
Pfingst BE, O’Connor TA, Miller JM (1977) Response plasticity of neurons in auditory cortex of the rhesus monkey. Exp Brain Res 29:393–404
Rauschecker JP (1998a) Cortical processing of complex sounds. Curr Opin Neurobiol 8:516–521
Rauschecker JP (1998b) Parallel processing in the auditory cortex of primates. Audio Neurootol 3:86–103
Rauschecker JP, Tian B (2000) Mechanisms and streams for processing of “what” and “where” in the auditory cortex. Proc Natl Acad Sci USA 97(22):11800–11806
Rauschecker JP, Tian B, Hauser M (1995) Processing of complex sounds in the macaque nonprimary auditory cortex. Science 268:111–114
Rauschecker JP, Tian B, Pons T, Mishkin M (1997) Serial and parallel processing in rhesus monkey auditory cortex. J Comp Neurol 382:89–103
Reale RA, Imig TJ (1980) Tonotopic organization in auditory cortex of the cat. J Comp Neurol 192:265–291
Recanzone GH (2000a) Response profiles of auditory cortical neurons to tones and noise in behaving macaque monkeys. Hear Res 150:104–118
Recanzone GH (2000b) Spatial processing in the auditory cortex of the macaque monkey. PNAS 97:11829–11835
Recanzone GH, Schreiner CE, Sutter ML, Beitel RE, Merzenich MM (1999) Functional organization of spectral receptive fields in the primary auditory cortex of the owl monkey. J Comp Neurol 415:460–481
Recanzone GH, Guard DC, Phan ML (2000a) Frequency and intensity response properties of single neurons in the auditory cortex of the behaving macaque monkey. J Neurophysiol 83:2315–2331
Recanzone GH, Guard DC, Phan ML, Su T-I K (2000b) Correlation between the activity of single auditory cortical neurons and sound-localization behavior in the macaque monkey. J Neurophysiol 83:2723–2739
Rhode WS, Kettner RE (1987) Physiological study of neurons in the dorsal and posteroventral cochlear nucleus of the unanesthe-tized cat. J Neurophysiol 57:414–442
Romanski LM, Bates JF, Goldman-Rakic PS (1999a) Auditory belt and parabelt projections to the prefrontal cortex in the rhesus monkey. J Comp Neurol 403:141–157
Romanski LM, Tian B, Fritz J et al. (1999b) Dual streams of auditory afferents target multiple domains in the primate prefrontal cortex. Nat Neurosci 2:1131–1136
Ryan A, Miller J (1977) Effects of behavioral performance on single-unit firing patterns in inferior colliculus of the rhesus monkey. J Neurophysiol 40:943–956
Ryan A, Miller J (1978) Single-unit responses in the inferior colliculus of the awake and performing rhesus monkey. Exp Brain Res 32:389–407
Schultz W, Tremblay L, Hollerman JR (2000) Reward processing in primate orbitofrontal cortex and basal ganglia. Cereb Cortex 10:272–283
Schwarz DWF, Tomlinson RWW (1990) Spectral response patterns of auditory cortex neurons to harmonic complex tones in alert monkey (Macaca mulatta). J Neurophysiol 64:282–298 Shima K, Tanji J (1998) Role for cingulate motor area cells in
voluntary movement selection based on reward. Science 282:1335–1338
Sutter ML (2000) Shapes and level tolerances of frequency tuning curves in primary auditory cortex: quantitative measures and population codes. J Neurophysiol 84:1012–1025
Tian B, Reser D, Durham A, Kustov A, Rauschecker JP (2001) Functional specialization in rhesus monkey auditory cortex. Science 292:290–293
Vaadia E, Gottlieb Y, Abeles M (1982) Single-unit activity related to sensorimotor association in auditory cortex of a monkey. J Neurophysiol 48:1210–1213
Wang X, Kadia SC (2001) Differential representation of species-specific primate vocalizations in the auditory cortices of marmoset and cat. J Neurophysiol 86:2616–2620
Wang X, Merzenich MM, Beitel R, Schreiner CE (1995) Representation of a species-specific vocalization in the primary auditory cortex of the common marmoset: temporal and spectral characteristics. J Neurophysiol 74:2685–2706 Wannier T, Liu J, Morel A, Jouffrais C, Rouiller EM (2002)
Neuronal activity in primate striatum and pallidum related to bimanual motor actions. Neuroreport 13:143–147
Weinberger NM, Javid R, Lepan B (1993) Long-term retention of learning-induced receptive-field plasticity in the auditory cortex. Proc Natl Acad Sci USA 90:2394–2398
Werner-Reiss U, Kelly AK, Trause AS, Underhill AM, Groh JM (2003) Eye position affects activity in primary auditory cortex of primates. Curr Biol 13:554–562
Young ED, Robert J-M, Shofner WP (1988) Regularity and latency of units in ventral cochlear nucleus: implications for unit classification and generation of response properties. J Neuro-physiol 60:1–29
Zurita P, Villa AEP, Ribaupierre Y de, Ribaupierre F de, Rouiller EM (1994) Changes of single unit activity in the cat’s auditory thalamus and cortex associated to different anesthetic condi-tions. Neurosci Res 19:303–316