HAL Id: hal-01691249
https://hal-brgm.archives-ouvertes.fr/hal-01691249
Submitted on 27 May 2020
HAL is a multi-disciplinary open access archive for the deposit and dissemination of sci-entific research documents, whether they are pub-lished or not. The documents may come from teaching and research institutions in France or abroad, or from public or private research centers.
L’archive ouverte pluridisciplinaire HAL, est destinée au dépôt et à la diffusion de documents scientifiques de niveau recherche, publiés ou non, émanant des établissements d’enseignement et de recherche français ou étrangers, des laboratoires publics ou privés.
Quantifying sediment sources in a lowland agricultural
catchment pond using
137Cs activities and radiogenic
87
Sr/
86Sr ratios
Marion Le Gall, O. Evrard, Anthony Foucher, J. Patrick Laceby, Sébastien
Salvador-Blanes, François Thil, Arnaud Dapoigny, Irène Lefèvre, Olivier
Cerdan, Sophie Ayrault
To cite this version:
Marion Le Gall, O. Evrard, Anthony Foucher, J. Patrick Laceby, Sébastien Salvador-Blanes, et al.. Quantifying sediment sources in a lowland agricultural catchment pond using 137Cs activities and radiogenic87Sr/86Sr ratios. Science of the Total Environment, Elsevier, 2016, 566-567, pp.968 - 980. �10.1016/j.scitotenv.2016.05.093�. �hal-01691249�
1
Quantifying sediment sources in a lowland agricultural catchment pond using
137Cs
1
activities and radiogenic
87Sr/
86Sr ratios
2
Marion Le Galla*, Olivier Evrarda, Anthony Foucherb, J. Patrick Lacebya,Sébastien Salvador-Blanesb, 3
François Thila, Arnaud Dapoignya, Irène Lefèvrea,Olivier Cerdanc, Sophie Ayraulta 4
a
Laboratoire des Sciences et de l’Environnement, UMR 8212 (CEA/CNRS/UVSQ), Université Paris-Saclay,
5
Domaine du CNRS, Avenue de la Terrasse, 91198 Gif-sur-Yvette Cedex, France
6
b
E.A 6293, Laboratoire GéoHydrosystèmes Continentaux (GéHCO), Université F. Rabelais de Tours, Faculté des
7
Sciences et Techniques, Parc de Grandmont, 37200 Tours, France
8
c
Département Risques et Prévention, Bureau de Recherches Géologiques et Minières, 3 avenue Claude
9
Guillemin, 45060 Orléans, France
10
Highlights
11
Surface sources supplied the majority of pond and core sediment.
12
Lithological sources were well mixed in surface pond sediment.
13
Lithological sources varied through time in the sediment core.
14
Temporal lithological fluctuations likely resulted from landscape modifications.
15
Understanding sediment dynamics is important in agricultural drained catchments.
16
Abstract
17
Soil erosion often supplies high sediment loads to rivers, degrading water quality and contributing to 18
the siltation of reservoirs and lowland river channels. These impacts are exacerbated in agricultural 19
catchments where modifications in land management and agricultural practices were shown to 20
accelerate sediment supply. In this study, sediment sources were identified with a novel tracing 21
approach combining cesium (137Cs) and strontium isotopes (87Sr/86Sr) in the Louroux pond, at the 22
outlet of a lowland cultivated catchment (24 km², Loire River basin, France) representative of drained 23
agricultural areas of Northwestern Europe. 24
Surface soil (n=36) and subsurface channel bank (n=17) samples were collected to characterize 25
potential sources. Deposited sediment (n=41) was sampled across the entire surface of the pond to 26
examine spatial variation in sediment deposits. In addition, a 1.10 m sediment core was sampled in 27
the middle of the pond to reconstruct source variations throughout time. 137Cs was used to 28
discriminate between surface and subsurface sources, whereas 87Sr/86Sr ratios discriminated 29
between lithological sources. A distribution modeling approach quantified the relative contribution 30
of these sources to the sampled sediment. 31
Results indicate that surface sources contributed to the majority of pond (μ 82%, σ 1%) and core (µ 32
88%, σ 2%) sediment with elevated subsurface contributions modeled near specific sites close to the 33
banks of the Louroux pond. Contributions of the lithological sources were well mixed in surface 34
sediment across the pond (i.e., carbonate sediment contribution, μ 48%, σ 1% and non-carbonate 35
sediment contribution, µ 52%, σ 3%) although there were significant variations of these source 36
contributions modeled for the sediment core between 1955 and 2013. These fluctuations reflect 37
both the progressive implementation of land consolidation schemes in the catchment and the 38
eutrophication of the pond. 39
This original sediment fingerprinting study demonstrates the potential of combining radionuclide and 40
strontium isotopic geochemistry measurements to quantify sediment sources in cultivated 41
catchments. 42
Keywords: fallout radionuclides, radiocesium, strontium isotopes, sediment tracing, fingerprinting 43
2
1
Introduction
44
Soil erosion is a major environmental threat worldwide. This process of detachment, transportation 45
and deposition of soil particles by rainfall and runoff particularly affects agricultural areas of 46
Northwestern Europe (Boardman, 1993; Evrard et al., 2007; Le Bissonnais et al., 2005). Soil erosion 47
not only results in decreasing soil fertility and crop yields (Bakker et al., 2004; Boardman et al., 2003), 48
it often supplies high sediment loads to river networks (Owens et al., 2005). 49
High suspended sediment loads may increase turbidity and result in the sedimentation of 50
downstream reservoirs and lowland river channels (Devlin et al., 2008; Vörösmarty et al., 2003). 51
Sediment may also transport nutrients and contaminants including phosphorous, pesticides, 52
persistent organic pollutants, heavy metals, pathogens and radionuclides (Ayrault et al., 2012; 53
Chartin et al., 2013; Gateuille et al., 2014; Horowitz, 2008). Therefore, understanding spatial and 54
temporal variations of sediment sources is useful for managing the supply of sediment and 55
contaminants in river systems. 56
Agricultural landscapes have been extensively modified by human activities during the last century to 57
facilitate mechanization and increase crop yields (Dotterweich, 2013; García-Ruiz, 2010; Valentin et 58
al., 2005). In wetlands, tile drain outlets have been installed and channels have been created to 59
evacuate excess water. Although these alterations resulted in substantial increases in soil erosion 60
and downstream sediment loads, there has been limited research quantifying erosion and sediment 61
transport in these areas (Foucher et al., 2014; Russell et al., 2001; Sogon et al., 1999; Walling et al., 62
2002). Furthermore, even fewer studies (e.g. Russell et al., 2001) have examined the relative 63
contribution of different sediment sources in these drained lowland agricultural catchments. 64
Quantifying sediment sources is important to target efficient management measures that reduce 65
sediment supply in catchments. Sediment fingerprinting techniques are therefore increasingly 66
applied to determine sediment sources and pathways in catchments and thus inform management 67
interventions (Collins and Walling, 2002; Koiter et al., 2013; Walling, 2005). Sediment fingerprinting 68
techniques often trace radionuclide, geochemical, and mineralogical soil and sediment properties 69
(Collins et al., 2012; Evrard et al., 2016; Evrard et al., 2011; Olley et al., 1993; Walling et al., 2008). 70
Sediment color or infrared spectroscopy (Martínez-Carreras et al., 2010; Poulenard et al., 2012), 71
plant pollen (Brown et al., 2008), soil enzymes (Nosrati et al., 2011), sediment magnetic properties 72
(Hatfield and Maher, 2009; Hatfield et al., 2008) or methyl esters (Banowetz et al., 2006) have also 73
been used to discriminate between potential sediment sources. For a review of the strengths and 74
limitations of different tracer properties and tracing approaches, please see Collins and Walling 75
(2004), Davis and Fox (2009), Guzmán et al. (2013), Haddadchi et al., (2013), and Koiter et al. (2013). 76
The choice of discriminant properties is often guided by the sources supplying sediment. For 77
example, fallout radionuclides discriminate between surface and subsurface sources (Owens and 78
Walling, 2002; Smith and Dragovich, 2008). 137Cs (t1/2=30 years) is an artificial radionuclide, produced
79
by thermonuclear tests in the 1950s and 1960s, the Chernobyl accident that affected Northwestern 80
Europe in 1986 and the Fukushima Dai-ichi Nuclear Power Plant accident in 2011. Radiocesium is 81
strongly bound to fine particles (He and Walling, 1996). In undisturbed soil profiles, 137Cs 82
concentrations are the highest at the surface before decreasing exponentially with depth (Mabit et 83
al., 2008; Olley et al., 2013). Accordingly, sediment originating from the soil surface or the ploughed 84
layer will contain higher 137Cs concentrations compared to sediment originating from subsurface 85
sources (e.g. channel bank and gully erosion) which will be depleted in 137Cs. Therefore, it is possible 86
3 to quantify the relative contribution of surface and subsurface sources by modeling 137Cs soil and 87
sediment concentrations (Caitcheon et al., 2012; Olley et al., 2013). 88
In comparison, strontium isotopes (87Sr/86Sr) were shown to be effective tracers of water, soil,
89
sediment and biological material in the environment as they are not fractionated by chemical or 90
biological processes (Aberg, 1995; Graustein, 1989). The abundance of 87Sr produced by the 91
radioactive decay of 87Rb (expressed as the 87Sr/86Sr ratio) varies with rock type and its formation age 92
(Négrel and Roy, 1998; Yasuda et al., 2014). Accordingly, strontium isotopic ratios reflect catchment 93
lithology and thus they have been used to trace the geological sources of soils, suspended particulate 94
matter and riverine water in catchments (Faure, 1986). 95
Strontium isotopic ratios have mainly been measured in the dissolved load (Gaillardet et al., 1997; 96
Grosbois et al., 2000; Pande et al., 1994) to identify and quantify chemical weathering fluxes in major 97
rivers (e.g. the Amazon, Congo, Garonne, Indus, Loire, Rhine Rivers catchments) and to provide 98
information about surface and subsurface water circulations (Bakari et al., 2013; Brenot et al., 2008; 99
Eikenberg et al., 2001; Petelet-Giraud et al., 2007), water-rock interactions (Aubert et al., 2001; Blum 100
et al., 1994) or seawater dynamics (Jørgensen et al., 2008). Strontium isotopic ratios were also 101
measured in suspended matter to identify the sources of particles transported in the ocean (Asahara 102
et al., 1999; Goldstein and Jacobsen, 1988), in estuarine (Douglas et al., 2003; Smith et al., 2009) and 103
fluvial systems (Asahara et al., 2006; Douglas et al., 1995; Négrel and Grosbois, 1999; Viers et al., 104
2000; Wasson et al., 2002). Despite their use in investigations of particulate material dynamics at 105
large catchment scales, few studies investigated spatial and temporal variations of sediment sources 106
with strontium isotopic ratios in small agricultural catchments (<50 km²). Small catchment scale 107
research is important for improving our understanding of the impact of land use and farming practice 108
changes on sediment dynamics. 109
In this study, sediment sources are identified and quantified through the combination of 137Cs and 110
87
Sr/86Sr ratio measurements on soil and sediment collected in the Louroux catchment (24 km²- Loire 111
River basin, France), representative of drained, lowland, cultivated areas of Northwestern Europe. 112
The Louroux pond, at the catchment outlet, is significantly impacted by sedimentation from 113
increased sediment yields. Intense modifications in agricultural practices and land use in the 114
catchment resulted in the excessive transport of fine sediment that was predominantly deposited in 115
the Louroux pond. Fine sediment also transfers particulate-bound nutrients and contaminants and 116
degraded water quality. As water quality may be directly impacted by this excess supply of sediment 117
in this catchment, research is required to better understand sediment source dynamics in order to 118
meet the requirements of the EU Water Framework Directive. 119
In this agricultural catchment, sediment surface sources were defined as topsoil material eroded 120
from the cropland whereas subsurface sources were defined as material eroded from channel banks. 121
Surface sources were shown to dominate (99 ± 1%) the supply of suspended matter transiting this 122
catchment’s rivers during flood events in 2013 (Foucher et al., 2015). However, the dominance of 123
surface source contributions to sediment deposited throughout the pond and over a longer temporal 124
period requires further investigation. Furthermore, information on the main spatial sources of 125
sediment in the Louroux pond is required. To investigate spatial and temporal variations in sediment 126
sources, 137Cs concentrations and 87Sr/86Sr ratios were measured to estimate the relative 127
contributions of surface, subsurface and lithological sources to multiple short sediment cores (i.e. < 128
10 cm) sampled throughout the Louroux pond as well one long sediment core (i.e. 1.1 m) sampled in 129
the central pond depression. 130
4
2
Material and methods
131
2.1 Study site 132
The Louroux catchment (24 km²) is a small agricultural lowland basin with elevation ranging between 133
99 and 127 m and a mean slope of 0.4 %. The climate is temperate oceanic with a mean annual 134
rainfall of 696 mm (Tours, data from Météo France, 2015). Cropland is the main land use (78%) 135
followed by grassland (18%) and woodland (4%) (Corine Land Cover 2006 data). According to a 136
geological survey, the lithology consists of post-Helvetian sand and continental gravels (32%), 137
Senonian flint clays (23%), Quaternary loess (18%), Helvetian shelly sands (18%), Ludian Touraine 138
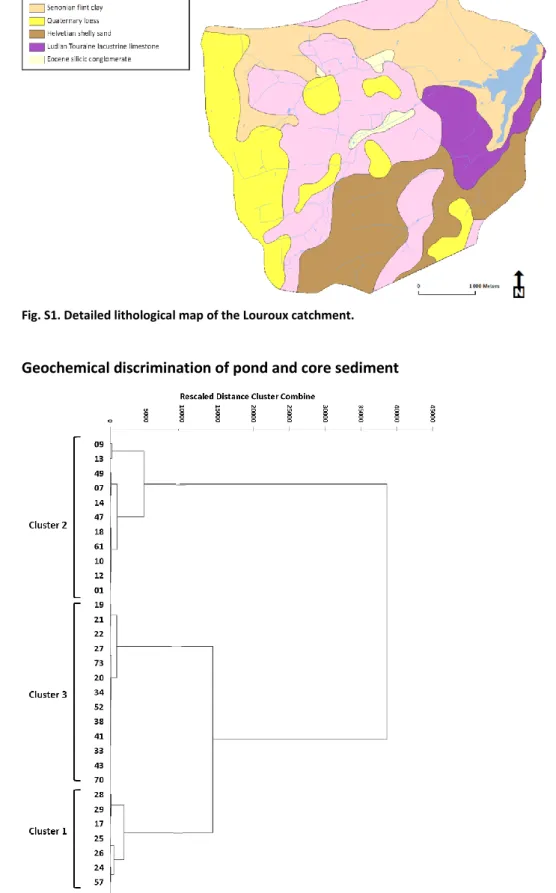
lacustrine limestones (6%) and Eocene silicic conglomerates (2%) (Fig. S1) (Rasplus et al., 1982). 139
These lithologies were regrouped in two classes (Le Gall et al., under review): a southern carbonate 140
area composed of Touraine Lacustrine limestone and shelly limestone, and a northern non-carbonate 141
grouping of the remaining lithologies (Fig. 1a). 142
143
Fig. 1. Map of the Louroux catchment in the Loire River basin (France) along with the simplified lithological map of the 144
area (Le Gall et al., under review) (a) and the locations of surface and subsurface source (b), pond and core sediment (c) 145
samples location. N and S correspond to the northern and southern inlets of the main tributaries. 146
In the Louroux catchment, land consolidation started in the 1950s. Channels were created and others 147
modified. More than 220 tile drain outlets were installed to drain soils and facilitate intensive crop 148
farming. As a result, soil erosion and sediment fluxes strongly increased, contributing to the siltation 149
of the river network, the Beaulieu pond (3 ha – nearly filled), and the Louroux pond (52 ha) (Fig. 1c). 150
Foucher et al. (2014) showed that terrigeneous inputs to the Louroux pond reached maximum rates 151
of 2100 t km-² yr-1 between 1945 and 1960, before decreasing to lower rates (90-102 t km-² yr-1) since 152
2000. 153
5 2.2 Sampling
155
2.2.1 Soil and channel bank sampling 156
Soil and channel bank samples were collected between January 2013 and April 2014. Sampling 157
concentrated on cropland, as soil erosion was shown to be negligible under grassland and forest in 158
similar environments (Cerdan et al., 2010). Surface sources (n=36) were collected by scraping the top 159
2-3cm layer of soil and subsurface sources (n=17) by scraping a 2-3cm layer of the sidewall from 160
eroding channel banks (Fig. 1b). Each of these surface and subsurface source samples was composed 161
of five sub-samples. A plastic spatula was used to collect samples and avoid potential metal 162
contamination. 163
2.2.2 Louroux Pond sediment sampling 164
Surface samples of deposited pond sediment (n=41) were collected in September 2012 using a 165
floating platform and a short (top 0-10 cm) gravitational corer UWITEC (Ø 90mm) during a period of 166
low water level (see graphical abstract). Attention was paid to collect the most recent deposits 167
following a random location sampling technique. A longer sediment core was collected in the central 168
depression of the pond (1.10 m length) in March 2013, at the confluence between the Grand Bray 169
and Beaulieu streams (Fig. 1c). The sediment core was dated in a previous study using an age depth 170
model based on fallout radionuclide measurements (137Cs and 210Pbxs) (Foucher et al., 2014). In the
171
remainder of the text, dates attributed to the successive sediment core layers are used to facilitate 172
the interpretation of the core results. Carbonate outcrops (n=3), shelly sand (n=1), and three types of 173
fertilizers (N, 33.5/ P.K, 25-25/ N.P.K, 15-15-15) commonly used by farmers in this catchment were 174
also sampled to characterize their strontium isotopic signatures. 175
176
2.3 Sample processing and laboratory analysis 177
2.3.1 Gamma spectrometry measurements 178
Soil (n=36), channel bank (n=17) and sediment (n=41) samples were dried at 40°C and sieved to 2 179
mm before analysis. For radionuclide measurements, approximately 80 g of material was analyzed. 180
137
Cs (662 keV) activities were determined by gamma spectrometry using low background N and P 181
type GeHP detectors (Canberra and Ortec) at the Laboratoire des Sciences du Climat et de 182
l’Environnement. Measured activities were decay-corrected to the sampling date and provided with 183
2σ-errors. Th concentrations (mg kg-1) were calculated from 228Th activity concentrations. Assuming 184
that 232Th and it daughter products were in secular equilibrium, 228Th activities were calculated using 185
the average between the gamma rays of two of its daughter products, 212Pb (239 keV) and 208Tl (583 186
keV). Counting efficiencies and reliability were conducted using certified International Atomic Energy 187
Agency (IAEA) standards (IAEA-444, 135, 375, RGU-1 and RGTh-1) prepared in the same containers as 188
the samples. Uncertainties on radionuclides activities were ca. 5% for 228Th, and up to 10% for 137Cs. 189
Based on 228Thactivities, the total Th concentration (mg kg-1) of sediment samples was calculated 190
using the universal law of radioactive decay. 191
192
2.3.2 Thorium particle size correction for 137Cs activities 193
As 137Cs is strongly bound to fine particles, potential particle size differences between sources and 194
sediment may prevent their direct comparison. To avoid errors in the estimation of source 195
contributions, the impacts of particle size on sediment properties must be carefully addressed. As an 196
6 alternative to a specific surface area (SSA) derived correction, a thorium correction was effectively 197
applied by Foucher et al. (2015) in the Louroux pond catchment. These authors demonstrated that 198
thorium-corrected particle size corrections produced globally better results compared to SSA 199
corrections in this catchment. 200
The Th correction factor was calculated based on the variations of Th and 137Cs concentrations in 201
each sediment sample and each source sample (Eq. 1) compared to their mean Th and 137Cs 202
concentrations of the considered source. 203 (Eq. 1)
where [Th]i and [137Cs]i are the respective thorium and cesium concentration of each individual
204
sediment sample (i), and [Th]mean source(s) and [137Cs]mean source(s) are the respective thorium and cesium
205
concentrations of both surface and subsurface samples when applied to each sediment sample while 206
[Th]j and [137Cs]j are the respective thorium and cesium concentrations of each individual source
207
sample (j) (i.e. surface or subsurface samples) and [Th]mean source(s) and [137Cs]mean source(s) are the
208
respective thorium and cesium mean concentrations of each source when respectively applied to 209
surface and subsurface samples. Corrected 137Cs concentrations were calculated by dividing each 210
measured 137Cs concentration of each individual sample by the associated Th correcting factor. 211
2.3.3 Geochemical measurements 212
A selection of 31 surface sediment samples and 20 core sediment samples were analyzed for 213
strontium isotopes. As recommended in several sediment fingerprinting studies (Collins and Walling, 214
2002; Motha et al., 2003; Tiecher et al., 2015; Walling et al., 2000), geochemical measurements were 215
performed on the <63 µm fraction of material, obtained by dry-sieving. Sieving samples to the <63um 216
fraction theoretically allows for a more direct comparison between sediment and potential sources 217
elemental concentrations, as it is assumed that this size fraction corresponds to the bulk of the 218
sediment. 219
Mineralization and selective extraction of the “exchangeable and carbonate” fraction
220
Details of the mineralization of source, sediment, carbonate rocks and fertilizer samples are given in 221
Supplementary Material. Approximately 100 mg or 125 mg of material was dissolved by the 222
successive addition of HF (47-51%), HClO4 (65-71%), HCl (34-37%) and HNO3 (67%) in closed Teflon
223
vessels on hot plates. Proportions of reagents used and durations varied according to the sample 224
nature. 225
Selective extractions using diluted acetic acid (F1 fraction of the BCR protocol) were performed to 226
characterize the 87Sr/86Sr signature and composition of the exchangeable/carbonate fraction of 227
sediment samples (Pueyo et al., 2001). Selective extractions of the exchangeable and carbonate 228
phase (F1) were performed to evaluate the amount of calcium extracted and to characterize the 229
87
Sr/86Sr signature of the exchangeable/carbonate fraction of sediment samples. This fraction 230
corresponds to the metals affected by sorption and desorption effects (bound to particles) and/or 231
(the elements) associated with carbonates. The selective extraction procedure was adapted from the 232
BCR protocol (Rauret et al., 1999). 20 mL of a solution of acetic acid (0.11 mol L-1) was added to 233
approximately 500 mg of sediment in a centrifuge tube and was shaken for 16 h at room 234
7 temperature. The extractant solution was separated from the residue by centrifugation (4000 rpm 235
min-1 during 20 minutes) and stored at 4°C before analysis. Reproducibility of the extraction was 236
controlled through triplicate analyses of core sediment samples (n=8). These sediment samples were 237
selected to cover the 87Sr/86Sr ratio variations observed in the <63 µm fraction of all core sediment 238
samples. Results will be presented as the average strontium concentrations and 87Sr/86Sr ratios 239
measured for each triplicate. 240
Elemental concentrations and strontium isotopic analyses
241
Major and trace element concentrations (Na, Mg, K, Ca, Rb, Sr, Zn) were analyzed in mineralized 242
solutions using an inductively coupled plasma quadrupolar mass spectrometer (ICP-QMS) (X-Series, 243
CCT II+ Thermoelectron, France). Internal standards (Re, Rh and In; SPEX, SCP Science, France) were 244
used to correct for instrumental drift and plasma fluctuation. To limit interference, analysis was 245
performed using a collision cell technology (CCT) which introduces a supplementary gas mixture of H2
246
(7%) and He (93%) for the determination of Zn, Rb, and Sr concentrations. 247
A certified river water sample (SRM 1640a, NIST, Gaithersburg, USA) was used to control the ICP-MS 248
calibration. The overall quality of ICP-MS measurements was controlled by analyzing a certified lake 249
sediment material (IAEA lake sediment SL1). These standards were checked routinely during analysis 250
(every 15-25 samples). Good agreement was observed between the data obtained and the certified 251
values (n=91 for SL-1 measurements). In the particulate compartment, analytical uncertainties did 252
not exceed 10% (except for Ca, with a maximum analytical error of 13%). 253
Chemical separation of strontium from rubidium and calcium was performed using a cation-exchange 254
procedure. More details are given in Supplementary Material. 87Sr/86Sr ratios were determined using 255
a Thermo Finnigan Neptune-Plus Multi-collector Inductively Coupled Plasma Mass Spectrometer 256
(MC-ICP-MS). The purified strontium fractions were diluted with 0.5N HNO3, adjusting the strontium
257
concentration to 20 µg/L. The reproducibility of the 87Sr/86Sr ratio measurements was evaluated 258
through replicate analyses of the NBS 987 standard. An average value 0.710306 ± 10x10-6 (2σ, n=92) 259
was obtained. Ratios were normalized to the NBS 987 standard value of 0.710245. 260
261
2.4 Mineralogical characterization (SEM-EDS and X-ray diffraction) 262
The mineralogy of a selection (n=7) of surface and core sediment was characterized by scanning 263
electron microscopy (SEM) at Geosciences Paris Sud (GEOPS). Thin sections of powdered material 264
were mounted on a carbon sample-holder, coated with carbon and observed with a Phenom ProX 265
scanning electron microscope using an accelerating voltage of 15keV coupled with an X-ray energy 266
dispersive spectral analyzer for element discrimination. 267
In addition, core sediment was characterized by X-ray diffraction (XRD) using Cu Kα radiation on 268
powdered core samples. Diffractograms were recorded from 4° to 80° 2θ, under a voltage of 45kV 269
and an intensity of 40mA using a PANalytical X’Pert PRO diffractometer. 270
These mineralogical analyses were performed to provide information about the potential occurrence 271
of eutrophication processes in the pond and to check for the presence of calcite in sediment samples. 272
Sediment samples were selected depending on 87Sr/86Sr ratios and calcium concentrations previously 273
measured to cover their range of variation. 274
8 2.5 Source discrimination
276
Cluster analyses were performed to test the similarity or differences between sediment samples and 277
classify them into individual categories. A hierarchical cluster analysis (HCA) combined with 278
geochemical observations was used to discriminate between sediment samples according to the 279
lithologies of the delineated carbonate and non-carbonate subcatchments (Fig. 1). Clustering 280
analyses were performed with XLstat using the Ward-algorithmic method and the distance between 281
two clusters was defined as the Euclidean distance. 282
A non-parametric test was used to examine similarities and differences between sediment samples. 283
The Mann-Whitney U-test was used to determine the ability of 87Sr/86Sr ratios and strontium 284
concentrations to provide a significant discrimination between pond sediment samples at a 285
significance level of p<0.05 (Laceby et al., 2015a; Walling, 2005). 286
287
2.6 Distribution modeling 288
A distribution mixing model was used to quantify the relative contributions of sources to sediment 289
(Caitcheon et al., 2012; Foucher et al., 2015; Laceby and Olley, 2014). For 137Cs, a binary mixing model 290
incorporating distributions was used: 291
(Eq. 2)
where A and B are the modeled distributions of 137Cs in surface and subsurface sources respectively, 292
C is the 137Cs distribution in sediment and x is the relative contribution of the surface sources (A). x is 293
modeled as a truncated normal distribution (0≤x≤1) with a mixture mean (μm) and a standard
294
deviation (σm).
295
As stable isotopes do not mix linearly and are dependent of their elemental concentrations (Laceby 296
et al., 2015b; Phillips and Koch, 2002), a different equation was used to model source concentrations 297
87
Sr/86Sr ratio to incorporate their concentration dependency: 298 (Eq. 3)
where Er is the elemental strontium concentration in the suspended sediment, Es is the elemental 299
strontium concentration in source (s), Rr is the strontium isotopic ratio in the suspended sediment, Rs
300
is the strontium isotopic ratio in sources (s), xs is the modelled proportional contribution of sources
301
(s); and MMD is the mixing model difference. Absolute values (ABS) are summed in Equation 3. 302
Non-negative constraints were imposed and normal distributions were modeled for all distributions. 303
Pond and core sediment samples were individually modeled with their analytical error substituted as 304
a standard deviation to model a normal distribution around each of the individual sediment samples 305
(Evrard et al., 2016; Wilkinson et al., 2015). 306
Source contributions were determined with the Optquest algorithm in Oracle’s Crystal Ball Software 307
(see Laceby and Olley (2014)). To determine one optimal source contribution, the µm and σm for each
308
source’s contribution distribution (x or xs) were randomly varied during the equation solving process 309
while minimizing the median difference between both sides of Eq. 2 and the MMD in Eq. 3, and 310
simultaneously solving these equations 2500 times with 2500 random samples (Latin Hypercube - 311
500 bins) drawn from each sediment and source distribution. This model simulation and solving 312
9 process was then repeated 2500 times. The median proportional source contribution (x or xs) from 313
these 2500 additional simulations is reported as the contribution from each source. 314
Model uncertainty was determined by summing the modeled standard deviation (σm), the median
315
absolute deviation (MAD) of the modeled source contribution and the MAD of the modeled standard 316
deviation for the 2500 model simulations (Laceby et al., 2015a). Results (concentrations and 317
contributions) are presented using the notation ± to express the standard error associated to one 318
sample whereas the mean (µ) and standard deviation (σ) are used for groups of samples. 319
320
3
Results
321
3.1 137Cs concentrations in source and sediment samples 322
137
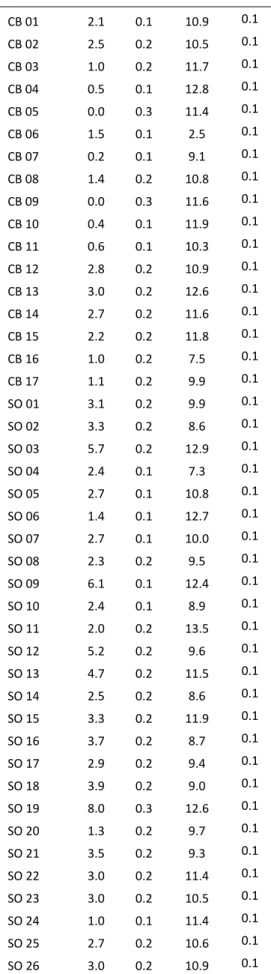
Cs activities in channel bank samples ranged from 0.0 to 3.0 Bq kg-1 (µ 1.4 Bq kg-1, σ 1 Bq kg-1). In 323
surface soil samples, activities varied between 1.0 and 8.0 Bq kg-1 (µ 3.3 Bq kg-1, σ 1.4 Bq kg-1). 324
Surface and subsurface sources were statistically different (p<0.0001). Sediment had higher 137Cs 325
concentrations than their potential source samples with activities varying between 1.2 and 23.1 Bq 326
kg-1 (µ 12.6 Bq kg-1, σ 5.5 Bq kg-1) for pond surface sediment and between 10.9 and 16.3 Bq kg-1 (µ 13 327
Bq kg-1, σ 2.4 Bq kg-1)for core sediment. 137Cs concentrations were only considered in sediment from 328
the top layers of the core, between 0 and 16cm of depth (n=5), to avoid disturbances from the input 329
of 137Cs from the Chernobyl accident which had peak activities at 29cm (Foucher et al., 2015) and 330
Fukushima 137Cs fallout inputs were shown to be negligible in France (Evrard et al., 2012). 331
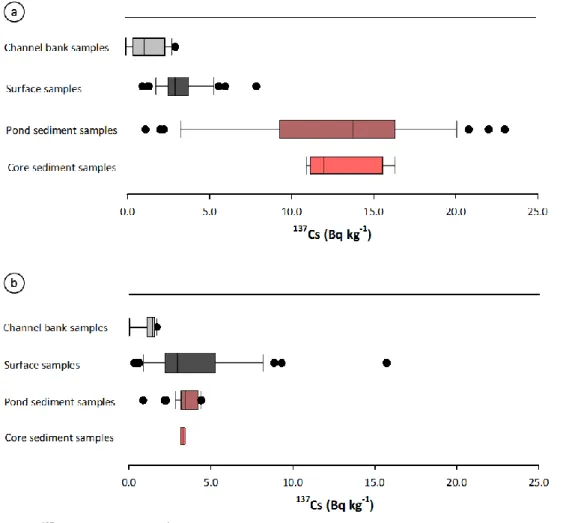
As pond and core sediment sample concentrations did not plot between the source concentrations, a 332
Th-based particle-size correction was applied (Fig. 2a). After the Th particle size correction, activities 333
in channel bank samples ranged between 0.0 and 1.7 Bq kg-1 (µ 1.2 Bq kg-1, σ 0.5 Bq kg-1), between 334
0.3 and 15.7 Bq kg-1 in surface samples (µ 3.8 Bq kg-1, σ 3.0 Bq kg-1), between 0.7 and 4.1 Bq kg-1 in 335
pond sediment samples (µ 3.2 Bq kg-1, σ 0.5 Bq kg-1) and between 3.1 and 3.4 Bq kg-1 in the upper 336
core sediment samples (µ 3.3 Bq kg-1, σ 0.1 Bq kg-1). The corrected sediment 137Cs concentrations 337
remained within the range of corrected concentrations found in their potential sources (Fig. 2b). 338
10 339
Fig. 2. 137Cs activities (Bq kg-1) in channel bank, soil, pond and core sediment samples before (a) and after (b) the Th 340
particle size correction (bold horizontal line = median, box extent = 25th percentiles, error bars = non-outlier range, black 341
dots = outliers). 342
3.2 Geochemical discrimination of potential sediment sources 343
There were large variations in sediment 87Sr/86Sr ratios, ranging from 0.710739 to 0.716864 (Table 344
S2) indicating contributions from different lithological sources. The highest values (0.713867 to 345
0.716761, n=8) were generally observed at the inlet of the stream draining the non-carbonate 346
subcatchment. In contrast, the lowest values (0.711595 to 0.712502, n=6) were found at the inlet of 347
the stream draining the carbonate subcatchment, except for one sample (0.711999) located at the 348
inlet of the non-carbonate subcatchment (Fig. 3a). Intermediate 87Sr/86Sr ratios with values between 349
these two end-members (ranging from 0.712151 to 0.714711) characterized sediment collected in 350
downstream sections of the pond (Fig. 3a). 351
11 353
Fig. 3. Spatial (a) and temporal (b) variations of 87Sr/86Sr ratios in pond and core sediment samples. N and S correspond 354
to the northern and southern inlets of the main tributaries respectively (a). 355
A hierarchical cluster analysis (HCA) based on 87Sr/86Sr ratios and strontium concentrations was 356
performed to examine potential sources of pond sediment (Fig. S2). Three main groups or clusters 357
were discriminated based on this analysis. 358
Samples from Cluster 1 (N°24, 25, 26, 28, 29, 17 and 57) are located at the inlet of southern 359
tributaries in the pond with the exception of two samples (N°17 and 57) located at the inlet of the 360
northern tributaries and in the downstream part of the pond. These sediment samples displayed the 361
lowest pond sediment signatures with 87Sr/86Sr ratios ranging between 0.711595 and 0.712316. 362
Samples from Cluster 2 (N°01, 07, 09, 10, 12, 13, 14, 18, 47, 49 and 61) had the highest 87Sr/86Sr 363
ratios, with values varying between 0.712466 and 0.716761. They are mainly located in the inlet of 364
the northern tributaries, with the exception of three samples (N°47, 49 and 61) located in 365
downstream areas of the pond. 366
Cluster 3 (N°19, 20, 21, 22, 27, 33, 34, 38, 41, 43, 52, 70 and 73) is composed of samples located close 367
to the inlet of the northern tributaries, in the middle and in the downstream areas of the pond. One 368
sample (27) located in the inlet of the southern tributaries is likely an outlier. These sediment 369
samples displayed 87Sr/86Sr ratios comprised between 0.712502 and 0.713467 and show 370
intermediate values compared to those grouped in Clusters 1 and 3. 371
When taking into account the location of the sediment samples in the pond, the 87Sr/86Sr signatures
372
and the lithologies drained by northern and southern tributaries, sediment samples from Cluster 1 373
can be defined as a southern/carbonate source (except 17 and 57 samples) whereas sediment 374
samples from Cluster 2 can be referred to as a northern/non-carbonate source (except 47, 49 and 61 375
12 samples). The remaining sediment samples (from Cluster 3 and those classified in Clusters 1 and 2 376
but located in the downstream section of the pond) were hypothesized to be derived from a mixture 377
of sediment originating from the two previously defined end-members. Scatter plots with 87Sr/86Sr
378
and elemental ratios (Rb/Sr, Ca/Sr, Mg/Sr, K/Sr, Na/Sr) were also used to confirm the discrimination 379
between these sediment sources (Fig. S3). Therefore, sediment samples collected in the two inlets 380
draining the carbonate and non-carbonate subcatchments were used to characterize the two main 381
potential sources of downstream pond sediment. 382
In addition to these two main sources, 87Sr/86Sr ratios were measured in carbonate rocks, shelly 383
sands and fertilizers. In the carbonate rocks, signatures varied between 0.707968 and 0.708789 while 384
the shelly sand signature reached a value of 0.709538. In fertilizers typically used in this catchment, 385
strontium isotopic ratios varied between 0.707877 and 0.716224. The N fertilizer had the highest 386
value (0.716224). However it was removed from further analysis owing to a very low Sr 387
concentration (0.5 mg kg-1). In P.K and N.P.K fertilizers, Sr ratios varied between 0.707877 and 388
0.709178 (Table S6). In addition, elevated zinc concentrations were measured in these samples (136 389
and 184 mg kg-1, respectively, see supplementary material). High zinc concentrations were also 390
observed in surface pond (with concentrations ranging between 67 and 124 mg kg-1) and core 391
sediment (Table S3 and Table S4). In the core, a progressive increase in zinc concentrations was 392
observed from the bottom (47 mg kg-1) to the top (102 mg kg-1). 393
394
3.3 Temporal variations of 87Sr/86Sr ratios in core sediment samples 395
In the Louroux sediment core, 87Sr/86Sr ratios ranged from 0.710739 to 0.716864 (Fig. 3b). The lowest 396
87
Sr/86Sr ratio (0.710739) was observed in 1955, on the bottom of the core. From 1956 to 1976, 397
87
Sr/86Sr ratios tended to increase to a maximum of 0.716864. Then, from 1976 to 1986, 87Sr/86Sr 398
ratios decreased until they stabilized with values ranging between 0.712318 and 0.712900 from 1986 399
to 2013 (Fig 3b). Strontium isotopic signatures in core sediment samples have the same range of 400
variations as those observed in pond sediment samples. 401
402
3.4 Mineralogical characterization and selective extraction performed on selected core 403
and pond sediment samples 404
XRD analyses indicated the presence of calcite in all core sediment samples, with contributions 405
varying between 10 and 32% (Table S1). SEM micrographs confirmed the presence of calcite in the 406
sediment samples. The calcite was well precipitated, partially precipitated and potentially associated 407
with clays depending on the samples (Fig. S4f, Fig S4a-b-c-d-g-h and Fig. S4a-b-c-d-i, respectively). 408
Furthermore, silica tubes and diatoms were observed in two core sediment samples (Fig. S4e and g, 409
respectively). 410
Between 1955 and 1963, the proportion of strontium contained in the exchangeable and carbonate 411
fraction (F1) oscillated between 56 and 73%, the lowest proportion being observed on the bottom of 412
the core. The lowest F1 fraction of the entire sequence (43%) was observed in 1976, before 413
increasing to reach a stable state between 1986 and 2005 with a F1 fraction ranging between 68 and 414
73% (Fig. 4a). 415
Between 1955 and 2005, the proportion of calcium contained in the F1 fraction increased from 62% 416
to a maximum of 90%. The highest contributions were observed between 1976 and 2005 (Fig. 4b). 417
87
Sr/86Sr ratios measured in the F1 fraction increased from 1955 to 2005, following the same trends 418
13 as calcium in this fraction (Fig. 4). The two lowest 87Sr/86Sr ratios (0.709216 and 0.709236) were 419
observed in 1955 and 1957. A strong increase was observed from 1957 to 1976, and stable ratios 420
(0.709380 to 0.709395) occurred between 1986 and 2005, when the stabilization of the F1 fraction 421
was observed. 422
87
Sr/86Sr ratios plotted between the signatures of the carbonate rocks, the fertilizers and the shelly 423
sand, suggesting a potential impact of all these sources on the isotopic signature of the core 424
sediment samples (Fig. 5). Sediment sources were thus modeled following a tributary tracing 425
approach (Laceby et al., 2015a; Vale et al., 2016). With this approach, pond sediment samples from 426
inlets of the two main tributaries were modeled as the two main lithological sources (carbonate and 427
non-carbonate) to downstream pond sediment and the sediment core. The potential influence of 428
carbonate rocks, shelly sands, fertilizers, and eutrophication is incorporated within these two 429
tributary sources with this sediment-based sampling approach for surface pond sediment. 430
431
Fig. 4. Strontium (a) and calcium (b) partitioning in core sediment between two defined fractions F1 (exchangeable and 432
carbonate fraction) and F2 (residual fraction) and 87Sr/86Sr ratios measured in the fraction F1. 433
434
Fig. 5. 87Sr/86Sr ratios variations in carbonate rocks, shelly sand, fertilizers and the exchangeable/carbonate fraction of 435
core sediment samples. 436
437
3.5 Modeling results 438
3.5.1 Spatial variations of sediment sources in the pond 439
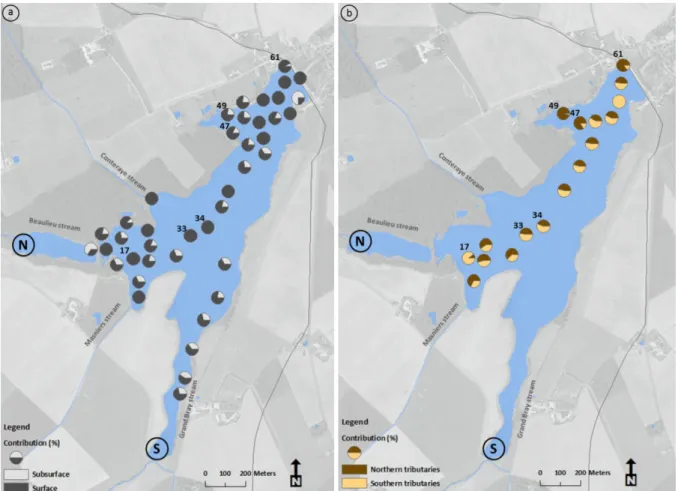
Surface sources dominated the supply of sediment to the pond (µ 82%, σ 1%). Surface source 440
contributions varied between 26 ± 1% and 100 ± 4%, and fifteen sediment samples were modeled to 441
be derived exclusively from surface sources (Fig. 6a). Samples characterized by a significant 442
contribution from subsurface sources were mainly located at the inlet of the two main tributaries 443
(the Beaulieu and Grand Bray streams, with contributions of the channel banks varying between 12 ± 444
1% and 67 ± 1%) or near pond banks in the downstream section of the pond with contributions 445
varying between 7 ± 2% and 75 ± 1%. 446
14 Mixing model results using pond sediment samples from the inlet of the two main tributaries as 447
subcatchment sources indicated that the carbonate tributary supplied between 4 ± 1% and 100 ± 1% 448
of downstream sediment in the pond (µ 48, σ 1%) (Fig. 6b). One sediment sample (N°17) located in 449
the inlet of the non-carbonate tributary had a high carbonate contribution of 89 ± 1%. In the central 450
part of the pond, sources contributions were well balanced with the carbonate tributary inputs 451
ranging between 52 ± 1% and 56 ± 1%. In the downstream area of the pond, the carbonate tributary 452
contributions were more variable, with the lowest and the highest contributions observed in this 453
well-mixed section. 454
455
Fig. 6. Contribution of the surface and subsurface sources (a) and of the carbonate and non-carbonate sources (b) to the 456
surface sediment collected in the Louroux pond. N and S correspond to the northern and southern inlets of the main 457
tributaries. 458
3.5.2 Temporal variation of sediment sources in the core 459
Modeling results indicate that during the last 17 years, surface sources supplied the majority of core 460
sediment, with a mean contribution of 89 ± 3% (Fig. 7b). Overall, contributions varied between 80 ± 461
3% and 96 ± 5%. Between 1999 and 2001, a slight increase in the surface source contribution was 462
observed with values increasing from 86 ± 1% to 96 ± 5% before decreasing again between 2009 and 463
2013 to values between 80 ± 3% and 83 ± 1%. As previously indicated, 137Cs concentrations were only 464
considered in the top 0-16cm to avoid disturbances from the input of 137Cs from the Chernobyl 465
accident recorded at 29cm (Foucher et al., 2015). Accordingly, contributions were not estimated 466
below a depth of 16cm. 467
Between 1955 and 1957, high variations in sediment spatial sources were observed (Fig. 7a). In 1955, 468
sediment exclusively originated from the southern/carbonate tributary (100 ± 1%). Then, dramatic 469
changes were observed with a dominant contribution from the northern/non-carbonatelcareous 470
tributary (96 ± 4%) in 1956. The main source changed again, with the dominance of the 471
15 southern/carbonate tributary (89 ± 2%) in 1957. From 1957 to 1981, the contribution of the 472
northern/non-carbonate tributary progressively increased to a maximum contribution of 100 ± 13%. 473
Then, between 1981 and 1986, these contributions decreased to reach a stable state in the upper 474
part of the core (0-31cm of depth) where the northern/non-carbonate tributary contributed 475
between 30 ± 1% and 47 ± 1% of sediment from 1986 to 2013. 476
477
Fig. 7. Evolution of the lithological (a), surface and subsurface (b) sediment sources contributions and 87Sr/86Sr ratios 478
along the sediment core (error bars reflect the modelling standard deviation for each sediment sample). 479
480
4
Discussion
481
4.1 Surface and channel bank source contributions 482
Surface soils were identified as the main source of surface pond sediment. This result is consistent 483
with the observations of Foucher et al. (2015) for suspended sediment collected during flood events 484
upstream of the Louroux pond. They showed that virtually all the sediment originated from the soil 485
surface (µ 98%, σ 2%). However, during low flow periods, they found that suspended sediment 486
transiting the river network had elevated subsurface source contributions (µ 60%, σ 2%) (Foucher et 487
al., 2015). In this current research, subsurface contributions to pond sediment were shown to be 488
significant in areas located in the inlets of the main tributaries close to the pond banks (with 489
contributions ranging between 12 ± 1% and 67 ± 1%). In the rest of the pond, surface sources 490
dominated (µ 86%, σ 1%). The potential erosion of the banks of the pond may also explain the 491
significant contributions of the subsurface source observed near the pond banks and in the 492
16 downstream section of the pond, simply owing to their proximity, or possibly smaller tributaries 493
draining into these locations (e.g. N°47, 49). 494
In the sediment core, there were also subsurface contributions (maximum contribution of 20 ± 3%). 495
These contributions remained stable (µ 11%, σ 3%), indicative of an ongoing channel bank sediment 496
source contribution, though less than what Foucher et al. (2015) modeled for the low-flow conditions 497
in 2013. Overall, channel bank contributions to the pond and core sediment were similar (µ 18%, σ 498
1% and µ 11%, σ 3% respectively). In fact, the core sediment mean subsoil contribution between 499
2009 and 2013 (18%) was equivalent to the mean subsoil contribution for the pond sediment. These 500
results suggest that although surface sources dominated sediment supply to the pond during the last 501
seventeen years, channel bank contributions should not be neglected. 502
503
4.2 Tributary contributions to pond sediment 504
Modeling results based on 87Sr/86Sr ratios indicate that the southern/carbonate and northern/non-505
carbonate tributary contributions to pond sediment were nearly equivalent (µ 48%, σ 1% and µ 52%, 506
σ 3% respectively). Over the last seventeen years, both tributaries contributed in stable proportions 507
to sediment sampled in the core (µ 64%, σ 1% for the southern/carbonate tributary). 508
The southern tributaries drain most of the carbonate substrates that only cover 24% of the 509
catchment surface area and their derived sediment were modeled to contribute more than half of 510
the downstream pond sediment. Therefore, this research implies that the southern/carbonate area 511
supplied disproportionately more sediment to the pond than the northern/non-carbonate area. 512
One sediment sample (N°17) located in the inlet of the non-carbonate tributary was shown to mainly 513
originate from the carbonate area (89 ± 1%). Field observations indicated that crushed limestone was 514
used to stabilize channel banks in that section of the pond and a mix of sediment and this limestone 515
may have been sampled at that location. Three sediment samples (N°47, 49 and 61) located in the 516
downstream section of the pond were statistically classified as northern/non-carbonate (Cluster 3). 517
Field observations revealed that ephemeral tributaries draining flint clay substrate areas flow into 518
the pond at these locations, which may explain their classification as northern/non-carbonate 519
sediment. 520
Model results obtained from the core samples demonstrate high variations in lithological sources 521
from 1955 to 2013. The variations are likely related to the spatial evolution of the land consolidation 522
and river design schemes implemented in the catchment since the 1950s. The drastic changes in 523
source contributions observed between 1955 and 1957 could be interpreted as the response to a 524
large-scale phase of land consolidation in 1955 (Foucher et al., 2014). The increasing contribution of 525
the northern/non-carbonate tributary from 1957 to 1981 may be directly related to the 526
implementation of a dense drainage network, the creation of ditches, and the removal of hedges in 527
this northern/non-carbonate area. From 1981 until 1986 the contribution of the carbonate tributary 528
increased and then reached a relatively steady state between 1986 and 2013, with calcareous 529
tributary contributions fluctuating between 53 ± 1% and 70 ± 1%. The Beaulieu pond, located directly 530
upstream of the Louroux pond and currently almost filled sediment, could act as a buffer, reducing 531
the sediment contributions from the northern/non-carbonate tributary to downstream Louroux 532
pond sediment. 533
87
Sr/86Sr ratios, calcium and strontium concentrations (Table S5) were measured in the exchangeable 534
and carbonate fraction of a selection of core sediment samples to provide information on the 535
17 biological and chemical processes that may have occurred in the Louroux pond. Results indicated 536
that the carbonate fraction (F1) in the core sediment increased between 1955 and 2005 and had a 537
maximal contribution since 1976. This may be related to higher amounts of carbonates precipitated 538
in the pond during this period, which confirms previous findings showing the occurrence of a 539
progressive eutrophication of the pond. This is confirmed by the presence of algae typical of 540
eutrophic environments and the increase of autochthonous material, with contributions estimated 541
between 44 and 50% (Foucher et al., 2014). These observations are also consistent with the results of 542
XRD and SEM analyses. 543
Well crystallized calcite was exclusively observed on the bottom of the core (Fig. S4f) during a period 544
that occurred before the implementation of land consolidation programs in the catchment. In 545
contrast, partially precipitated calcite, which is potentially easier to extract, was observed on top of 546
the core, suggesting the occurrence of in situ precipitation. Previous studies conducted in the Loire 547
River (France) observed authigenic calcite precipitation during low flow in summer (Négrel and 548
Grosbois, 1999). In addition, it has been demonstrated that under temperate climates, calcite 549
precipitation can be directly related to inputs of nutrients and thus to primary production (Hamilton 550
et al., 2009). Strontium contributions in the F1 fraction did not follow exactly the same trend as 551
calcium contributions, with a slight shift towards higher ratios in the most recent sediment. This 552
suggests that strontium sources of the carbonate fraction evolved through time and did not 553
exclusively originate from lithological carbonates. Additional sources as fertilizers may potentially 554
explain strontium variations in the carbonate fraction. 555
556
4.3 Implications for sediment tracing, catchment management and future studies 557
The tributary tracing approach may be a useful approach to addressing potential eutrophication, 558
anthropogenic inputs (fertilizers) and in situ precipitation when using 87Sr/86Sr ratios for tracing 559
sediment in agricultural catchments. In particular, fertilizers are known to be a major source of 560
contaminants (Zn, Cu, Cd, Pb and Ni) in agricultural soils (Nziguheba and Smolders, 2008) and erosion 561
of these contaminated soils may lead to the deterioration and eutrophication of water bodies (Otero 562
et al., 2005; Vitoria et al., 2004). Furthermore, strontium concentrations may vary between 10 and 563
4500 mg kg-1 in phosphate fertilizers (Otero et al., 2005). Although 87Sr/86Sr fractionation in ecological 564
systems is negligible, the redistribution and accumulation of strontium originating from fertilizers in 565
soils may contribute to changes in their isotopic signatures (Borg and Banner, 1996). As an example, 566
Hosono et al. (2007) indicated that 25% of the dissolved Sr was derived from fertilizers in rivers 567
draining a Japanese agricultural catchment. In the Louroux catchment, P.K and N.P.K fertilizers were 568
characterized by high zinc concentrations. Similarly, high Zn concentrations were measured in 569
surface pond sediment and in core sediment since 1983. 87Sr/86Sr ratios measured in the mobile 570
fraction (F1) of core sediment were between the signatures of carbonate rocks and shelly sands and 571
the signature of the P.K fertilizers. These results suggest that fertilizers have impacted sediment 572
composition in this catchment since the beginning of the 1980s. 573
The potential impact of these fertilizers on sediment and source soil properties resulted in the need 574
to adopt a tributary tracing approach in this current research. This approach directly incorporates 575
fertilizers and other potential influences on 87Sr/86Sr ratios when tracing the source of downstream 576
sediment in the Louroux Pond. Although the sediment core 87Sr/86Sr ratios plotted within the 577
tributary source range, it would be useful for future research to compare 3-5 sediment cores of 578
equivalent length, sampled in each tributary, to sediment cores downstream in order to 579
18 comprehensively investigate tributary 87Sr/86Sr source ratios and variations over an equivalent 580
temporal period. 581
Importantly, these results demonstrate the need to better manage cultivated soils. Land 582
consolidation schemes, modifications in farming practices and in catchment management were 583
shown to have a strong impact on spatial variations of the main sources of sediment. To date, 584
sedimentary archives were mainly collected in lacustrine environments to reconstruct historical 585
sediment fluxes related to environmental changes over longer periods (typically the Holocene 586
period). However, they were mostly collected in mountainous environments (Arnaud et al., 2012; 587
Chapron et al., 2002; Simonneau et al., 2013). Sediment cores were also used to reconstruct 588
concentrations of various contaminants in sediment with time in a large number of rivers of the 589
world (Barra et al., 2001; Bertrand et al., 2013; Elbaz-Poulichet et al., 2011; Rawn et al., 2001). This 590
current approach, combining radionuclide and isotopic geochemical measurements to pond 591
sediment cores, provides important information on sediment source evolution in agricultural lowland 592
catchments in relation to changes in land use and agricultural practices. 593
594
5
Conclusions
595
A targeted fingerprinting approach that combined fallout radionuclides (137Cs), including a thorium-596
based particle size correction, and strontium isotopic geochemistry (87Sr/86Sr) was used to examine 597
spatial and temporal variations of sediment sources in a lowland, drained agricultural catchment. A 598
within-pond tributary tracing approach was developed to mitigate the potential influence of 599
eutrophication, anthropogenic inputs (fertilizers) and in situ precipitation. This research 600
demonstrated the utility of coupling radionuclides and strontium isotopic geochemistry to quantify 601
sediment sources and collecting sediment in pond tributary inlets to use as a source surrogate to 602
trace the origin of sediment sampled downstream. 603
Surface sources dominated the Louroux pond sediment supply (µ 82%, σ 1%). The tributaries draining 604
both the carbonate and the non-carbonate subcatchments contributed approximately half of the 605
surface pond sediment. In contrast, large fluctuations of these tributary contributions were modeled 606
from the analysis of a sediment core. These variations likely reflect the spatial pattern of the land 607
consolidation scheme implemented in this catchment that started in the 1950s. 608
This research demonstrates the utility of using sediment archives to reconstruct the impact of large 609
scale catchment modifications on sediment dynamics. Further analysis of sediment draining 610
agricultural areas should be encouraged to improve our understanding of erosion processes that 611
occurred in these environments. Understanding past impacts of land management on soil erosion 612
and sediment dynamics is fundamental to improving future best management practices in 613 agricultural catchments. 614 615 616 617 618
19
Acknowledgements
619
The authors would like to thank Louise Bordier for technical assistance with ICP-MS measurements, 620
Serge Miska for XRD analyses and Julius Nouet for SEM analyses. This work received financial support 621
from the Loire-Brittany Water Agency (in the framework of the Tracksed and Drastic research 622
projects, under the close supervision of Xavier Bourrain, Jean-Noël Gauthier and Anne Colmar). 623
Marion Le Gall received a PhD fellowship from CEA (Commissariat à l'Energie Atomique et aux 624
Energies Alternatives, France) and DGA (Direction Générale de l’Armement, Ministry of Defense, 625
France). 626
References
627
Aberg, G., 1995. The use of natural strontium isotopes as tracers in environmental studies. Water, Air 628
and Soil Pollution, 79: 309-322. 629
Arnaud, F., Révillon, S., Debret, M., Revel, M., Chapron, E., Jacob, J., Giguet-Covex, C., Poulenard, J., 630
Magny, M., 2012. Lake Bourget regional erosion patterns reconstruction reveals Holocene 631
NW European Alps soil evolution and paleohydrology. Quaternary Science Reviews, 51: 81-632
92. 633
Asahara, Y., Ishiguro, H., Tanaka, T., Yamamoto, K., Mimura, K., Minami, M., Yoshida, H., 2006. 634
Application of Sr isotopes to geochemical mapping and provenance analysis: The case of 635
Aichi Prefecture, central Japan. Applied Geochemistry, 21(3): 419-436. 636
Asahara, Y., Tanaka, T., Kamioka, H., Nishimura, A., Yamazaki, T., 1999. Provenance of the north 637
Pacific sediments and process of source material transport as derived from Rb-Sr isotopic 638
systematics. Chemical Geology, 159: 271-291. 639
Aubert, D., Stille, P., Probst, A., 2001. REE fractionation during granite weathering and removal by 640
waters and suspended loads: Sr and Nd isotopic evidence. Geochimica et Cosmochimica 641
Acta, 65(3): 387-406. 642
Ayrault, S., Roy-Barman, M., Le Cloarec, M.F., Priadi, C.R., Bonte, P., Gopel, C., 2012. Lead 643
contamination of the Seine River, France: geochemical implications of a historical 644
perspective. Chemosphere, 87(8): 902-10. 645
Bakari, S.S., Aagaard, P., Vogt, R.D., Ruden, F., Johansen, I., Vuai, S.A., 2013. Strontium isotopes as 646
tracers for quantifying mixing of groundwater in the alluvial plain of a coastal watershed, 647
south-eastern Tanzania. Journal of Geochemical Exploration, 130: 1-14. 648
Bakker, M.M., Govers, G., Rounsevell, M.D.A., 2004. The crop productivity–erosion relationship: an 649
analysis based on experimental work. Catena, 57(1): 55-76. 650
Banowetz, G.M., Whittaker, G.W., Dierkson, K.P., Azevedo, M.D., Kennedy, A.C., Griffith, S.M., 651
Steiner, J.J., 2006. Fatty acide methyl ester analysis to identify sources of soul in surface 652
waters. Journal of Environmental Quality, 35: 133-140. 653
Barra, R., Cisternas, M., Urrutia, R., Pozo, K., Pacheco, P., Parra, O., Focardi, S., 2001. First report on 654
chlorinated pesticide deposition in a sediment core from a small lake in central Chile. 655
Chemosphere, 45: 749-757. 656
Bertrand, O., Montargès-Pelletier, E., Mansuy-Huault, L., Losson, B., Faure, P., Michels, R., Pernot, A., 657
Arnaud, F., 2013. A possible terrigenous origin for perylene based on a sedimentary record of 658
a pond (Lorraine, France). Organic Geochemistry, 58: 69-77. 659
Blum, J.D., Erel, Y., Brown, K., 1994. 87Sr/86Sr ratios of Sierra Nevada stream waters: Implications for 660
relative mineral weathering rates. Geochimica et Cosmochimica Acta, 58: 5019-5025. 661
Boardman, J., 1993. Soil erosion and flooding as a result of a summer thunderstorm in Oxfordshire 662
and Berkshire, May 1993. Applied Geography, 16(1): 21-34. 663
Boardman, J., Poesen, J., Evans, R., 2003. Socio-economic factors in soil erosion and conservation. 664
Environmental Science & Policy, 6(1): 1-6. 665
Borg, L.E., Banner, J.L., 1996. Neodymium and strontium isotopic constraints on soil sources in 666
Barbados, West Indies. Geochimica et Cosmochimica Acta, 60(21): 4193-4206. 667
20 Brenot, A., Baran, N., Petelet-Giraud, E., Négrel, P., 2008. Interaction between different water bodies 668
in a small catchment in the Paris basin (Brévilles, France): Tracing of multiple Sr sources 669
through Sr isotopes coupled with Mg/Sr and Ca/Sr ratios. Applied Geochemistry, 23(1): 58-670
75. 671
Brown, A.G., Carpenter, R.G., Walling, D.E., 2008. Monitoring the fluvial palynomorph load in a 672
lowland temperate catchment and its relationship to suspended sediment and discharge. 673
Hydrobiologia, 607(1): 27-40. 674
Caitcheon, G.G., Olley, J.M., Pantus, F., Hancock, G., Leslie, C., 2012. The dominant erosion processes 675
supplying fine sediment to three major rivers in tropical Australia, the Daly (NT), Mitchell 676
(Qld) and Flinders (Qld) Rivers. Geomorphology, 151-152: 188-195. 677
Cerdan, O. et al., 2010. Rates and spatial variations of soil erosion in Europe: A study based on 678
erosion plot data. Geomorphology, 122(1-2): 167-177. 679
Chapron, E., Desmet, M., De Putter, T., Loutre, M.F., Beck, C., Deconinck, J.F., 2002. Climatic 680
variability in the northwestern Alps, France, as evidenced by 600 years of terrigenous 681
sedimentation in Lake Le Bourget. The Holocene, 12(2): 177-185. 682
Chartin, C., Evrard, O., Onda, Y., Patin, J., Lefèvre, I., Ottlé, C., Ayrault, S., Lepage, H., Bonté, P., 2013. 683
Tracking the early dispersion of contaminated sediment along rivers draining the Fukushima 684
radioactive pollution plume. Anthropocene, 1: 23-34. 685
Collins, A.J., Walling, D.E., 2002. Selecting fingerprin properties for discriminating potential 686
suspended sediment sources in river basins. Journal of Hydrology, 261(218-244). 687
Collins, A.J., Walling, D.E., 2004. Documenting catchment suspended sediment sources: problems, 688
approaches and prospects. Progress in Physical Geography, 28(2): 159-196. 689
Collins, A.L., Zhang, Y., McChesney, D., Walling, D.E., Haley, S.M., Smith, P., 2012. Sediment source 690
tracing in a lowland agricultural catchment in southern England using a modified procedure 691
combining statistical analysis and numerical modelling. Science of the Total Environment, 692
414: 301-17. 693
Davis, C.M., Fox, J.F., 2009. Sediment fingerprinting: review of the method and future 694
improvemments for allocating nonpoint source pollution. Journal of Environmental 695
Engineering, 135: 490-504. 696
Devlin, M.J., Barry, J., Mills, D.K., Gowen, R.J., Foden, J., Sivyer, D., Tett, P., 2008. Relationships 697
between suspended particulate material, light attenuation and Secchi depth in UK marine 698
waters. Estuarine, Coastal and Shelf Science, 79(3): 429-439. 699
Dotterweich, M., 2013. The history of human-induced soil erosion: Geomorphic legacies, early 700
descriptions and research, and the development of soil conservation—A global synopsis. 701
Geomorphology, 201: 1-34. 702
Douglas, G., Palmer, M., Caitcheon, G.G., 2003. The provenance of sediments in Moreton Bay, 703
Australia: a synthesis of major, trace element and Sr-Nd-Pb isotopic geochemistry, modelling 704
and landscape analysis. Hydrobiologia, 494: 145-151. 705
Douglas, T.A., Gray, C.M., Hart, B.T., Beckett, R., 1995. A strontium isotopic investigation of the origin 706
of suspended particulate matter (SPM) in the Murrat-Darling River system, Australia. 707
Geochimica et Cosmochimica Acta, 59(18): 3799-3815. 708
Eikenberg, J., Tricca, A., Vezzu, G., Stille, P., Bajo, S., Ruethi, M., 2001. 228Ra/226Ra/224Ra and 87Sr/86Sr 709
isotope relationships for determining interactions between ground and river water in the 710
upper Rhine valley. Journal of Environmental Radioactivity, 54: 133-162. 711
Elbaz-Poulichet, F., Dezileau, L., Freydier, R., Cossa, D., Sabatier, P., 2011. A 3500-Year Record of Hg 712
and Pb Contamination in a Mediterranean Sedimentary Archive (The Pierre Blanche Lagoon, 713
France). Environmental Science & Technology, 45(20): 8642-8647. 714
Evrard, O., Bielders, C.L., Vandaele, K., van Wesemael, B., 2007. Spatial and temporal variation of 715
muddy floods in central Belgium, off-site impacts and potential control measures. Catena, 716
70(3): 443-454. 717
Evrard, O., Laceby, J.P., Huon, S., Lefèvre, I., Sengtaheuanghoung, O., Ribolzi, O., 2016. Combining 718
multiple fallout radionuclides (137Cs, 7Be, 210Pbxs) to investigate temporal sediment source


![[PDF] Cours Complet pdf ASP.NET exemples et exercices | Cours informatique](data:image/gif;base64,R0lGODlhAQABAIAAAP///wAAACH5BAEAAAAALAAAAAABAAEAAAICRAEAOw==)