Publisher’s version / Version de l'éditeur:
Vous avez des questions? Nous pouvons vous aider. Pour communiquer directement avec un auteur, consultez la première page de la revue dans laquelle son article a été publié afin de trouver ses coordonnées. Si vous n’arrivez pas à les repérer, communiquez avec nous à [email protected].
Questions? Contact the NRC Publications Archive team at
[email protected]. If you wish to email the authors directly, please see the first page of the publication for their contact information.
https://publications-cnrc.canada.ca/fra/droits
L’accès à ce site Web et l’utilisation de son contenu sont assujettis aux conditions présentées dans le site
LISEZ CES CONDITIONS ATTENTIVEMENT AVANT D’UTILISER CE SITE WEB.
Proceedings of the International Symposium on Room Acoustics, ISRA 2010,
29-331 August 2010, Melbourne, Australia, pp. 1-8, 2010-08-29
READ THESE TERMS AND CONDITIONS CAREFULLY BEFORE USING THIS WEBSITE.
https://nrc-publications.canada.ca/eng/copyright
NRC Publications Archive Record / Notice des Archives des publications du CNRC :
https://nrc-publications.canada.ca/eng/view/object/?id=cccb5316-c1fc-4148-82c7-195517d16e40
https://publications-cnrc.canada.ca/fra/voir/objet/?id=cccb5316-c1fc-4148-82c7-195517d16e40
NRC Publications Archive
Archives des publications du CNRC
This publication could be one of several versions: author’s original, accepted manuscript or the publisher’s version. / La version de cette publication peut être l’une des suivantes : la version prépublication de l’auteur, la version acceptée du manuscrit ou la version de l’éditeur.
Access and use of this website and the material on it are subject to the Terms and Conditions set forth at
Review of objective room acoustics measures and future needs
Re vie w of obje c t ive room a c oust ic s m e a sure s a nd fut ure ne e ds
N R C C - 5 4 4 7 7
B r a d l e y , J . S .
J u l y 2 0 1 1
A version of this document is published in / Une version de ce document se trouve dans:
Proceedings of the International Symposium on Room Acoustics, ISRA 2010,
Melbourne, Australia, August 29-30, 2010, pp. 1-8
http://www.nrc-cnrc.gc.ca/irc
The material in this document is covered by the provisions of the Copyright Act, by Canadian laws, policies, regulations and international agreements. Such provisions serve to identify the information source and, in specific instances, to prohibit reproduction of materials without written permission. For more information visit http://laws.justice.gc.ca/en/showtdm/cs/C-42
Les renseignements dans ce document sont protégés par la Loi sur le droit d'auteur, par les lois, les politiques et les règlements du Canada et des accords internationaux. Ces dispositions permettent d'identifier la source de l'information et, dans certains cas, d'interdire la copie de documents sans permission écrite. Pour obtenir de plus amples renseignements : http://lois.justice.gc.ca/fr/showtdm/cs/C-42
ISRA 2010 1
Review of objective room acoustics measures and
future needs
J.S. Bradley
Institute for Research in Constrcution, National Research Council, 1200 Montreal Rd., Ottawa, Canada, K1A 0R6
PACS: 43.55Fw, 43.55Hy
ABSTRACT
ISO 3382 describes a number of objective room acoustics parameters that are generally accepted as useful for rating some specific aspects of concert hall sound fields. They include measures of decay times, energy ratios, measures of sound strength and several quantities related to the spatial aspects of sound fields. In most cases there are details of the measures, or their application, that raise questions. In general, there has not been a lot of practical research to ex-plore how best to develop and use these objective measures to evaluate conditions in concert halls. For some well es-tablished measures such as Early Decay Time (EDT), we are not really sure how best to calculate their values. For other measures such as energy ratios, modifications are often proposed but without the support of subjective evalua-tions of the proposed changes. In other cases, such as measures of spatial impression, two approaches have been sug-gested, but their relative merits are not well understood. It is easy to propose ever more complex measures, but it is much more difficult to demonstrate their general utility. On the other hand, some commonly described characteristics do not have accepted related objective measures. Many more important and more general problems relate to the need, for design criteria in terms of each quantity, and for an improved understanding of just noticeable differences for each measure. This paper will discuss each measure illustrating particular problems with measurements in various halls.
INTRODUCTION
Since the 1950s a number of room acoustics measures have been developed to describe various aspects of room acoustics characteristics. This paper will give a review of those pa-rameters intended to describe conditions at audience seats for musical performances. The various room acoustic parame-ters have developed as a result of our understanding of the special importance of early-arriving reflections [1,2,3] and the realisation that reverberation times only give an indica-tion of one aspect of room average acoustical quality. Many of the more accepted room acoustics parameters are now defined in Normative Appendices to the ISO 3382-1 standard [4], but are not an integral part of the main body of the stan-dard. It is still a reverberation time standard with some help-ful optional Appendices.
The work of Haas [1,2] reintroduced the importance of early-arriving reflections to the perceived acoustical qualities of rooms. Joseph Henry [5] had first understood their impor-tance in the 1850s, but with Sabine’s introduction of his re-verberation time equation, the importance of early reflections was forgotten for many years. After Hass, subsequent re-search explored the perceived effects combinations of reflec-tions [3] and Thiele [6] proposed Deutlichkeit as a measure of definition or clarity. Deutlichkeit (D50) is an energy ratio of the energy in the early-arriving reflections (in the first 50 ms after the direct sound) to the total energy in an impulse response. Somewhat later Reichardt [7] proposed C80 as a measure of clarity for musical sounds and others suggested variations of C50 that is now preferred as a measure of clarity for speech sounds. These are both energy ratios of the early-arriving to later-early-arriving reflections expressed in decibels with early time intervals of 50 and 80 ms respectively. Not liking the inflexibility of the abrupt divisions between early and late-arriving sounds, Kurer [8] proposed the Centre time TS as an alternative clarity measure. TS is calculated as the centre of gravity of the impulse response.
At the same time as some of the developmentsof clarity measures, Atal et al. [9] showed that perceived reverberance was better related to decay times measured over the first 160 ms of decay for synthesized non-linear decays. For decays in halls, a measure of the decay time from the first 15 dB of the decay curve was used but was less successful than the results for the synthesized decay. This was adapted to the Early De-cay time proposed by Jordan [10] and obtained from a best fit straight line to the first 10 dB of decay. It has been found to be a successful indicator of perceived reverberance in a num-ber of studies [11,12,13]. However, there is no evidence of systematic studies to establish the optimum decay range for best assessing reverberance.
In the seventies and eighties various measures of spatial im-pression were proposed. Early work by de Keet [14] showed that the perceived width of the sound source was enhanced as the cross correlation of the signals at the two ears of a listener decreased. Barron and Marshal [15,16] demonstrated the importance of early-arriving reflections arriving at the lis-tener from lateral directions and they related perceived spatial impression to the (early) Lateral Energy Fraction (LFearly). Although initial work attributed source broadening and lis-tener envelopment to early-arriving lateral reflections, work in the nineties [17,18,19] showed that listener envelopment was mostly due to late-arriving reflections and was enhanced when they arrived from the side of the listener. That is, spa-tial impression was seen to have two components, Apparent Source Width (ASW) and Listener Envelopment (LEV). In the seventies two comprehensive German studies were carried out to determine the relative importance of various room acoustics measures to listeners’ perceptions of acousti-cal quality [20,21]. They used two different techniques to reproduce concert hall sounds in the laboratory. Subsequently Barron [11] evaluated the relative importance of various as-pects of concert hall sounds by administering questionnaires to a panel of expert listeners at seats in British concert halls.
29-31 August 2010, Melbourne, Australia Proceedings of the International Symposium on Room Acoustics, ISRA 2010
2 ISRA 2010
More recently, Beranek and Hidaka have produced a number of publications [12,13,22,23] relating acoustical measure-ments in a large number of well known halls to ratings of the halls from Beranek’s interviews of conductors and other knowledgeable listeners. Although there are common con-clusions from these more comprehensive studies there are also many differences as to which parameters are most im-portant and the relative importance of each parameter. Clearly much more research is needed to unravel the many complex relationships between listeners’ perceptions and room acoustics parameters. These could eventually include new comprehensive studies to determine the relative merits of various measures as components of overall acoustical quality of concert halls. However, much new work is also needed to better understand how best to choose among the measures we do have and how they might be refined to better evaluate conditions in concert halls. Specific needs will be discussed in the following sections for each group of room acoustics parameters.
PROBLEMS WITH EXISTING MEASURES
Table 1 summarises the room acoustics measures currently defined in ISO 3382-1 that are intended to evaluate condi-tions at audience seats in halls for musical performances. These are broken down into four groups listed in the first column: decay times, sound strength, clarity measures, and measures of spatial impression. Problems related to each group of audience parameters will be discussed in the follow-ing 4 subsections.
Table 1. Summary of Audience parameters from ISO 3382-1. Type of
Measure Measures Notes
Decay times T60, reverberation time Physically important EDT, Early decay
time
Subjectively important Sound
strength
G, Strength Hall effect on sound levels Clarity measures D50,Definition C50 Clarity Clarity of speech C80 Clarity TS Centre time Clarity of music Spatial impression
LFearly, Early lateral energy fraction IACCearly, Early inter-aural cross correlation Apparent source width GLL, Late lateral sound level Listener en-velopment
(a) Decay times
Reverberation time (T60) is a physically important parameter that relates to the average properties of a room. It is generally accepted that perceived reverberance is better related to the Early Decay Time (EDT). It is tempting to dismiss the sepa-rate importance of EDT values because many studies have shown T60 and EDT values to be very highly correlated (see Table 2). EDT values are determined from a best fit straight line to the first 10 dB of sound decays and can vary from seat to seat in a large auditorium, reflecting changes in perceived
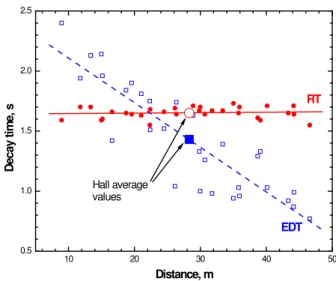
reverberance. Although EDT and T60 values are generally very similar, in some cases they can be remarkably different and in these cases the EDT values indicate some unusual properties of the acoustics of the hall (see Figure 1). We must be careful in dismissing quantities just because on average they are strongly correlated with other parameters. Clearly EDT and T60 values have quite different and important uses.
Figure 1. Plots of mid-frequency EDT and T60 values versus source receiver distance in the Northern Albert Ju-bilee Auditorium [24] before recent renovations were car-ried out to this hall. The rapid decrease with distance of EDT values was found to be due to the dominant ceiling reflections all being directed towards the rear of the hall. Although the procedure for determining EDT values from decay curves generally seems to work well, problems can occur for measurement positions close to the sound source. Close to the source, the sound decay initially drops abruptly before continuing with a more gradual decay. In a round robin comparison of room acoustics measurement systems [25] that compared measurements of 3 settings of a digital reverberator, there were large differences in EDT values for the setting representative of a measurement close to the sound source. The differences in EDT values related to the time interval of the points describing the decay curve that were used to calculate the slope and hence the EDT values as illustrated in Figure 2. One can carefully follow ISO 3382 and still get a wide range of EDT values. This would be a particularly important problem for on-stage measurements, but could also effect results elsewhere.
As with many measures, there is not agreement on how to create a single number EDT value by averaging over fre-quency. Although Barron [11] found an average of EDT val-ues over the bands from 125 to 2k Hz best predicted rever-berance ratings, ISO 3382-1 recommends using a mid-frequency average. Beranek found mid-mid-frequency EDT val-ues to best correspond with his rank ordering of 58 concert halls [12].
Searphim [26] determined just noticeable differences (JNDs) for reverberation times of about 4% for frequencies from 400 to 4000 Hz using bands of noise. It is not clear whether the same value would be obtained for music or speech signals, or whether a similar value would be found for EDT values.
10 20 30 40 50 0.5 1.0 1.5 2.0 2.5 D ecay t im e, s Distance, m EDT RT Hall average values
29-31 August 2010, Melbourne, Australia Proceedings of the International Symposium on Room Acoustics, ISRA 2010
ISRA 2010 3
Figure 2. Comparison of best fit straight lines to the first 10 dB of the decay simulating conditions close to the source. The parameter determining the different straight line fits is the time interval between points of the decay curve used to fit straight lines to the decay. Also shown is the simple approach of measuring from the initial point (0 dB) to the first point that is 10 dB below the initial point (labelled 2 points) [25].
(b) Sound strength
There is considerable evidence of the importance of Sound Strength (G) as a critical component of the acoustical quality of concert halls. Of the two original German studies, the Berlin, group found it to be important [20] and the Gottingen group [21] found it had such a large effect that they left it out of their analyses to better investigate other parameters. Pre-sumably they assumed the importance of Sound Strength was too obvious to need confirmation. Barron’s survey of British halls [11] also confirmed the importance of Sound Strength.
Although not standardized in ISO 3382-1, it is also useful to consider Sound Strength values for the early-arriving and late-arriving sound separately in terms of Gearly and Glate val-ues [28]. Our hearing system perceives different effects from the early and the later-arriving sounds, and physically they are determined by different features of the room design. For example, Gearly values are influenced by particular reflecting surfaces and can be attenuated by interference effects such as the low frequency seat dip attenuation. Glate values will be more influenced by the average absorption values and hall volume and can often be much reduced at under balcony locations [29]. Increased Gearly values can relate to more clarity, but increased Glate values lead to more reverberance and envelopment. They can therefore be very useful in under-standing the characteristics of particular halls. Gearly and Glate values can be calculated from G and C80 values in each oc-tave band.
There are suggested JND values for G values (~ 1 dB) in ISO 3382-1, but there is little information to indicate the impor-tance of how G values should vary with frequency or how best to determine single value frequency-average G values. Barron initially suggested that mid-frequency G values should be > 0 dB. More recently he has proposed a minimum criterion for G values that varies with distance [30]. This approach would indicate a G value of at least +2 dB is re-quireed at a distance of about 20 m from the source (i.e roughly near the middle of a large hall). Beranek [13] has suggested that mid-frequency G values should be between 1.5 and 5.5 dB for large concert halls, with higher values for small chamber music halls ( 9 to 13 dB), and smaller values for opera houses (-1 to 2 dB).
(c) Clarity measures
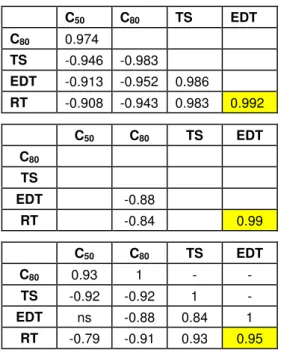
Table 1 includes 4 different clarity measures and others have also been suggested. Although they are referred to as clarity measures, they can be thought of as indicative of the balance between clarity and reverberance. The correlations of hall average values of several parameters in Table 2 show results from 3 different studies indicating that the clarity measures tend to be highly correlated with each other and with the decay time measures. However, high correlations of hall average values do not mean there are not differences among the measures.
We need to understand the differences among the clarity measures so that we know when each is more appropriate. It would be useful to examine individual seat results and not just hall average values to compare the various measures. Because some measures are linear quantities and others are logarithmic, simple correlations may not be very revealing. Subjective studies to determine which measures best predict ratings of clarity for individual seat results would be most helpful.
Some of these measures (e.g. TS) are more strongly corre-lated with decay times and hence may be closer to being measures of reverberance than of clarity. Others (e.g. C50 and C80) are less well correlated with decay times and may be better indicators of clarity. Some measures are more sensitive to spatial variations within halls (e.g. C50) and may be better indicators of seat-to-seat changes in perceived clarity.
Table 2. Correlations of hall average values of clarity and decay time measures from 3 different studies. (Top) Measurements in 5 rooms by Bradley [33], (Middle) Ber-anek’s results from 58 halls [12], and (Bottom) data from 9 halls by Cerda et al. [34].
C50 C80 TS EDT C80 0.974 TS -0.946 -0.983 EDT -0.913 -0.952 0.986 RT -0.908 -0.943 0.983 0.992 C50 C80 TS EDT C80 TS EDT -0.88 RT -0.84 0.99 C50 C80 TS EDT C80 0.93 1 - - TS -0.92 -0.92 1 - EDT ns -0.88 0.84 1 RT -0.79 -0.91 0.93 0.95 There have been studies to determine the JNDs of clarity measures [27,31,32] that suggest roughly similar values with some suggestions of a possible influence of the type of mu-sic. It has been shown [31] that JNDs vary with the magni-tude of D50 values but not with the magnitude of C50 and C80 values, suggesting that the logarithmic ratios (C50 and C80) are perceptually more appropriate measures.
It is sometimes suggested that the abrupt transitions from early to late-arriving energy summations can cause problems and that more gradual transitions should be used or perhaps that using Centre Time (TS) values would avoid this
sug-0 50 100 150 200 -15 -10 -5 0 20 ms 10 ms 2.5 ms EDT Decay curve 3.2 s 0.033 ms 2.3 s 2.5 ms 1.8 s 5 ms 1.4 s 10 ms 1.0 s 20 ms 0.7 s 2 points L evel , d B Time, ms 0.033 ms 5.0 ms 2 points
29-31 August 2010, Melbourne, Australia Proceedings of the International Symposium on Room Acoustics, ISRA 2010
4 ISRA 2010
gested problem. However, there seems to be little evidence that this is a real problem and in practice by 50 or 80 ms after the direct sound, there are usually significant numbers of reflections arriving. There are not usually significant changes in C50 and C80 values due to the movement of a single reflec-tion from one time window to another.
As for most room acoustics parameters there is no substantial information to determine how to combine values into a single frequency-average value. ISO 3382-1 recommends using mid-frequency values. Some argue that low frequency C50 and C80 values tell us little about clarity, but clarity measures do vary systematically over frequency and do provide infor-mation about the acoustical properties of spaces. For exam-ple, low frequency dips in C50 or C80 values can indirectly provide information about the severity of low frequency seat dip attenuation effects. However, it is probably more infor-mative to calculate Gearly values from the combination of G values and C50 or C80 values.
Without new subjective studies to provide more definitive explanations of the differences among the clarity measures, the logarithmic ratios C50 and C80 currently seem to be the better choice. The concept of well-defined separations of early and late-arriving sounds separates different types of responses of our hearing systems and helps us to relate values of clarity measures to the properties of halls.
(d) Measures of spatial effects
As discussed in the Introduction, it is now accepted that there are two aspects to spatial impression: (a) source broadening or apparent source width (ASW), and (b) listener envelop-ment (LEV). However, there are two quite different types of room acoustics parameters intended to relate to the magni-tude of these two phenomena.
ASW is known to be related to the amount of early-arriving lateral reflections. ASW can be measured in terms of either the early lateral energy fraction (LFearly) [16] or the Inter-aural cross correlation of the early-arriving sounds (IACCearly) [14]. Often the quantity 1-IACCearly is used be-cause it is directly related to perceived ASW. Cox et al. [27] have established estimates of JNDs of both the LFearly and 1-IACCearly parameters. For LFearly the JND was 0.048 and for 1-IACCearly 0.075.
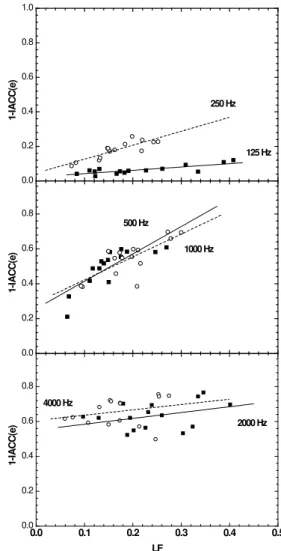
The LFearly and 1-IACCearly measures are conceptually quite different and it is not initially obvious that they are related to each other. However measurements of both quantities in 15 different halls [35] have shown that hall average values are significantly correlated in the octave bands from 125 to 1000 Hz inclusive, but not in the 2000 and 4000 Hz octave bands. These results are reproduced in Figure 3(a).
Figure 3(a) shows a wide range of hall average LFearly values among the 15 halls. However, the range of 1-IACCearly values varies with frequency. In the lowest octave band (125 Hz), the range of 1-IACCearly values is quite small, even though the LFearly and 1-IACCearly values are highly significantly related. In the 125 Hz octave band, the LFearly values are seen to be a more useful indicator of perceived ASW. This is im-portant because spatial impression has been shown to be related to levels of low frequency early-arriving sound [16,17]. In the 250, 500 and 1000 Hz octave bands there are larger ranges of 1-IACCearly values and the two measures are somewhat equivalent indicators of the hall average values. In the highest two octave bands (2000 and 4000 Hz) there is a wide range of LFearly values indicating systematic differences among the 15 halls. However, 1-IACCearly values vary over a small range and are not significantly related to the variations
of LFearly values. The two quantities do not assess the same aspects of the halls in these higher frequency bands. There are therefore clear differences in the two types of measures when hall average values are compared.
Figure 3(a) Hall average values of 1-IACCearly versus hall average values of LFearly [35].
Figure 3(b) compares 124 individual seat measurements of the two quantities in the same 15 halls. The comparisons indicate greater scatter but in all octave bands the values of the 2 measures are significantly related. The two types of measures do assess some similar aspects of the sound fields, but there are other aspects that do not create the same varia-tions in these two types of quantities. One can speculate about the cause of the differences. LFearly values are derived from simple energy summations, but 1-IACCearlyvalues in-volve cross correlations of signals that could be influenced by interference effects that may not be reflected as changes in LFearly values. The important question is, are these audible differences and hence important to perceptions of concert hall sound quality? It seems likely that moving to an adjacent seat could produce measureable changes in IACCearly values but not in LFearly values. Again, how do such changes relate to what we can hear? We need to understand the importance of the differences in these two types of quantities to know which best tells us about the subjectively important aspects of the spatial characteristics of halls.
There is a similar mix of possible measures for assessing the amount of LEV in a concert hall. The original work by Brad-ley and Soulodre [36,37] determined the late-arriving late lateral sound strength (GLL) to be the best predictor of per-ceived LEV ratings when calculated as an energy average over the 4 octaves from 125 to 1000 Hz. This was a simple
0.0 0.1 0.2 0.3 0.4 0.5 0.0 0.2 0.4 0.6 0.8 1 -I A CC (e ) LF 2000 Hz 4000 Hz 0.0 0.2 0.4 0.6 0.8 1 -I A CC (e ) 500 Hz 1000 Hz 0.0 0.2 0.4 0.6 0.8 1.0 1 -I A CC (e ) 250 Hz 125 Hz
29-31 August 2010, Melbourne, Australia Proceedings of the International Symposium on Room Acoustics, ISRA 2010
ISRA 2010 5
way of incorporating three important requirements for the measure into one quantity. That is, it should include only late-arriving sounds, reflect the sound level or strength of the sounds, and should emphasize the importance of those late-arriving sounds late-arriving from lateral directions. Others have demonstrated that late-arriving sounds from above and be-hind also contribute to perceived LEV [38]. This is included in the GLL measure [39], and because it is measured with a figure-of-eight microphone the summation of late arriving sound energy is weighted appropriately according to its direc-tion of arrival.
Figure 3(b) Individual seat values of 1-IACCearly versus individual seat values of LFearly [35].
Barron [40] calculated GLL values for 17 British concert halls averaged over the octave bands from 125 to 1000 Hz from late-arriving sound levels and late lateral energy frac-tions. He found hall average GLL values from -14.1 to 3.4 dB. This is similar to the range of hall average values re-ported in [37] for measurements in 15 halls (-14.4 to +0.8 dB). The hall average GLL values from [29] are shown in Figure 4 and indicate a trend for higher GLL values in nar-row shoe box halls and lower values in large fan shaped halls. The distribution of these data from the 81 individual meas-urements indicates that GLL values must be greater than about -5 dB to be in the top 30% of measured GLL values. While it is not possible to say which range of GLL values is preferred, values greater than -5 dB can be said to correspond to a stronger sense of LEV.
Figure 4. Hall average GLL values (averaged over 125 to 1000 Hz octave bands) in 15 concert halls from [29] ar-ranged in order of increasing GLL.
NEW MEASURES?
There are other dimensions of concert hall sound quality that do not have standardised objective measures related to them. Some of these subjective descriptors are difficult to explain in words and hence it is difficult to assign objective measures to them. Some examples might include ‘presence’, ‘intimacy’ and even ‘warmth’. Some concepts, such as warmth, have accepted descriptions, but they are not intuitively obvious and could easily be interpreted differently by each listener. Two quantities that seem more obvious and easy to describe would be the relative strength of bass sounds and the relative strength of treble sounds. These concepts, and their impor-tance to describing the tone quality imparted by the hall, are readily understood and there are measures that have resulted from careful subjective studies. Lehman and Wilkens [20] proposed the slope of the measured EDT values versus fre-quency as an indicator of acceptable timbre but gave no sepa-rate indicators of the strengths of low and high frequency components.
Soulodre & Bradley [41] proposed measures of both bass and treble strength from an experiment in which subjects listened to music convolved with binaural impulse responses meas-ured in 9 different halls chosen to include a wide range of acoustical conditions. They found that the strength of treble sounds was best related to the ratio of the late-arriving high frequency sound to the late-arriving mid-frequency sounds. (High frequency was defined as the 4k Hz octave and mid-frequency the 1k and 2k Hz octaves). This measure accu-rately predicted the mean ratings of the 10 subjects for the strength of the treble components of the 9 sound fields (Fig-ure 5). The importance of late-arriving treble sounds may indicate that variations in porous absorbing materials and hall volumes mostly explain differences in treble sound levels in the 9 halls.
When values of this treble ratio were calculated for 81 loca-tions spread over 15 different halls, values ranged form -6.7 to -0.8 dB. Values greater than about -3 dB are in the upper 30% of these data and hence would correspond to conditions with relatively stronger treble sounds.
0.0 0.1 0.2 0.3 0.4 0.5 0.6 0.7 0.0 0.2 0.4 0.6 0.8 1 -I A CC (e ) LF 2000 Hz 4000 Hz 0.0 0.2 0.4 0.6 0.8 1 -I A CC (e ) 500 Hz 1000 Hz 0.0 0.2 0.4 0.6 0.8 1.0 1 -I A CC (e ) 250 Hz 125 Hz
QET PHI AKRTNG BUF CLV ORPWASDENBRN DET BOS BAL MASMECTRY -13 -12 -11 -10 -9 -8 -7 -6 -5 -4 -3 -2 -1 0 F F F
G
LL(
125
-1000)
, dB
Hall
29-31 August 2010, Melbourne, Australia Proceedings of the International Symposium on Room Acoustics, ISRA 2010
6 ISRA 2010
Figure 5. Mean perceived strength of treble sounds versus the measured treble ratio [41].
They also found the early-arriving bass sound strength Gearly to be a good predictor of the ratings of the perceived strength of bass sounds. This was explained as due to the seat dip effect [42] being the predominant influence in the strength of bass sounds. Since this effect is due to the attenuation of early-arriving low frequency sound, it would readily explain bass strength as being best predicted by the early-arriving bass strength. This was followed up by a second study to investigate factors influencing the perceptions of bass sounds [43,29]. The results of the second study indicated that the perceived strength of bass sound was not related to the low frequency reverberation times but to the levels or strength of the low frequency sound. In particular the 125 octave strength (G125) was a particularly successful predictor of rat-ings of bass strength as shown in Figure 6.
A weighted combination of 125 and 250 Hz octave band early- and late-arriving sounds (Gw) predicted perceived bass strength ratings even more accurately.
Gw = 10log{E80(125)+3Elate(125)+0.5[E80(250)
+3Elate(250)]} (1) Where E80 = 10^(Gearly/10) and represents the early-arriving sound energy,
and Elate = 10^(Glate/10) and represents the late-arriving sound energy.
Figure 6. Mean ratings of perceived bass strength versus G(125) [43].
Mean perceived bass strength values are plotted versus Gw values in Figure 7. The best fit 3rd order polynomial shown has an associated R2 value of 0.99.
Figure 7. Mean ratings of perceived bass strength versus Gw from equation (1) and best fit 3
rd
order polynomial, R2 = 0.99 [43].
The Gw values can become a useful indicator of the relative strength of bass sounds by expressing them relative to the mid-frequency G values (averaged over 500 and 1000 Hz octave bands). Values of this bass strength ratio measure were calculated for 81 locations spread over 15 concert halls. This resulted in a range of values from 1.0 to 7.4 dB. Values greater than about 5.5 dB would be in the upper 30% of these data and hence would indicate conditions with relatively strong bass sounds.
These results suggest the possible format of measures of bass and treble strength. Further studies to confirm the validity of these approaches are now needed.
WHAT ELSE IS MISSING? (a) More JND information
We need to more fully understand the smallest changes in every aspect of room acoustics that are just detectable, that is the just noticeable differences (JND) for each quantity. It is only with a full understanding of the JNDs for each parame-ter that we can understand the significance of differences in their values. We currently have very limited information on JNDs of room acoustics parameters. The work of Cox et al. [27] is the most comprehensive and provides some estimates of JNDs for differences between conditions where only one particular aspect of the sound field was varied and all other aspects were held constant. There are some similar values from other research [31,32] but the influences of the type of sounds (music or speech) and the type of music are not well established.
The available JND values are for variations of broadband signals. We have no information concerning how our sensi-tivity to differences might vary with frequency for almost all room acoustics parameters (except for T60 values [26]). It seems likely that we are more sensitive to changes in particu-lar frequency bands, but this has not been quantified. It is difficult to use the currently available laboratory values of JNDs for the problems of interpreting listening experi-ences in real halls. For example, when we move from one seat to another, many different aspects of sound fields vary in different ways. Under such realistic conditions, we do not know what are the smallest changes that we can detect. For practical purposes, these differences would be the smallest changes that are really meaningful.
-9 -8 -7 -6 -5 -4 0 20 40 60 80 100 P er c ei ved t reb le Treble ratio, dB -6 -4 -2 0 2 4 6 0 1 2 3 4 5 P er c ei ved bass st ren gt h G(125), dB 0 2 4 6 8 10 1 2 3 4 5 P er cei ved B as s Lev el Weighted Gw, dB
29-31 August 2010, Melbourne, Australia Proceedings of the International Symposium on Room Acoustics, ISRA 2010
ISRA 2010 7
(b) Validated single value frequency-average meas-ures
For practical application of room acoustics parameters, it is often desired to reduce the octave band values of each pa-rameter to a single frequency-average value. For example, we often describe room decay times in terms of mid-frequency EDT or T60 values. There is some confusion because mid-frequency is sometimes defined as a single mid-mid-frequency octave band, sometimes as an average of 500 and 1000 Hz octave band results, and in other cases an average over the 3 octave bands, 500, 1000 and 2000 Hz. Although it is com-mon to refer to mid-frequency values for this purpose (as included in ISO3382-1 for some measures), there is not much evidence to support the idea that mid-frequency values are most representative of the perceived broadband changes of all measures. We need subjective studies to more clearly estab-lish the most important range of frequencies for each measure and to determine how best to average over these more impor-tant frequencies.
(c) Criteria for preferred values
One of the most important missing elements in the room acoustics puzzle is the lack of preferred design criteria for each room acoustics parameter. This is not a simple problem and there are good reasons why we do not have many fully supportable criteria. We can carry out laboratory studies to identify details such as JND values with suitably complex variations in listening conditions, but the determination of most preferred conditions in concert halls can only be com-pletely verified by listeners in real concert halls.
Because such criteria are expected to vary with the type of music and the size of the halls, there will probably be several criterion values or ranges of values for each room acoustic parameter. Some such criterion values do exist but only for a few parameters. It is only with the blending of several efforts to derive such criteria that we can be really confident about the required design goals for various types of performance hall.
(d) More research to answer these needs
Considering the complexity of concert hall acoustics issues, the need for new research presents many challenges. How-ever, the required research does not have to be in the form of large comprehensive studies looking at all aspects of concert hall acoustics. There are many pieces of the puzzle that can and should be tackled separately. By developing a more complete understanding of the individual pieces, we will eventually be better able to more successfully put the com-plete puzzle together. For example, one can imagine investi-gations of how EDT should be defined to best reflect subjec-tive ratings of reverberance. This could include determining the optimum decay range to use, how to measure the slope of that decay range, how best to create a frequency average EDT measure, and possibly investigations of JNDs for EDT measures.
One convenient technique for new investigations would be to carryout listening tests in which subjects would rate sounds of anechoic music samples convolved with binaural impulse responses from a range of concert hall conditions. This can be done with relatively modest facilities, if access to binaural impulse responses is possible.
This paper has tried to illustrate many of the component pieces in need of further research. Such more focussed stud-ies could eventually lead to more comprehensive studstud-ies examining the question of the combined importance of the various dimensions of concert hall sound.
CONCLUSIONS
Many existing results are based on initial exploratory studies that proposed solutions which have been adopted without subsequent more extensive investigations and validations. There are many situations where new work is needed to fur-ther validate and optimise our approach. In many cases the new research could be of a more focussed nature to explore the details of particular measures. Such more-focussed inves-tigations could more effectively make progress, now that we have a reasonable general understanding of many important aspects of concert hall acoustics issues. Of course, ultimately there will be a need for more comprehensive studies to de-termine the relative importance of each of the subjective components of concert hall sound quality and the related objective measures.
There is so much we need to understand better!
REFERENCES
1. Haas, H., “Uber den Einfluss des Einfachechos auf die Horsamkeit von Sprache”, Acustica 1, 49-58 (1951). 2. Haas, H., “The Influenece of a Single Echo on the
Au-dibility of Speech”, JAES, 20 (2) 146-159 (1972). 3. Seraphim, H.P., “Uber die Wahrnehmbarkeit mehrerer
Ruckwurfe von Sprachschall”, Acustica 11, 80-91 (1961).
4. ISO3382-1, “Measurement of Room Acoustic Parame-ters – Part1 Performance Spaces”, ISO (2009). 5. Shankland, R.S. , “Architectural acoustics in America
to 1930”, J. Acoust. Soc. Am., 61 (2) 250-254 (1977). 6. Thiele, R., “Richtungsverteilungs und Zeitfolge der
Schallruckewurfe in Raumen”, Acustrica 3, 291-302 (1953).
7. Riechardt, W., Abdel Alim, O. and Schmidt, W., “Defi-nition und Messgrundlage einnes objectiven Masses zur Ermittlung der Grenze zwischen brauchbarer und un-brauchbarer Durchsichtigkeit bei Musikdarbeitung”, Acustica 32, 126-137 (1975).
8. Kurer, R., doctoral dissertation Technical University of Berlin (1972).
9. Atal, B.S., Schroeder, M.R., and Sessler, G.M., “Subjec-tive Reverberation Time and its Relation to Sound De-cay”, 5th ICA, Liege, 1965, G32 (1965)
10. Jordan, V.L., “Recent Developments in Auditorium Acoustics”, Tenth Int. Congress on Acoustics (1980) 11. Barron, M., “Subjective Study of British Concert
Halls”, Acustica 66 (1) 2-14 (1988).
12. Beranek, L.L., “Subjective Rank-Ordering and Acous-tical Measurements for fifty-eight Concert Halls”, Acta Acustica united with Acustica, 89 (3) 494-508 (2003). 13. Beranek, L.L., “Concert Halls and Opera Houses –
Music Acoustics and Architecture”, Springer Verlag, New York (2004).
14. Keet, W. de V., “The Influence of Early Lateral Reflec-tions on Spatial impression”, 6th ICA, Tokyo, pp. E-53-E-57, (1968).
15. Barron, M., "The Subjective Effects of First Reflec-tioins in concert Halls”, J.Sound. Vibr., 15, 475-494 (1971).
29-31 August 2010, Melbourne, Australia Proceedings of the International Symposium on Room Acoustics, ISRA 2010
8 ISRA 2010
16. Barron, M., “Spatial Impression due to Early Lateral Reflection in Concert Halls: The Derivation of a Physi-cal Measure", J. Sound Vib., 77, 211-232 (1981). 17. Morimoto, M., and Pösselt, C., "Contribution of
Rever-beration to Auditory Spaciousness in Concert Halls”, J. Acoust. Soc. Jpn., 10, 87-92 (1989).
18. Bradley, J.S. and Soulodre, G.A., "The Influence of Late-arriving Energy on Spatial Impression", J. Acoust. Soc. Am., 97 (4) 2263-2271 (1995).
19. Bradley, J.S. and Soulodre, G.A., "Objective Measures of Listener Envelopment", J. Acoust. Soc. Am., 98 (5) 2590-2597 (1995).
20. Lehman, P. and Wilkens, H., “Zusammenhang subjek-tiver Beurteilung von Koncertsälen mit raumakus-tischen Kriterien”, Acustica 15, 256-268 (980). 21. Schroeder, M.R., Gottlob, D. and Siebrasse, K.F.,
“Comparative Study of European Concert Halls: Corre-lation of Subjective Preference with Geometric and Acoustic Parameters”, J. Acoust. Soc. Am., 56 (4) 1195-1201 (1974).
22. Beranek, L.L., “Concert Hall Acoustics – 2008”, J. Aud. Eng. Soc., 56 (7/8) 532-544 (2008).
23. Hidaka, T. and Beranek, L.L., “Objective and subjec-tive evaluations of twenty-three opera houses in Europe, Japan and the Amricas”, J. Acoust. Soc. Am. 107 (1) 368-383 (2000).
24. Bradley, J.S., “Contemporary Approaches to Evaluat-ing Auditorium Acoustics”, Presented at AES 8th In-ternational Conference, the Sound of Audio, 59-69, Washington, May (1990).
25. Bradley, J.S., "An International Comparison of Room Acoustics Measurements Systems", IRC Internal Report No. 714, (January 1996).
http://www.nrc-cnrc.gc.ca/obj/irc/doc/pubs/ir/ir714/ir714.pdf 26. Seraphim, H. –P., “Untersuchungen Uber Die
Unter-schiedsschwelle Exponentiellen Abklingens Von Rauschbandimpulsen”, Acustica, 280-284, 8 (1958). 27. Cox, T.J., Davies, W.J. and Lam, Y.W., “The
Sensitivi-ty of Listeners to Early Sound Field Changes in Audito-ria”, Acustica 79, 27-41, (1993).
28. Bradley, J.S., “Using ISO3382 Measures, and Their Extensions, to Evaluate Acoustical Conditions in Con-cert Halls”, Acoustical Science and Technology, 26, (2) 170-178 (2005).
29. Bradley, J.S., “The Sound Field for Listeners in Con-cert Halls and Auditoria”, Chapter 5, Computational Architectural Acoustics (Editor J.J. Sendra) by WIT Press, Southampton, UK.
30. Barron, M, “When is a concert hall too quiet?”, Proceed-ings 19th International Congress on Acoustics, (Septem-ber 2007).
31. Bradley, J.S., Reich, R., and Norcross, S.G., “A Just Noticeable Difference in C50 for Speech”, App. Acoust., 58 (2) 99-108, (1999).
32. Ahearn, M., Schaeffler, M., Vigeant, M., and Celmer, R.D., “The Just Noticeable Difference in the Clarity In-dex for Music, C80”, University of Hartford Acoustics Report # EAC-2009-11, (June 2009).
33. Bradley, J.S., “Auditorium Acoustics Measurements from Pistol Shots”, J. Acoust. Soc. Am., 80 (1) 199-205 (1986).
34. Cerda, S., Giménez, A., Romeo, J., Cibrián R., and Mi-ralles, J.L., “Room Acoustical Parameters: A Factor Analysis Approach”, App. Acoust., 70 97-109 (2009). 35. Bradley, J.S., “Comparison of Concert Hall
Measure-ments of Spatial Impression”, J. Acoust. Soc. Am., 96 (6) 3525-3535, (1994).
36. Bradley, J.S., and Soulodre, G.A., "The Influence of Late-arriving Energy on Spatial Impression", J. Acoust. Soc. Am., 97 (4) 2263-2271 (1995).
37. Bradley, J.S. and Soulodre, G.A., "Objective Measures of Listener Envelopment", J. Acoust. Soc. Am., 98 (5) 2590-2597 (1995).
38. Furuya, H., Fujimoto, K., Wakuda, A. and Nakano, Y., “The Influence of Total and Directional Energy of Late Sound on Listener Envelopment”, Acoust. Sci. & Tech. 26, 208-211 (2005).
39. Evjen, P., Bradley, J.S. and Norcross, S.G., “The Effect of Late Reflections from Above and Behind on Listener Envelopment”, App. Acoust., 62 (1) 137-153 (2000). 40. Baron, M., “Late Lateral Energy Fractions and the En-velopment Question in Concert Halls”, App. Acoust. 62, 185-202 (2001).
41. Soulodre, G.A., and Bradley, J.S., "Subjective Evalua-tion of New Room Acoustic Measures", J. Acoust. Soc. Am., 98 (1) 294-301 (1995).
42. Bradley J.S., “Some Further Investigations of the Seat Dip Effect”, J. Acoust. Soc. Am., 90 (1) 324-333 (1991) 43. Bradley, J.S., Soulodre, G.A., and Norcross, S.,
"Fac-tors Influencing the Perception of Bass", J. Acoust. Soc. Am., 101 (5) Pt. 2, 3135 (1997).
![Figure 4. Hall average GLL values (averaged over 125 to 1000 Hz octave bands) in 15 concert halls from [29] ar-ranged in order of increasing GLL](https://thumb-eu.123doks.com/thumbv2/123doknet/14142260.470593/8.893.488.754.80.361/figure-average-values-averaged-octave-concert-ranged-increasing.webp)
![Figure 5. Mean perceived strength of treble sounds versus the measured treble ratio [41]](https://thumb-eu.123doks.com/thumbv2/123doknet/14142260.470593/9.893.489.754.80.338/figure-perceived-strength-treble-sounds-versus-measured-treble.webp)
