HAL Id: hal-00317573
https://hal.archives-ouvertes.fr/hal-00317573
Submitted on 4 Sep 2008
HAL is a multi-disciplinary open access
archive for the deposit and dissemination of
sci-entific research documents, whether they are
pub-lished or not. The documents may come from
teaching and research institutions in France or
abroad, or from public or private research centers.
L’archive ouverte pluridisciplinaire HAL, est
destinée au dépôt et à la diffusion de documents
scientifiques de niveau recherche, publiés ou non,
émanant des établissements d’enseignement et de
recherche français ou étrangers, des laboratoires
publics ou privés.
Recording and simulation of hippocampal neural
networks with bicuculline
Guillaume Becq, Sophie Roth, Steeve Zozor, Jacques Brocard, Sylvie
Gory-Fauré, Pierre-Olivier Amblard, Catherine Villard
To cite this version:
Guillaume Becq, Sophie Roth, Steeve Zozor, Jacques Brocard, Sylvie Gory-Fauré, et al.. Recording and
simulation of hippocampal neural networks with bicuculline. 6th international meeting on
substrate-integrated micro electrode arrays, Jul 2008, Reutlingen, Germany. pp.345-348. �hal-00317573�
Recording and simulation of hippocampal neural networks with
bicuculline
Becq G.1, Roth S.2, 3, Zozor S.1, Brocard J.3, Gory-Faur´e S.3, Amblard P.-O.1, Villard C.2
(1) Department Image and Signal, Gipsa-lab CNRS, Grenoble, France (2) Institut N´eel, CNRS and Universit´e Joseph Fourier, Grenoble, France (3) Grenoble Institut des Neurosciences, Inserm, Grenoble, France
This work has been funded in part by the French National Scientific Research Center (CNRS) with a postdoctoral grant.
Abstract
In this study we compare the neural activity of a population of neurons recorded with a MEA to sim-ulations of equivalent networks obtained on a computer when bicuculline, an antagonist of inhibitory connections, is introduced into the nutritive solution. The aim of this study is to obtain a model pro-ducing extra-cellular data that match the synchronicity of two different real networks: cell culture and hippocampus slice. One compartment model of neuron and neuron-electrode model are used to simulate experiments. Parameters of the models are fitted to match in vivo data. It is shown that the variation of the noise level at the synaptic level induce a variation in the period of the bursting effect of bicuculline and produce variation in amplitude of the recorded signal.
Background/Aims
In this study we compare the neural activity of a population of neurons recorded with a MEA to sim-ulations of equivalent networks obtained on a com-puter when bicuculline, an antagonist of inhibitory connections, is introduced into the nutritive solu-tion. It is known that this drug enhances the net-work activity and synchronization of the neural ac-tivity is observed. The aim of this study is to obtain a model producing extra-cellular data that match the synchronicity of two different real net-works: cell culture and hippocampus slice. This is a step to validate these models and switch to the de-sign of more complicated networks containing both inhibitory and excitatory connections.
Methods
For the organotypic hippocampus slice of E17 rat (H1: 18 days in vitro (DIV18), CA1 region; Ori-gin: SynapCell, Grenoble France) laid on a MEA, a preparation of bicuculline 10−2M is added to the
nutritive solution. For the DIV26 mice culture of hippocampal neurons on MEA (C20), bicuculline 10−4M is added. In both cases, the activity is
ob-served after 10 min. Circular electrodes have a di-ameter of 35 µm and are separated by a distance of 100 µm. Signals are enhanced by a x 100 amplifica-tion.
For numerical simulations, nneuron integrator
neurons are computed using an Izhikevich mo-del [Izhikevich, 2003, Izhikevich, 2004]. The evolu-tion of the intracellular membrane potential v and of a recovery variable u for each neuron i is de-scribed by a generalized integrate-and-fire model
using a set of non linear differential equations and a spiking rule: dvi(t) dt = 0.04 · v 2 i(t) + e · vi(t) + f − ui(t) + Ii(t) (1) dui(t) dt = a ·(b · vi(t) − ui(t)) (2) if vi(t) ≥ vthresh, then n vi(t) ← c ui(t) ← ui(t) + d (3)
The initial parameter values of the neuron in the CA3 region of the hippocampus as integrator neurons are taken from [Hocking and Levy, 2006] and set to a = 0.02, b = −0.1, c = −55, d = 6, e = 4.1, f = 108, vthresh = 30. For numerical
in-tegration and stability, we use two successive Euler approximations by dividing the time step by two and blocking vi(t) to vthreshwhen spikes occurred.
An input current is considered at each neuron soma using Ii(t) = Ii,syn(t) + Ii,noise(t). Ii,syn(t) is
the synaptic source of current given in our model
by Ii,syn(t) = g · Si.· σ(t). Si.is the ith row of the
connectivity matrix S indicating all the afference of neuron i, which element Si,j is 1 if neurons i and
j are connected and zero otherwise. Note that we set Si,i= 0 to avoid self connection (autapse). σ(t)
is a vector of {0, 1} indicating firing neurons. g is the synaptic conductance, the same for all neurons. Random networks with 70 % of connections (S con-tains 70 % of 1) are generated (21 connections for C20 simulation and 350 connections for H1 simula-tion). This value is taken for a ratio of 0.7 between excitatory and inhibitory neurons for a fully con-nected network. The use of this model for isyn(t)
does not enable to take into account the biologic delays observed during synaptic transmission and the specific transfer function for dendrites.
Chd Rseal Rspread Re Ce Rmet Csh V i(t) xi(t) Electrode Neural Coupling I
Figure 1: Martinoia’s model of neuron-electrode coupling [Martinoia et al., 2004].
fluctuations on the synaptic ionic channels. A ran-dom uniform noise Uij(t) between 0 and 1 was
in-troduced on each connection for stochastic behavior of synapses. Ii,noise(t) = gnoise· Ui.(t) · ¯σ(t) with
¯
σ(t) logical not of σ. gnoise is the parameter that
control the level of noise.
A filtering model using resistances and ca-pacitances to design the neuron-electrode cou-pling is used to generate signals as those recorded by a MEA using the Martinoia’s model [Martinoia et al., 2004]. The electric equiva-lent scheme is presented in Fig. 1.
The filtering introduces by such a model can be written:
xi(t) = h(t) ∗ vi(t) (4)
The Laplace transform H of the transfer function h is given by: H(p) = p3(p + p2)p (p2p3+ (p2+ p3+ p4)p + p2)(p + p1) (5) with p1 = 1/(RsealChd), p2 = 1/(ReCe), p3 = 1/(R1Csh), p4 = 1/(R1Ce) and R1 = Rspread+
Rmet. Rspread is an ohmic drop between the cell
and the electrode. Rmet is the metallic resistance
of the electrode. Rseal is the sealing resistance
be-tween the cell and the electrode and corresponds to the leak of current to the electrolyte bath. Chd is
a capacitive component due to a polarization layer between the cell and the electrode. Cshis the shunt
capacitance between metallic electrode and ground. Reand Ce are respectively the resistive and
capac-itive components at the electrolyte-electrode inter-face using a basic electrode model [Robinson, 1968]. We used the values given in [Martinoia et al., 2004]:
Rspread = 11.7 kΩ, Rmet = 1.5 Ω, Rseal = 5 M Ω,
Chd = 17.45 pF , Csh = 5 pF , Re = 140 kΩ, Ce =
1.14 nF .
As an electrode j on a MEA senses the extracel-lular behavior of several neurons, we use a mixture of signals with random weight simulating the at-tenuation due to distance to the electrode for each sensed neuron in a set of nrec,j neurons. This
cor-responds to the equation:
Vrec,j(t) =
nrec,j
X
i=1
wixi(t) + Vrec,noise(t) (6)
with wi a random uniform weight simulating the
attenuation due to distance, xi the extracellular
measures of neuron i concerned by electrode j,
nrec,j number of neurons concerned by electrode
j and Vrec,j the recorded potential on electrode j.
Vrec,noiseis and additional noise due to current
fluc-tuations on the electrode. It was obtained by convo-lution of the transfer function of the electrode helec
with scheme given in Fig.1 and a gaussian white noise of current Ielec,noise with a standard
devia-tion of 500 pA for H1 and 50 pA for C20, manually set to match recorded noise level:
Vrec,noise(t) = helec(t) ∗ Ielec,noise(t) (7)
Helec(p) =
Re
1 + p/p2
(8) The simulation frequency was set to 10 kHz as the sampling frequency of recorded signals in both con-ditions.
Results
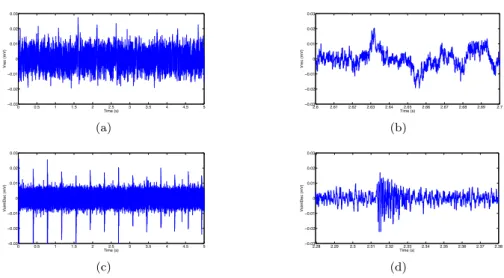
The parameters driving the neurons firing rate and the collective behavior of the network are fitted to match biological observations considering only exci-tatory connections due to the blockade of inhibitory connections by bicuculline. Examples of recorded signals are given in Fig. 2(a) and 3(b). We tuned the parameters to obtain a simulated networks of
nneuron = 500 neurons for H1 and nneuron = 30
neurons for C20. These values corresponds to the number of neurons observed in the structure and neurons recorded near an electrode in the differ-ent culture and corresponds to densities of our ex-periments of approximately 5 · 104cells · mm−2 for
H1 and 3 · 103cells · mm−2 for C20 (in the
or-der of those reported in [Wang and Buzs´aki, 1996, Wheeler and Novak, 1986] for example). These val-ues are also taken according to the constructive
Table 1: Parameters values
a b d nneuron g gnoise nrec
0.005 -0.1 5 30 20 25 10 0.004 -0.02 1 500 1 1 100
signals recorded on electrode when synchrony is present that leads to peak to peak amplitude of about 0.150 mV for H1 and 0.015 mV for C30. This ratio, of about 10 between the two conditions, is in accordance with the cultures densities ratio and the number of recorded neurons (the same ratio is observed for noise current). Parameters values for neurons are given in Tab. 1.
Results of simulated signals are presented in Fig. 2(c) and 3(d). In our experiments, the pe-riod of bursting can be driven by different param-eters including noisy inputs weights. The effect on the different parameters are as following: a is the time scale of the recovery variable, the slower value, the slower recovery (a low induces a low bursting rate, a high, high bursting rate); b is the sensitiv-ity of the recovery variable u, the slower value, the slower is the sensitivity to the fluctuation of v (b high induces high bursting rate, b low, low burst-ing rate); d is the after spike reset of u, it con-trols, in part, the interspike rate of the model (d high induces low interspike rate, d low, high inter-spike rate). The synaptic noise introduces phase shifts between neurons that modify synchronism and amplitude in the recorded signal. Differences in patterns generated by synchronized bursts of fir-ing neurons from in vitro measurements are possibly due to our model that does not take into considera-tion synaptic delays. We observed a modulaconsidera-tion of the frequency due to the addition of noise, that can be explained by the fluctuations around the rest-ing state: increasrest-ing nose can initiate more easily new spikes. Synchronization is driven by g and the level of noise gnoise, that potentially trigger spikes.
A better study of the parameters initiated in this phenomenon must be done to be quantified and identified with experimental data and tested with other experimental conditions as those described in [Canepari et al., 1997] for example.
Conclusion/Summary
Results indicate that the presence of noise on synap-tic inputs, in addition to the blockade of inhibitory connections, is required to produce synchronous bursts with a given period. The tuning of the noise level gives then a good concordance with real sig-nals.
References
[Canepari et al., 1997] Canepari, M., Bove, M., Maeda, E., Capello, M., and Kawana, A. (1997). Experimental anal-ysis of neuronal dynamics in cultured cortical nertworks and transitions between different patterns of activity. Bi-ological Cybernetics, 77:153–162.
[Hocking and Levy, 2006] Hocking, A. B. and Levy, W. B. (2006). Gamma oscillations in a minimal CA3 model. Neurocomputing, 69:1244–1248.
[Izhikevich, 2003] Izhikevich, E. M. (2003). Simple model of spiking neurons. IEEE Transactions on Neural Networks, 14(6):1569–1572.
[Izhikevich, 2004] Izhikevich, E. M. (2004). Which model to use for cortical spiking neurons. IEEE Transactions on Neural Networks, 15(5):1063–1070.
[Martinoia et al., 2004] Martinoia, S., Massobrio, P., Bove, M., and Massobrio, G. (2004). Cultured neurons coupled to microelectrode arrays: circuit models, simulations and experimental data. IEEE Transactions on Biomedical En-gineering, 51(5):859–864.
[Robinson, 1968] Robinson, D. A. (1968). The electrical properties of metal microelectrodes. Proceedings of the IEEE, 56(6):1065–1071.
[Wang and Buzs´aki, 1996] Wang, X.-J. and Buzs´aki, G. (1996). Gamma oscillation by synaptic inhibition in a hip-pocampal interneuronal network model. Journal of Neu-roscience, 16(20):6402–6413.
[Wheeler and Novak, 1986] Wheeler, B. C. and Novak, J. L. (1986). Current source density estimation using micro-electrode array data from the hippocampal slice prepa-ration. IEEE Transactions on Biomedical Engineering, 33(12):1204–1212.
0 0.5 1 1.5 2 2.5 3 3.5 4 4.5 5 !0.03 !0.02 !0.01 0 0.01 0.02 0.03 Time (s) Vrec (mV) (a) 2.6 2.61 2.62 2.63 2.64 2.65 2.66 2.67 2.68 2.69 2.7 !0.03 !0.02 !0.01 0 0.01 0.02 0.03 Time (s) Vrec (mV) (b) 0 0.5 1 1.5 2 2.5 3 3.5 4 4.5 5 !0.03 !0.02 !0.01 0 0.01 0.02 0.03 Time (s) VsimElec (mV) (c) 2.28 2.29 2.3 2.31 2.32 2.33 2.34 2.35 2.36 2.37 2.38 !0.03 !0.02 !0.01 0 0.01 0.02 0.03 Time (s) VsimElec (mV) (d)
Figure 2: Comparison of 5 s of signal for a) recorded neurons on a slice of hippocampus H1, c) simulated recording of 100 neurons (out of 500) using an Izhikevich model with no synaptic delays. Zooms of a burst of synchronized neurons is given for (b) recorded neurons and d) simulated neurons
(a) 10 11 12 13 14 15 !0.01 !0.005 0 0.005 0.01 time (s) Amp lit u d e (mV) 8 (b) 12.7 12.72 12.74 12.76 12.78 12.8 !0.01 !0.005 0 0.005 0.01 time (s) Amp lit u d e (mV) 8 (c) 0 1 2 3 4 5 !0.01 !0.005 0 0.005 0.01 Time (s) Vsi mEl e c (mV) (d) 3.14 3.16 3.18 3.2 3.22 !0.01 !0.005 0 0.005 0.01 Time (s) Vsi mEl e c (mV) (e)
Figure 3: Comparison of 5 s of signal for a) recorded neurons from hippocampus grown in vitro C20, c) simulated recording of 10 neurons (out of a network of 30 neurons) using an Izhikevich model with no synaptic delays. Zooms of a burst of synchronized neurons is given for (b) recorded neurons and d) simulated neurons
![Figure 1: Martinoia’s model of neuron-electrode coupling [Martinoia et al., 2004].](https://thumb-eu.123doks.com/thumbv2/123doknet/14341906.499344/3.892.209.674.106.261/figure-martinoia-model-neuron-electrode-coupling-martinoia-et.webp)
![[PDF] Document Introduction au Langage C pdf](data:image/gif;base64,R0lGODlhAQABAIAAAP///wAAACH5BAEAAAAALAAAAAABAAEAAAICRAEAOw==)