HAL Id: hal-00881468
https://hal.archives-ouvertes.fr/hal-00881468
Submitted on 8 Nov 2013
HAL is a multi-disciplinary open access
archive for the deposit and dissemination of
sci-entific research documents, whether they are
pub-lished or not. The documents may come from
teaching and research institutions in France or
abroad, or from public or private research centers.
L’archive ouverte pluridisciplinaire HAL, est
destinée au dépôt et à la diffusion de documents
scientifiques de niveau recherche, publiés ou non,
émanant des établissements d’enseignement et de
recherche français ou étrangers, des laboratoires
publics ou privés.
Sub and ultra harmonic extraction using modified
Hammerstein model
Fatima Sbeity, Jean-Marc Girault, Sébastien Ménigot, Jamal Charara
To cite this version:
Fatima Sbeity, Jean-Marc Girault, Sébastien Ménigot, Jamal Charara. Sub and ultra harmonic
ex-traction using modified Hammerstein model. 2012 International Conference on Complex Systems
(ICCS), Nov 2012, Agadir, Morocco. pp.1-5, �10.1109/ICoCS.2012.6458608�. �hal-00881468�
Sub and ultra harmonic extraction using modified
Hammerstein model
Fatima Sbeity, Jean-Marc Girault
*, Sébastien Ménigot
UMR INSREM U930Université François Rabelais Tours, France [email protected]; [email protected]
Jamal Charara
Departement of physics Lebanese University Hadath, Lebanon [email protected]© 2012 IEEE. Reprinted, with permission, from Fatima Sbeity, Jean-Marc Girault*, Sébastien Ménigot and Jamal Charara, Sub and ultra harmonic extraction using modified Hammerstein model, 2012 International Conference on Complex Systems (ICCS), 2012.
This material is posted here with permission of the IEEE. Such permission of the IEEE does not in any way imply IEEE endorsement of any of the Université François Rabelais de Tours' products or services. Internal or personal use of this material is permitted. However, permission to reprint/republish this material for advertising or promotional purposes or for creating new collective works for resale or redistribution must be obtained from the IEEE by writing to [email protected].
DOI : 10.1109/ICoCS.2012.6458608
Abstract—Ultrasound contrast imaging has been introduced in order to increase the contrast of echographic images by injecting micro-bubbles in the vascular system. They are gaz filled microbubbles with nonlinear behavior. One of the most used modality of ultrasound contrast imaging is the second harmonic imaging. This imaging technique, based on the reception of the second harmonic, is devoted to image only the nonlinearity of the microbubble. However, in such ultrasound images the contrast is limited by the nonlinear components of non-perfused tissue. Sub and ultra harmonic imaging appeared to be an interesting alternative to overcome this limitation since, unlike tissue, microbubbles generate sub and ultra harmonics. In order to extract optimally these sub and ultra harmonic components, we proposed a modified Hammerstein model able to model and extract sub and ultra harmonics. Results showed i) that microbubble signal is accurately represented both in time and frequency domains and ii) that sub- and ultra-harmonics were well extracted and separated from harmonic component. Note that the gain achieved by comparing the filtering signals by the modified Hammerstein and the standard Hammerstein was 4.6 dB.
Keywords-Extraction; microbubble; modified Hammerstein model; modeling; sub-harmonics; ultra-harmonics.
I. INTRODUCTION
Ultrasound contrast agents (UCA) have made a revolution in the ultrasound imaging [1]. A great contrast enhancement
was achieved with the introduction of second harmonic imaging (SHI). This modality is based on the detection of second harmonic 2 f0 generated by UCA [2][3]. UCA are gaz microbubbles characterized by a nonlinear behavior, and having acoustic impedance very different from that of surrounding tissue. These two factors yields to enhance the contrast of images [4][5][6]. Although SHI produced high quality images, its application is limited by the nonlinearity of tissue. Ultrasound propagation in tissue is not perfectly linear, and harmonics could be generated. This may reduce the contrast of images [2][3][7][8]. This limitation can be overcome by turning toward sub and ultra harmonic. At high acoustic pressures, microbubbles have the characteristic that they are able to generate, under specific conditions of frequency, sub harmonic 1 0
2 f , and ultra harmonics
0 0
3 5
( , ,...)
2 f 2 f that cannot be generated by tissue [1][3][4][8][9]. Sub and ultra harmonic imaging are based on the detection of 1 0
2 f and 0 0
3 5
( , ,...)
2 f 2 f respectively. That can be done using narrowband transducers centered around these frequencies for reception [5][10].
In order to enhance image quality, optimal post-processing techniques can be used to extract sub and ultra harmonics instead of narrowband transducers. NARMAX models like Hammerstein model showed a high efficiency in modeling nonlinear systems [11]. Thus, the polynomial Hammerstein model can be used to model microbubble signals. However, as it is a power series model, it is unable to model sub and ultra harmonic components. Until now, there is no simple mathematical model to formulate and extract sub and ultra harmonics. Although sub harmonic modeling was discussed in [12] where the proposed method was limited to modeling and it was unable to extract sub and ultra harmonics apart from harmonics.
In this paper we propose an original contribution based on the use of a modified Hammerstein filter. This technique, that is easy to implement, enable to model and extract sub harmonic and first ultra harmonic components. To validate our new simple approach we propose to test it over artificial signals backscattered by microbubbles.
Thanks to the Lebanese National Council for Scientific Research (CNRSL) for funding.
II. MATERIALS AND METHODS
The dynamics of microbubbles were simulated by solving the Rayleigh-Plesset modified equation using Hoff's method [12]. The incident wave sent to the microbubble was a sinusoidal signal apodized with a Hanning window, of frequency f0 = 4
MHz, 1.6 MPa pressure, and 32 cycles. Under the previous frequency and pressure conditions, the oscillation of the microbubble is nonlinear including sub- and ultra-harmonics [8]. The backscattered signal was sampled at fs = 36 MHz.
The parameters of microbubbles were resting radius r0 = 2
µm, shell thickness dSe = 4 nm, shear modulus GS = 50 MPa
and shear viscosity η = 0.8 Pa.s.
A. Hammerstein model
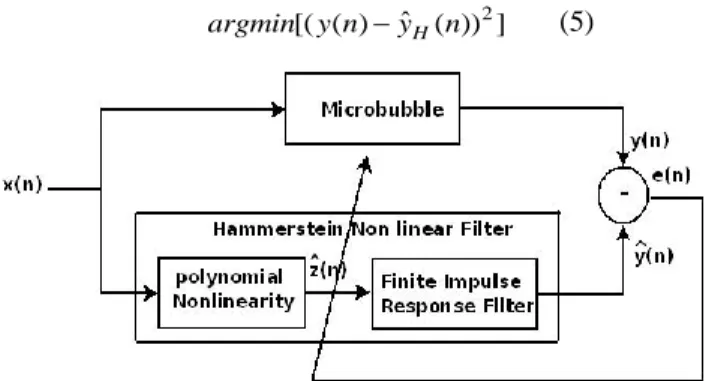
Polynomial Hammerstein model is a special type of nonlinear filters in which a staticnonlinear system is followed by a dynamic linear system [13]. The nonlinear system is approximated by a polynomial function. The linear part is a finite impulse response (FIR) filter. The blockdiagram of Hammerstein model was shown in Fig.1.
Let x n( )and y n( ) be the input and the output signal respectively of the nonlinear system. z nˆ( )was the unavailable internal signal.
The Hammerstein model HH( , )p m of order
p
and memorym
can be described by the following equation:, ( )[ ( ) ) ( ] ˆ p m H H x y n n (1)
Equation (1) could be expressed from an intermediate of
ˆ ( ) z n as follows:
0 ˆ ˆ( ) m H i i y n bz n i
(2) with
1 ˆ ( ) p l l l z n c x n
. The internal signal ˆz n
cannot be measured, but it can be eliminated from the equation, by substituting its value in (1). We got:
1 0 ( ) ˆ p m H l i l i l n c b n y x i
(3)where bi and clare the coefficients of the FIR filter and the polynomial function respectively. We limited our study to the Hammerstein model
(3, )
m
, regarding the limited bandwidth of existing transducers:
2
3 1 2 3 0 ˆ [ ( ) ( )] m i i y n b c x n i c x n i c x n i
(4)The coefficients bi andclwere obtained by minimizing the mean square error between the two signals y n( )andyˆ ( ) H n :
2
ˆ [( ( ) H( )) ] argmin y n y n (5)
Figure 1. Identification of the nonlinear system of microbubble with Hammerstein model.
Equation (4) can be written in a matrix form: . YX (6) Where:
[ 1 2 1 ] Y y y y N m Where N is the signal length1 2 3 1 [c b1 1 c b1 2 ... c b1 m] 2 [c b2 1 c b2 2 ... c b2 m] 3 c b3 1 c b3 2 ... c b3 m
1 (1) ( ) ( 1) x m x X x N x N m
2 2 2 2 2 (1) ( ) ( 1) x m x X x N x N m
3 3 3 3 3 (1) ( ) ( 1) x m x X x N x N m 1 2 3 X X X X was calculated by the least square method :
1
. ) .X .Y
T T
X X
Where det(XT. )X 0. The modeled signal was:
ˆ .
Y X (7)
B. Modified Hammerstein Model
Standard Hammerstein model is dedicated to model harmonics only. We proposed to introduce some modifications
to model and extract the sub- and ultra-harmonic frequencies, through modulation and demodulation.
The corresponding output sequence of our modified Hammerstein model (3,1, )
2 m , where 1
2 represents the order of sub and ultra harmonics, could be written as follows:
(3, , )1 2ˆ
SUHm[ ( )]
y n
H
x n
(8)The solution that we proposed consists of two parts:
1 1 (3, , ) (3, ) (3, , ) 2m[ ( )] m[ ( )] 2m[ ( )] H SUH x n H x n HSU x H n (9)
One part for harmonic modeling:
(3, )
ˆ ( )H Hm[ ( )]
y n H x n (10)
and another part for sub and ultra harmonic modeling:
1 (3, , )
2
ˆSU( ) SU m[ ( )]
y n H x n (11)
The reconstructed microbubble signal was then:
ˆ( ) ˆH(n) yˆSU( )n
y n y (12)
C. Numerical Procedure
The numerical procedure was written with Matlab (Mathworks, Natick, MA, USA). It included the following steps:
1) Modeling of integer harmonics: it was the standard Hammerstein of order 3 and memory 𝑚 chosen to minimize the relative mean square error (RMSE). The obtained signal was given by (10).
2) Modeling of sub and ultra harmonics of order 1 2:
a) The analytic signaly na( ), whose spectrum contained only positive frequencies, is modulated by multiplying it by an exponential having a frequency 0
2 f
. The modulated signal was then: 0 mod (2 ) 2 ( ) ( ) f j n a a y n y n e (13) With:
( )
( )
[ ( )]
ay n
y n
j
y n
, (14)where
[ ( )]
y n
was the Hilbert transform of y n( ). From a spectral point of view, modulation shifted the spectrum byf
0/ 2. Indeed, if the spectrum of y n( ) includedf
0/ 2and f0, then the spectrum ofmod( ) a y n will be composed of 0 0 0 ( ) 2 2 f f f and 0 0 0 3 ( ) 2 2 f f f components. mod( ) a y n
was composed of shifted sub and ultra –harmonics instead of harmonics.
b) A standard Hammerstein model identified the real part of the modulated signal
mod ( a ( )) R y n by minimizing the following relation: 2 2 ˆ [( ( ) ( )) ] argmin y n y n (15) The Hammerstein model extracted the harmonic components around kf0 (
k
is an integer) which were initially the sub- and ultra-components. The modeled signal became:2
ˆ ( ) Hm[ ( )].
y n V x n (16)
c) The analytic signal ˆ ( )2
a
y n was demodulated with a frequency 0
2 f
that shifted the harmonic components as well as the sub- and ultra-harmonic components back to their original positions.
The demodulated signal became: 0 mod ( 2 ) 2 2 2
ˆ
( )
ˆ
( )
.
ade a f j ny
n
y
n e
(17)The double application of the Hilbert transform introduced a negative sign. For this reason, we multiplied the demodulated signal by ej . In order to obtain the positive and negative frequencies of the demodulated signal we considered its real part. We obtained: mod mod 2 2 ˆ ( ) (ˆ ( )) (ˆ ( )) ade ade j SU y n R y n e R y n (18)
The final modeled signal y nˆ( ) was obtained by adding the two signals yˆ ( )H n and yˆ ( )SU n as given (12). The different steps of the modified model are shown in Fig .2.
In the step 2.b), the modulated signal was modeled with Hammerstein model. We obtained the coefficients vector
mod
such that:
mod ( mod(1)) ... ... ( mod( 1))
T
a a a
Figure 2. Identification of the nonlinear microbubble with the modified Hammerstein model.
Coefficients of first order1, were associated with the fundamental component which was in fact the shifted sub harmonic signal. Demodulation was done to obtain sub-harmonic signal: mod 1. 1 . SHX E (20) where : E
e(1) e(2) ... e N( m1)
, with 0 ( 2 ) 2 ( ) f j n e n e .First ultra harmonic was calculated by the same way, using second order coefficients2:
mod
1 2. 2 .
UH X E (21)
The relative mean square error RMSE used to evaluate the accuracy of our method was given by:
2 2 ˆ( ) ( ) ( ) y n y n RMSE y n (22)
where y nˆ( )was the reconstructed signal by the model and
( )
y n was that backscattered by the microbubble. III. RESULTS
We tested standard Hammerstein (3, )m model and modified Hammerstein(3,1, )
2 m , using simulated microbubbles signals. Microbubble was insonified with the sine wave described above.
To validate the adequacy of our model, we applied Hammerstein model to identify a system that generated harmonics only. Fig. 3 (a) shows the variation of the RMSE between the output signal of the system and that modeled with the 2 Hammerstein models, standard and modified, as a function of the model memory. Fig. 3 (b) shows the variation of the RMSE between the microbubble signal with sub and ultra harmonics, and the modeled signals with the 2 models.
Figure 3. Variation of the RMSE achieved with the standard model (3, )m and the modified model (3,1, )
2 m (a) In presence of harmonics only, (b) In
presence of sub and ultra harmonics.
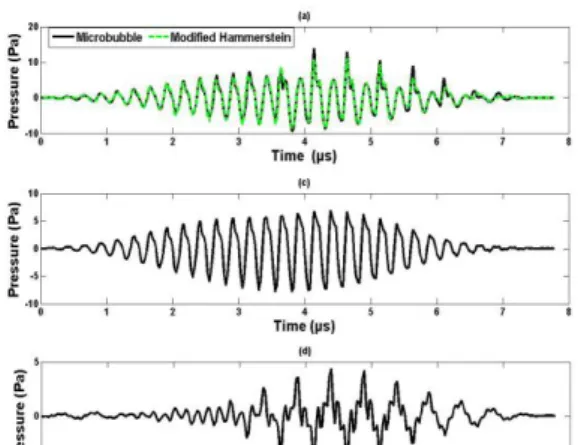
In presence of sub and ultra harmonics, minimum RMSE was obtained form20. Fig. 4(a) shows the backscattered signal y n( ) and that modeled by the modified Hammerstein model(3,1, 20)
2 versus time. Fig. 4(b) shows harmonic signal
ˆ ( )H
y n obtained with the standard model(3, 20), and Fig. 4(c) shows the sub- and ultra-harmonic signal yˆ ( )SU n extracted with the modified model(3,1, 20)
2 . Fig. 5 shows the spectra of the various signals presented in Fig. 3.
Fig.5 (a) shows the sub harmonic signal and Fig.5 (b) shows its spectrum. Fig.5(c) shows first ultra harmonic signal and Fig.5 (d) shows its spectrum.
Quantitatively, table 1 shows a comparison between the
RMSE achieved with the standard and modified Hammerstein
models.
IV. DISCUSION
Results showed that standard and modified Hammerstein models, could model and extract ultra and ultrahamonics components of microbubbles signals. In Fig.3 (a) the variation of RMSE was the same with the two models. That means that the two models had the same performances in modeling harmonics. In presence of sub and ultra harmonics, our modified model ensured a decrease in the RMSE, with minimum for m20.
For higher memories it became less effective. Figures showed that the modified Hammerstein model was able to model microbubbles signal in presence of sub and ultra harmonics. Sub and ultra harmonics of order 0
2
n
f were extracted apart of harmonic signal. These results overcame the weakness of the standard Hammerstein model which modeled harmonics only.
Figure 4. (a)Backscattered signal by the microbubble and the reconstructed signal with modified Hammerstein model, (b) Harmonic signal, (c) sub and ultra harmonic signal.
Figure 5. Spectrum of the Backscattered signal by the microbubble and (a) that of the reconstructed signal with modified Hammerstein model, (b) that of the harmonic signal, (c) that of the sub and ultra harmonic signal .
The second important result was the capacity to reconstruct the sub-harmonic signal and the first ultra-harmonic signal that could be used to make sub- and ultra-harmonic imaging to produce high contrast images.
The modified Hammerstein provided an additional gain of
3.6 dB ( 12.5 ( 7.9) ) compared the standard model. V. CONCLUSION
A modified Hammerstein model was proposed in this paper. This model serves to extract sub and ultra harmonics components from nonlinear microbubbles signals. It allowed also the reconstruction of sub harmonic and first ultra harmonic
that could be used to make sub and ultra harmonic imaging. This work could be completed by modify the model to be
able to extract sub- and ultra-harmonics of different orders.
Figure 6. (a)Sub harmonic signal extracted with modified Hammerstein model, (b) Sub harmonic spectrum, (c) First ultra harmonic signal, (d) First ultra harmoinc spectrum.
TABLE I. RELATIVE MEAN SQUARE ERRORS MAY RMSE BETWEEN THE SIGNAL BACKSCATTERED BY THE MICROBUBBLE AN THAT MODELED WITH THE
VOLTERRA MODEL, AND BETWEEN THE SIGNAL BACKSCATTERED BY THE MICROBUBBLE AND THAT MODELED WITH THE MODIFIED HAMMERSTEIN MODEL.
Hammerstein
Standard Modified
RMSE(dB) -7.9 -12.5
REFERENCES
[1] W. T. Shi, F. Forsberg, J. S. Raichlen, L. Needleman, and B.B. Goldberg, “Pressure Dependance of Subharmonic Signals from Contrast Microbubbles”, Ultrasound Med Biol, vol. 25, no. 2, 275-283, February 1999.
[2] C. Kollmann, “New Xonographic Techniques for Harmonic Imaging Underlying Physical Principles,” Eur J Radiol, vol. 64, no. 2, pp. 164-172, Nov. 2007.
[3] P. M. Shankar, P. D. Krishna, Krishna, and V. L. Newhouse, “Advantages of Subharmonic Over Second Harmonic Backscatter for Contrast-To-Tissue Echo Enhancement,” Ultrasound Med Biol, vol. 24, no. 3, pp. 395–399, March 1998.
[4] T. G. Leighton, The Acoustic Bubble. London, UK: Academic Press, Juin 1994, 978-0-12-441921-6.
[5] G. Bhagavatheeshwaran, W. T. Shi, F. Forsberg, and P. M. Shankar, “Subharmonic Signal Generation from Contrast Agents in Simulated Neovessels,” Ultrasound Med Biol, vol. 30,no. 2, pp. 199-203,February 2004.
[6] S. Qin and K. W. Ferrara, “The Natural Frequency of Nonlinear Oscillation of Ultrasound Contrast Agents in Microvessels,” Ultrasound Med Biol, vol. 33, no. 7, pp. 1140–1148, July 2007. [7] M. Averkiou,“Tissue Harmonic Imaging,” vol. 2, pp. 1563–1572, 2000. [8] F. Forsberg, W. T. Shi, and B. B. Goldberg, “Subharmonic Imaging of
Contrast Agents,” Ultrasonics, vol. 38, no. 1-8, pp. 93–98, Mar. 2000. [9] R. Basude and M. Wheatley, “Generation of Ultraharmonics in
Surfactant Based Ultrasound Contrast Agents: Use and Advantages. “ Ultrasonics, vol. 39, pp. 437–444, 2001.
[10] J. Eisenbrey, J. Dave, J.K. andx Halldorsdottir, D. Merton, P. Machado, J. Liu, C. Miller, J. Gonzalez, S. Park, S. Dianis, C. Chalek, K. Thomenius, D. Brown, V. Navarro, and F. Forsberg, “Simultaneous grayscale and subharmonic ultrasound imaging on a modified commercial scanner,”Ultrasonics, vol. 51, pp. 890–897, 2011.
[11] E. Eskinet, S. Johnson, and L. W.L., “Use of hammerstein models in identification of nonlinear systems.” AIChE Journal, vol. 37, no. 2, pp.255-268, , February 1991.
[12] L. Hoff, Acoustic Characterization of Contrast Agents for Medical Ultrasound Imaging. Boston, USA: Kluwer Academic, 2001.
[13] Umoh and T. Ogunfunmi, “An affine projection-based algorithm for identification ofnonlinear hammerstein systems.” Signal Processing, vol. 90, pp. 2020–2030, 2010.
[14] K. E. Morgan, J. S. Allen, P. A. Dayton, J. E. Chomas, A. L. Klibaov, and K. W. Ferrara, “Experimental and theoretical evaluation of microbubble behavior: Effect of transmitted phase and bubble size.” IEEE T Ultrason Ferr, vol. 47, no. 6, pp. 1494–1509, November 2000. [15] P. Marmottant, S. van der Meer, M. Emmer, M. Versluis, N. de Jong, S.
Hilgenfeldt, and D. Lohse, “A model for large amplitude oscillations of
coated bubbles accounting for buckling and rupture,” J Acoust Soc Am, vol. 118, no. 6, pp. 3499–3505, December 2005.
[16] M. Mleczko, M. Postema, and G. Schmitz, “Discussion of the Application of Finite Volterra Series for the Modeling of the Oscillation Behavior of Ultrasound Contrast Agents,” Appl Acoust, vol. 70, no. 10, pp. 1363–1369, October 2009.
[17] F. Giri and E.-W. Bai, Block-oriented Nonlinear System Identification, ser. Lecture Notes in Control and Information Sciences, F. Giri and E.-W. Bai, Eds. Springer, 2010, vol. 404.
[18] O. Boaghe and S. Billings, “Subharmonic Oscillation Modeling and MISO Volterra Series ,” IEEE Transactions On Circuits And Systems, vol. 50, vol. 50, no. 7, pp. 877–884, July 2003.