Publisher’s version / Version de l'éditeur:
Magnetic Resonance Imaging, 28, 5, pp. 753-766, 2010-04-15
READ THESE TERMS AND CONDITIONS CAREFULLY BEFORE USING THIS WEBSITE. https://nrc-publications.canada.ca/eng/copyright
Vous avez des questions? Nous pouvons vous aider. Pour communiquer directement avec un auteur, consultez la première page de la revue dans laquelle son article a été publié afin de trouver ses coordonnées. Si vous n’arrivez pas à les repérer, communiquez avec nous à PublicationsArchive-ArchivesPublications@nrc-cnrc.gc.ca.
Questions? Contact the NRC Publications Archive team at
PublicationsArchive-ArchivesPublications@nrc-cnrc.gc.ca. If you wish to email the authors directly, please see the first page of the publication for their contact information.
NRC Publications Archive
Archives des publications du CNRC
This publication could be one of several versions: author’s original, accepted manuscript or the publisher’s version. / La version de cette publication peut être l’une des suivantes : la version prépublication de l’auteur, la version acceptée du manuscrit ou la version de l’éditeur.
For the publisher’s version, please access the DOI link below./ Pour consulter la version de l’éditeur, utilisez le lien DOI ci-dessous.
https://doi.org/10.1016/j.mri.2010.02.001
Access and use of this website and the material on it are subject to the Terms and Conditions set forth at
Characterization of cryoinjury-induced infarction with manganese-and-gadolinium-enhanced MRI and optical spectroscopy in pig hearts
Yang, Yanmin; Sun, Jiankang; Gervai, Patricia; Gruwel, Marco L.; Jilkina, Olga; Gussakovsky, Eugene; Yang, Xi; Kupriyanov, Valery
https://publications-cnrc.canada.ca/fra/droits
L’accès à ce site Web et l’utilisation de son contenu sont assujettis aux conditions présentées dans le site LISEZ CES CONDITIONS ATTENTIVEMENT AVANT D’UTILISER CE SITE WEB.
NRC Publications Record / Notice d'Archives des publications de CNRC:
https://nrc-publications.canada.ca/eng/view/object/?id=0f9a8683-e9e3-445b-a66d-c6172979949d https://publications-cnrc.canada.ca/fra/voir/objet/?id=0f9a8683-e9e3-445b-a66d-c6172979949d
Characterization of cryoinjury-induced infarction with manganese-and
gadolinium-enhanced MRI and optical spectroscopy in pig hearts
Yang, Yanmin; Sun, Jiankang; Gervai, Patrica; Gruwel, Marco L.; Jilkina,
Olga; Gussakovsky, Eugene; Yang, Xi; Kupriyanov, Valery
Abstract
PurposeTo investigate progression of cryoinjury in pigs using contrast-enhanced magnetic resonance imaging (MRI) as well as optical spectroscopy and imaging.
Methods
Cryoinjury was produced in 16 pigs in vivo and investigated using Gd-and Mn-enhanced MRI, optical imaging/spectroscopy and histology in acute and chronic setting up to 4 weeks after the injury.
Results
(1) Acute cryoinjury resulted in formation of a lesion with a severely reduced rate of sub-epicardial indocyanine green (intravascular optical flow tracer) passage. In vivo late
Gd-enhanced MRI showed a 10 mm deep hypointense area that was surrounded by a hyperintense rim while ex vivo Mn-enhanced MRI (MEMRI) detected a homogenous hypointense zone. Histological and spectroscopic examination revealed embolic erythrocytes blockages within the cryolesion with a thin necrotic rim neighboring the normal myocardium. (2) Chronic 4-week cryoinjury was characterized by uniform Gd-enhancement, whereas MEMRI revealed reduced Mn2+enhancement. Histological examination showed replacement of the cryoinjured
myocardium by scar tissue. Conclusions
Acute cryoinjury resulted in formation of a no-reflow core embolized by erythrocytes and surrounded by a rim of necrotic tissue. Upon injury progression, the no-reflow zone shrunk and was completely replaced with scar tissue by 4 weeks after injury.
Keywords: Acute and chronic cryoinjury; No-reflow embolization; Gd-enhanced MRI; Mn-enhanced MRI; Optical imaging and spectroscopy
1. Introduction
Myocardial infarction (MI) is one of the leading causes of morbidity and mortality in North America [1]. Currently, most animal models of MI are based on occlusion of the left anterior descending (LAD) or left circumflex (LCx) coronary artery [2] and [3]. However, occlusion of
either artery frequently incurs life-threatening arrhythmias and/or congestive heart failure with high mortality [2] and [3]. Alternatively, in large animals, diagonal branches of LAD or/and LCx can be occluded, reducing the experimental morbidity and mortality due to smaller
ischemic/infarction area [4] and [5]. However, the occlusion model often produces an MI with non-uniform pathological features such as infarction size, shape, and location due to innate variability of the coronary artery vasculature [6] and [7]. Although heterogeneity of infarction area is a common feature of this disease in humans, there is still need in more homogenous and reproducible infarction-like injury for studies of cardiac regeneration and repair.
A more recent addition to the cardiac researcher's options for establishing experimental MI in animals has been ablative technologies, which include cryoinjury. Hass and Taylor first reported the use of cryothermia for the creation of cardiac lesions in 1948 [8]. The advantage of
myocardial cryolesion includes the provision of a homogenous lesion with a sharply demarcated border [8], [9], [10], [11], [12], [13], [14], [15], [16] and [17] and nonarrhythmogenicity [17]. Electrophysiologically, cryothermia-induced myocardial lesions behave like an inert plug with no disruption of surrounding cardiomyocytes activation. Surgery- or catheter-based interventions associated with this technology (named cryoablation) have been established for the treatment of refractory cardiac arrhythmias [14]. It has also been observed that (1) the shape of cryolesion depends on the features of the cryoprobe, (2) the extent of injury is mainly determined by the exposure time and (3) the same subsequent pathological progression destiny (i.e., scar tissue formation) as ischemia-induced MI occurs. Although direct coronary occlusion to produce MI is more physiological, it is difficult to reproduce a series of MIs with consistent morphological features and sizes. As a result, some research groups began to employ cryoinjury to establish an experimental MI model [9] and [12].
Indeed, it has been proven that this method is a valuable alternative to coronary occlusion-based methods when small animals were used such as mice [18] and [19], rats [20] and [21] and rabbits
[22] and [23] because of the size and deeper location of their major coronary arteries. In larger animals, cryoinjury eliminates influence of variable extent of innate collateral coronary branches (e.g., in dogs) [6] which is a major determinant of ischemia and scar size in the occlusion models
[7]. Hence, cryoinjury was also gradually employed in a dog MI study [24].
As the coronary vasculature of pig hearts has minimal collateral branches [25], [26], [27], [28],
[29] and [30], it has long been deemed as one of the best animal models for studying human coronary artery diseases. Similar to other research groups [2], [3], [25], [26], [27], [28], [29] and
[30], our previous studies also successfully employed this model using near infrared spectroscopic imaging [31], [32], [33] and [34]] and contrast-enhanced MRI [5] and [35]. However, occlusion of coronary artery branches results in variable lesion size/volume due to variation in arterial branching patterns in respective pigs. Even in twins, there still exists
inconsistency with respect to the dominance pattern of the coronary blood supply [36]. Secondly, coronary artery occlusion usually cannot produce a myocardial lesion with a clearly defined epicardial border. Consequently, implantation of cell-, gene- or protein-based regenerative agents into the so-called ischemic/MI “border zone” is difficult to accurately apply.
Magnetic resonance imaging (MRI) including contrast-enhanced MRI is a valuable tool for assessment of progression of cardiac infarction [37], [38], [39], [40], [41], [42], [43], [44] and
[45]. Commonly used T1-type contrast agents include gadolinium (Gd3+) and manganese (Mn2+) chelates [42]. Gadopentate dimeglumine (Gd-DTPA) is an extracellular-type agent, which is used to monitor tissue perfusion during its first pass across the myocardial tissue and identify scar tissue, which is enhanced (late enhancement) due to increase in its distribution volume and retention [40]. However late enhancement cannot easily distinguish between necrosis and extracellular edema [43] and [44] in ischemia-reperfusion setting.
In contrast, Mn2+is an intracellular-type contrast agent, which enhances viable tissue visibility
[42] and [45]. In the excitable tissues such as heart and brain, the major route for Mn2+entry is via plasmalemmal voltage-gated Ca2+channels owing to the similarity of biochemical properties of Ca2+and Mn2+and limited ion-selectivity of these channels [46] and [47]. Normal
cardiomyocytes can retain Mn2+for hours due to inability of Ca2+efflux transporters to extrude it and its subsequent uptake by mitochondria [45] and [48]. Our recent study indicated that
Mn2+could highlight ischemic areas due to impaired perfusion, while in the chronically infarcted areas, in which perfusion was partially reestablished by host repairing processes, significantly enlarged extracellular volume becomes the major determinant governing the equilibrium contrast distribution [5].
Presently, the studies of cryoinjured myocardium with MRI-based methods are scarce [49]. In this work we will describe details of the cryoinjury model in pig hearts studied with Gd-DTPA (in vivo) and MnCl2 (ex vivo) as MR contrast agents. The principal findings of this study are as follows: (i) cryoinjury in the pig heart is a feasible method to create MI without peri-and post-operative mortality; (ii) cryoinjury results in immediate myocardial necrosis and microvascular embolic blockage and (iii) progression of cryolesion is similar to those induced by coronary occlusion-reperfusion.
2. Materials and methods
2.1. Animal preparationAll pigs used in this study received humane care in compliance with the guidelines of the Canadian Council on Animal Care. Domestic pigs with two body weight ranges were selected for this study. Pigs selected for the chronic (i.e., 4-week observation) myocardial cryolesion group had an initial body weight of 15–18 kg, as they would gain an extra 10–12 kg during 4-week follow-up period. Whereas, the body weight of pigs allocated for the acute and 1-4-week chronic study was approximately 30 kg to make it comparable with 4-week chronic pigs. Following 12-hour fasting pigs were pre-medicated with ketamine (22 mg/kg i.m.), midazolam (0.33 mg/kg, i.m.) and atropine (0.05 mg/kg, i.m.). Anesthesia was achieved with isoflurane inhalation (2–4%), after which mechanical ventilation with 50/50 mixture of oxygen/medical air containing 1.75–2.5% isoflurane was established via tracheal intubation.
2.2. Groups and protocol
Sixteen pigs were divided into three groups: an acute group 1 (n=6), a 7-day chronic group 2 (n=4) and a 28-day chronic group 3 (n=6). To expose the left ventricle (LV), median sternotomy was performed for pigs in the acute group, whereas thoracotomy between the left fourth and fifth
intercostal space was chosen as an alternative option for those in the chronic groups. After the pericardium was incised longitudinally, an LV epicardial area (anterior+lateral wall), free from large coronary vessels, was selected to undergo freezing. The tip of an aluminum rod (Φ=2.5 cm), which had been cooled with liquid nitrogen, was pressed firmly by the weight of the freezing device on the selected epicardial area for 2 min to produce cryoinjury.
In chronic experiments (Groups 2 and 3), a butterfly needle was inserted into the ear vein and connected to a saline infusion bag to allow delivery of medication whenever necessary. Typically, the antiarrhythmic drug, lidocaine was injected prior to cryoinjury at the doses of 1 mg/kg to reduce incidence of arrhythmias and fibrillation. A three-lead electrocardiogram (ECG) attached to the pig's chest and a pulse oximeter probe attached to the tail were used to monitor ECG signal and blood oxygenation. Prior to closing pericardium and chest, 4 ml of
Na-hyaluronate (30 mg/ml) was added to the intrapericardial space to reduce adhesions between pericardium and epicardium and the pig was returned to the animal facility for recovery. Pain killer patches (buprenorphine released at 10 μg/h) and antibiotic (enrofloxicin, 5 mg/kg) injections were provided for the first 3–5 recovery days.
In acute terminal experiments (at 1.5 h, 7 and 28 days) blood pressure (BP) was continuously monitored via a catheter placed inside the right carotid artery and connected to a pressure transducer (Cobe Labs, Lakewood, CO, USA) interfaced with a recorder (Grass Polygraph, Grass Instrument, Quincy, MA, USA). The first derivative of BP wave was used as a signal triggering the near-infrared (NIR) camera acquisitions (vide infra). The same catheter was used for indocyanine green (ICG) injection and withdrawal of arterial blood samples, which were analyzed for PaO2, hemoglobin/hematocrit, PaCO2, pH, glucose, lactate and ions using a blood-gas analyzer (Critical Care Xpress, Nova Biomedical, Walham, MA, USA). Levels of PaO2, pH and glucose were maintained within the normal range (i.e., pH: 7.4, PaO2: >130 mm Hg, glucose: 5.8 mM).
After the chest was closed, in vivo Gd-MRI was performed inside a 3-T MR scanner for pigs in the 4-week chronic group, whereas, ex vivo Mn-enhanced MRI was the final imaging procedure carried out on isolated beating hearts inside a 7T magnet for all pigs.
2.3. Measurements
2.3.1. In vivo Gd-enhanced MRI
All in vivo Gd-MRI studies for pigs in the 4-week chronic group (n=6) were carried out using a clinical 3T scanner (Trio, Siemens, Erlangen, Germany) with a cardiac phased-array coil immediately ( 2.5 h) and at the first, second and fourth week after cryoinjury. Scout images in two-and four-chamber views were acquired to determine the LV short axis, based on which Gd-enhanced MRI was then carried out to assess myocardial perfusion, cell viability and scar formation. After bolus injection of Gd-DTPA (0.2 mmol/kg iv), we acquired cardiac images every 2 min over a 30-min period. The T1-weighted FLASH short-axis images (12–13 slices, 5–6 mm thick) were acquired using ECG gating to the diastolic phase before (baseline image) and after injection of the agent. Typical acquisition parameters were: TR=2 RR intervals, TI=500 ms, TE/flip angle=1.7 ms/20°, pixel size=1.2×1.7 mm2, matrix size=256×256.
In some experiments, first-pass Gd enhancement kinetics was investigated. In this case, low-dose Gd-DTPA bolus (0.05 mmol/kg) was injected, followed 1 min thereafter by high-dose (0.15 mmol/kg) bolus injection to assess late Gd enhancement. In this case, fast T1-weighted images were acquired using Turbo-FLASH sequence every heart beat from two 10-mm slices separated by 10-mm gap, one of which contained cryoinjured area. Typical acquisition parameters: TR=206 ms, TI=120 ms, TE/flip angle=1.89 ms/12°, pixel size 2.8×2.8 mm2; matrix size=96×128.
2.4. Ex vivo Mn-enhanced MRI (MEMRI)
Ex vivo Mn-MRI studies on beating hearts has been detailed in our previous article [5]. Briefly, the pig hearts (acutely or chronically injured) were arrested with ice-cold cardioplegic solution (Krebs-Henseleit buffer (KHB) with high 20 mM [K+]) and excised. A cannula for directing perfusate to the heart was secured into the ascending aorta via the right brachiocephalic artery, whereas a catheter for monitoring perfusion pressure and arterial perfusate composition was placed into the left brachiocephalic artery. An additional catheter was placed into the coronary sinus to sample venous effluent during perfusion. A latex balloon was placed and secured in the LV cavity and then filled with H2O containing 1 mM MnCl2. Then, the hearts were perfused with a 1:1 mixture of low potassium KHB containing NaHCO3 (25 mM), NaCl (118 mM), KH2PO4 (1.2 mM), CaCl2 (1.75 mM), MgSO4 (1.2 mM), glucose (11 mM) and bovine serum albumin (6 g/L), and autologous blood containing some cardioplegic solution (used to arrest the heart) yielding hematocrit of 12–15% and normal K+ levels (4.5–5.5 mM). beta-Blocker, S-propranolol (0.5 μM), antiarrythmic drug, lidocaine (15 μM) and antibiotic (penicillin G, 100,000 U/L) were also added to the solution to provide stable mechanical function. The perfusate was aerated in a membrane oxygenator (Cobe, Japan) with 95% O2/5% CO2, and the flow rate was adjusted to 1.5 ml/g per minute with a roller pump (Sarns, Ann Arbor, MI, USA). Left ventricular end-systolic (LVESP), end-diastolic (LVEDP) and perfusion (aortic) pressure (PP) as well as heart rate (HR) were monitored continuously via water-filled tubing connecting LV balloon to the pressure transducer interfaced with the physiological recorder. Typical baseline functional parameters of isolated pig heart were: LVESP=70–90 mmHg, LVEDP=0–5 mmHg, PP=55–65 mmHg and HR=90–120 bpm.
The isolated heart and two fixed reference tubes containing H2O (long T1) and H2O+10 mM CuSO4 (short T1) were placed in the perfusion chamber within the Helmholtz coil. The chamber was moved to the center of a horizontal 7-T magnet (Magnex, Oxford Industrial Park, Yarnton, UK), interfaced to a Bruker Biospec console. Cardiac images were obtained using a conventional spin-echo sequence (FOV=16×16 cm2, TE=8 ms, matrix size 128×128). Signal acquisition was gated by the first derivative of the LV pressure (dP/dt) which provided acquisition during every second heartbeat for T1 weighting (TR of 600–800 ms). The ratio of the intensities in the
reference tubes (CuSO4 to H2O) served as an index of the degree of T1 weighting and was about 5. Six 8-mm-thick slices separated by 2-mm gaps were obtained. After acquisition of the baseline image, 0.2 mM MnCl2 was added to the perfusion reservoir, and serial images were taken every 5 min over a 30–45-min period. Signal intensities for each slice were normalized to those of the H2O reference.
Diffuse reflectance spectra of pig hearts in vivo or slices of isolated hearts in the range of 400– 1100 nm with a 1 nm resolution were acquired every 2 min using an integration time of 0.1 s, averaging 120 acquisitions. Broadband visible/NIR light from a fiber optic illuminator Oriel (model 77501, Stratford, CT, USA) was transmitted to the epicardium of open heart through one arm of a bifurcated fiber optic bundle. The common illumination/collection probe tip was placed in contact with the epicardium, or slice cut, perpendicular to its surface, which allowed the collection of predominantly diffuse reflected light through the other arm of the fiber bundle to the spectrometer (Control Developments Inc. model PDA-512, South Bend, IN, USA). The light from the light source was delivered by a single fiber optic filament of 650-μm diameter. The reflected light collection was provided by 36 fiber optic filaments of 15-μm diameter randomly surrounding the illuminating filament.
A pseudo-optical density (POD) for any given wavelength was calculated according to the formula:
(1)POD=−log(Is/I0)where Is is the intensity of the light diffusely reflected by the sample in the back direction and I0 is the intensity of the light reflected by Spectralon standard [50].
2.6. NIR imaging of ICG kinetics in pig hearts in vivo
Images of diffusely reflected light at 800 nm were acquired sequentially with the first derivative of blood pressure (dBP/dt) as gating trigger, every heart beat ( 0.7 s cardiac cycle) following a bolus injection of 3 ml of ICG solution (5 mg/ml) using a charge-coupled device-array camera equipped with a liquid crystal tunable filter (LCTF, Cambridge Research and Instrumentation, Woburn, MA, USA). As a result, a POD at 800 nm calculated according to the Eq. (1), was available for each of the 256×256 pixels. The reflectance standard (Kodak Gray Card, Eastman Kodak, Rochester, NY, USA) was placed in front of the heart at the end of the experiments to measure the reference image to obtain I0 values for Eq. (1). This setup allowed us to keep the illumination patterns and the distance to the standard similar to those for the heart in each individual experiment. The NIR imaging system was custom built at the Institute for
Biodiagnostics, NRC, Winnipeg, Canada [31] and [51]. The wavelength of 800 nm corresponds to the maximal light absorption of indocyanine green (ICG) dye. Respectively, the images for each time point represent “instantaneous” ICG distribution across the heart surface, which reflects the 2-dimensional coronary flow distribution over the sub-epicardium.
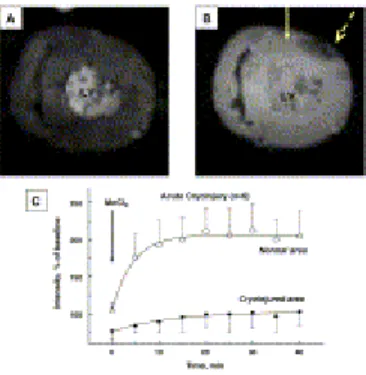
The gating of image acquisition allowed (1) to capture each image at a diastolic phase, (2) to avoid the effect of the heart beating movement and (3) to collect images with pre-determined time increment and, respectively, to determine a NIR image kinetics of ICG. After image collection in each kinetic experiment, normal and cryoinjured areas on the heart surface were visually determined and defined as two regions of interest (ROI) using a Matlab program. The POD values of all pixels inside each ROI were averaged and plotted versus time resulting in the ICG kinetics in normal and cryoinjured hearts (see Fig. 1D for example).
Fig. 1.
(A) Photograph of the anterior side of acutely cryoinjured pig heart in vivo (10 min after cryoinjury). (B) Optical reflectance spectra of cryoinjured and normal myocardium. (C) NIR imaging of subepicardial ICG distribution in cryoinjured heart. Red and dark-blue pseudo-colors correspond to the highest and lowest ICG absorption, respectively. (D) Corresponding first-pass kinetics of ICG passage through normal and injured sub-epicardium.
2.7. Post-mortem analysis
At the end of the ex vivo MEMRI experiment, perfusion was switched to blood-free KHB. For pigs in the acute group, blue intracellular near-infrared (NIR) dye IR676 (Aldrich-Sigma, St Louis, MO, USA) was infused over a 30 s period at 2 ml/s to maintain its concentration in the range 7–9 μM, followed by a 30 s washout of the extracellular dye. Subsequently, perfusion was terminated, the hearts' ventricles were filled with alginate-based cast mixture and the hearts were sliced (5–10 mm thick) along the short axis using custom build slicing device. Afterwards, slices were analyzed by point spectroscopy and stained in 2% triphenyltetrazolium chloride (TTC) solution in phosphate buffer (pH 7.4) for 15 min at 22°C to determine infarct and normal areas by means of photography.
Following fixation in formalin, a standard fixative for biological tissue [52], remote and injured tissue samples ( 0.5 cm3) were further embedded in paraffin for subsequent slicing towards 5-μm-thin sections with a microtome. The sections were then mounted onto slides for subsequent staining with hematoxyline and eosin (H and E), which is the most widely used staining combo for histopathological diagnosis [52] and [53]. The staining method involves sequential use of the basic dye hematoxylin and acidic counterpart eosin. Hematoxylin tinges intracellular basophilic structures into blue-purple hue, which usually involves the areas containing nucleic acids such as the ribosomes, the nucleus and the cytoplasmatic regions rich in RNA. In contrast, eosin stains acidic structures bright pink, which generally consist of intracellular or extracellular proteins. As a result, most of the cytoplasm is pink [43]. In addition, erythrocytes are stained brighter red, as compared with cardiomyocytes, with eosin [54].
The data are expressed as the mean±S.D. for continuous variables. Statistical analysis was
performed using statistical software (Statistica 6.0, Statsoft, Tulsa, OK, USA). Two-way analysis of variance for repeated measurements was used. Nominal variables were analyzed by
nonparametric test. A difference was considered significant if the probability value was less than .05.
3. Results
The reaction of the myocardium to the cryothermal injury followed a pattern of host-mediated repair of necrotic tissue through the stage of healing with collagen deposition and scar formation
[8], [9], [10], [11], [12], [14], [15] and [16]. None of the animals developed acute congestive heart failure and/or life-threatening arrhythmia after cryoinjury.
3.1. Acute myocardial cryoinjury
The LV myocardium suffering 2-min cryoinjury thawed over a period of 5 min, assumed a cyanotic epicardial appearance (Fig. 1A) with an accompanying visually discernible absence of contraction. The shape of the cryolesion was semicircular in cross-section with an averaged diameter of 29.7±1.3 mm and an averaged depth of 9.2±0.9 mm. In all groups, optical point spectroscopy showed a significant increase in absorption peaks at 550 and 580 nm corresponding to both hemoglobin and myoglobin (Hb+Mb) and a change in their relative intensities
characteristic of Hb+Mb deoxygenation (Fig. 1B). The latter is also confirmed by the appearance of a deoxy-(Hb+Mb) peak in the NIR range at 760 nm after cryoinjury. Interestingly, small met-Hb peak at 660 nm also emerged, which is characteristic of blood coagulation and formation of thrombi. NIR imaging of fast kinetics of the passage of the intravascular flow tracer, ICG, which was performed in Group 1 revealed a circular sub-epicardial area of reduced ICG absorbance at 800 nm (Fig. 1C). The maxima of the first pass ICG kinetics were observed at 5–6 s after dye appearance in the LV wall blood (15 s post-injection, Fig. 1D).
In the acute cryoinjury phase ( 2.5 h, Group 3) serial acquisitions of short-axis MR images after injection of Gd-DTPA revealed a thin hyperintense rim surrounding the hypointense core. The highest signal intensity (SI) appeared in the first acquired image, 2 min after administration of the contrast agent (Fig. 2A). Meanwhile, the SI within the remote myocardium was also higher than that in the hypointense area, but such difference is much less than that between the
hyperintense rim and the hypointense core. Thereafter, the SI in both remote and the
hyperintense myocardium began to decrease. As the rate of decline was much faster within the remote area, no significant difference in SI could be observed between this area and the
cryoinjured core on the late images (10 min post-Gd, Fig. 2B). The respective time courses of SI decline within both the normal myocardium and the hyperintense rim were approximated by the monoexponential decay function:
(2)SI=SImin+ΔSImax·e (−t/t1)where SIminis the lowest SI, ΔSImax is maximal intensity decrement (at
t → ∞), and t1 is a time constant (Fig. 2D). As the kinetics of SI decrease was much faster in the remote myocardium (t1 5 vs. 14 min in the hyperintense rim), the optimal time window for distinguishing the remote, hyperintense rim and hypointense core was very short and was best observed between 4 and 6 min after injection of Gd-DTPA (the dotted rectangle in Fig. 2D). In
addition, during the 30 min acquisition of Gd-enhanced MR images, the hyperintense rim expanded gradually replacing the hypointense core (Fig. 2A--C), which indicates slow diffusion of contrast agent into the cryolesion. In some experiments, first-pass Gd-enhancement kinetics was investigated (Fig. 2E) using low dose Gd-DTPA (0.05 mmol/kg) injection. Intensity of LV blood and normal LV tissue reached maximum approximately 5 s after the contrast agent entered the LV ventricle. Cryoinjured tissue (black spot in Fig. 2A) did not show any significant
intensity increase. This pattern resembles first pass kinetics of optical contrast agent passage in the sub-epicardium (Fig. 1D).
Fig. 2.
Kinetics of Gd-enhancement development in MR images of short-axis cardiac slice in vivo following acute cryoinjury. (A) Early 2-min Gd enhancement. (B) Late 10-min Gd enhancement. (C) Thirty-minute Gd enhancement. (D) Time course of Gd enhancement in normal,
hyperintense and hypointense cryoinjured areas. The lines are the least square mono-exponential fits of SI decays according to Eq. (2). The optimal time window to distinguish normal,
hyperintense and hypointense myocardium is between 4 and 8 min after Gd-DTPA
administration (indicated by dotted rectangle). (E) First-pass Gd enhancement kinetics. In this case, low-dose Gd-DTPA bolus (0.05 mmol/kg) was injected followed 1 min thereafter by high-dose (0.15 mmol/kg) bolus injection to assess late Gd enhancement. Fast T1-weighted images were acquired from 2 slices, one of which contained cryoinjured area.
Following optical measurements in vivo, pigs in the acute group underwent heart isolation and an ex vivo MEMRI study 1.5 h after cryoinjury. Serial images acquired every 5 min after MnCl2 administration revealed a gradual increase in SI in the remote myocardium and slower SI increase in a hypointense area corresponding to the histological location of cryoinjured
myocardium (Fig. 3A and B). The time courses of MnCl2 intensity enhancement in both normal and cryoinjured myocardium were fitted by the monoexponential function:
(3)SI=SI0+ΔSImax·[1−e (−t/t1)]where SI0is baseline intensity, ΔSImax is maximal intensity
intensity enhancement (ΔSImax/t1) in the cryoinjured myocardium were significantly lower (P<.01) than that in the remote myocardium (Fig. 3C and Table 1).
Fig. 3.
(A, B) Mn-enhanced MR short axis single-slice images of perfused pig heart following acute cryoinjury. (A) Baseline, prior to MnCl2 addition. (B) Twenty minutes after MnCl2 addition; solid arrow indicates normal myocardium and dashed arrow indicates cryoinjured myocardium. (C) Kinetics of SI enhancement following MnCl2 addition. The lines represent best mono-exponential fit by using Eq. (3).
Table 1. Kinetic parameters of manganese signal enhancement in normal and damaged areas of hearts after acute and chronic 4-week cryoinjury
Group/area ΔSImax, % t1, min ΔSImax/t1, %/min R2
ACUTE (n=6) 1. Control area 102±5.2 4.4±0.57 23.2±3.4 0.98 2. Cryoinjured 27±2.5 12.3±3.1 2.2±0.77 0.96 P vs. control <.001 NS <.01 CHRONIC 4-week (n=5) 3. Control area 89±2.7 5.3±0.42 16.8±1.6 0.996 4. Cryoinjured 17±4.5 4.2±2.9 4.1±2.2 0.78 P vs. control <.001 NS <.05
Mean±S.D. values are shown for ΔSImax and t1. The parameters were derived from the
monoexponential fit using Eq. (3). ΔSImax, maximal amplitude of signal increase normalized to the reference water signal amplitude; t1, time constant; ΔSImax/t1, the initial (maximal) rate of intensity increase. Data are reported for five of six hearts due to low quality of images for one heart caused by arrhythmias and gating problems. NS, not significant.
Finally, the isolated heart perfused with blood-free KHB underwent an ex vivo perfusion study to determine perfusion deficit, if any, with the cationic dye IR676 (deposit flow tracer). The short-axis slice across the acute cryolesion revealed cyanotic contusion-like cryoinjured
submyocardium, which contained increased amounts of oxy/deoxy-(Hb+Mb) and very little IR-676 (spectra in Fig. 4A), in contrast to normal myocardium with deoxy-Mb and a significant amount of IR-676. Presence of Hb and absence of IR-676 in the injured area reflects inability of blood-free perfusate to reach this area and remove red blood cells (RBC). This observation corroborated our in vivo data ([Fig. 1] and [Fig. 2]) showing greatly reduced perfusion of the cryoinjured area and embolization of vessels by RBC. A rim of optically lighter myocardium without contusion-like appearance (Fig. 4A) closely correlates with a hyperintense rim seen on early Gd-enhanced MR images (Fig. 2). Subsequent viability staining with TTC further proved that the myocardium in the rim was necrotic (Fig. 4B). However, results of TTC staining of the contusion-like portion of cryoinjury are not conclusive as this area is already intensely red thereby masking any possible red TTC staining. Optical point spectra of the slices shown in Fig. 4C helped to solve this problem. Complete deoxygenation of the surface Mb in normal areas indicated that myocytes were still metabolically active and capable to consume all oxygen that diffused across the slice surface. In contrast, the area of embolized cryoinjury contained significantly oxygenated (Hb+Mb), which implies the inability of this tissue to metabolize oxygen diffusing across the slice surface. Indeed, a microscopy study revealed coagulating cardiomyocytes necrosis and massive erythrocytes entrapment within this cardiac tissue (red staining in Fig. 4D).
Fig. 4.
(A) Short-axis slice of acutely cryoinjured myocardium prior to (A) and after TTC staining (C). Prior to slicing the heart was perfused with blood-free KHB buffer containing 7–9-μM deposit flow tracer cationic dye, IR676, which was taken up by cardiomyocytes in perfused areas. Optical spectra (B) show very little content of the dye in the embolized zone (bright-red, solid arrow) and higher-than-normal content of hemoglobin. (C) Staining of the same slice with TTC further accentuated the border rim separating normal and injured myocardium (dotted arrow). (D) H and E staining reveals massive microvascular entrapment of erythrocytes within the cryolesion and coagulative cardiomyocytes necrosis (original magnification ×40). Strictly for the
convenience of slicing the post mortem hearts, inert blue dental filler (alginate based) was used (visible in A and C).
3.2. Chronic myocardial cryoinjury
The cryoinjured myocardium subsequently experienced the same host-mediated healing process as ischemia–induced MI. Upon 1 week, the edge of the lesion began to be sharply demarcated by a rim of granulation tissue containing inflammatory cells (macrophages, lymphocytes,
fibroblasts), deposited collagen and newly formed capillaries, whereas the lesion close to the epicardium remained “intact,” as evidenced by remaining necrotic myocardium and entrapped erythrocytes (Fig. 5A–D). Four weeks later, the lesion was completely replaced by scar tissue (Fig. 5E–G).
Fig. 5.
(A–D) Macroscopic and microscopic features of a 1-week cryolesion in a pig heart. The central bright red spot seen in both epicardium (A) and subepicardium of short-axis slice (B) contained embolic erythrocytes (C). The white border zone was newly formed collagen tissue from host-mediated inflammatory repair (D). (E–G) Macroscopic and microscopic features of 4-week cryolesion in a pig heart. The cryolesion was almost completely replaced by scar tissue. The microscopic picture (G) showed both normal myocardium (upper left) and neighboring scar (lower right) (original magnification ×40).
Late Gd-enhancement at Weeks 1, 2 and 4 revealed the gradual vanishing of the hypointense core (Fig. 6A--C). The kinetic analysis of SI change within both remote and scar tissue in images acquired 4 weeks after cryoinjury showed that (1) SI maximized in both areas after 2-min
exposure to Gd-DTPA, (2) SI in the cryolesion was doubled relative to that in the remote
myocardium, (3) the decay time constant (t1) was much shorter for the remote myocardium than for the scar tissue (t1 5 vs. 27 min, respectively), which translated into maximized contrast enhancement in a time frame ranging from 4 to 12 min (Fig. 6D). In addition, the cryolesion size
measured from late enhancement MR images decreased significantly to 41±4.5% of the initial size during 4-week chronic infarction progression (Fig. 6E).
Fig. 6.
(A–C) Late enhancement short-axis MR images of a chronically cryoinjured pig heart after 10-min exposure to Gd-DTPA. The images correspond to weeks 1 (A), 2 (B) and 4 (C) post-injury; the solid arrow indicates the cryolesion. (D) Kinetics of signal intensity decay in normal and scar tissue after exposure to Gd-DTPA (0.2 mmol/kg) 4 weeks post cryoinjury. The lines represent least-square monoexponential fit (Eq. (2). The optimal time window for the largest difference in the SI (contrast) occurred between 4 and 14 min. (E) The gradual decrease in the relative
cryolesion volume measured from Gd-enhanced MR images. P<.01.
After isolation of the hearts following 4-week cryoinjury, MEMRI showed a relatively reduced intensity of scar tissue perhaps due to the absence of viable cardiomyocytes, which actively accumulated and retained Mn2+in normal areas (Fig. 7A, B). Kinetics analysis [Eq. (3)] showed considerable decrease in the maximal enhancement (ΔSImax, P<.01) and rates of intensity enhancement (ΔSImax/t1, P<.05) in the cryoinjured myocardium relative to the remote
myocardium (Fig. 7C and Table 1). The changes in ΔSImax were similar to those observed in the acute cryoinjury. However, there was a trend to shortening of the time constant and increase in the rate of enhancement (Table 1), which correlates with Gd enhancement kinetics showing better perfusion of scar tissue in comparison with acutely embolized tissue (cf. [Fig. 2] and [Fig. 6]). Chronic 1-week cryoinjury showed similar pattern of Mn distribution kinetics (not shown).
Fig. 7.
(A–C) Ex vivo Mn-enhanced MR images and SI kinetics in pig hearts 4 weeks post cryoinjury. (A) Baseline short-axis image. (B) Image acquired after 20-min exposure to MnCl2 (0.2 mM); solid arrow indicates normal myocardium, dotted arrow indicates chronic cryolesion. (C) Time course of signal intensity enhancement in both normal and injured areas after exposure to MnCl2. The lines represent mono-exponential least-square fits [Eq. (2), see text for detail].
3.3. Summary of major findings
(1) Acute cryoinjury (10–150 min): Freezing LV cardiac tissue for 2 min and subsequent thawing (5–10 min) resulted in formation of red-brown round-shaped spot on the epicardium, which appeared as a semicircular zone surrounded by a thin rim of whitish tissue on the short axis slices. The area showed signs of vascular embolization with RBC with the formation of a no/low-reflow region. Indicators were: (a) an increased Hb content detected by optical point spectroscopy both in vivo and post-mortem; (b) a slow first-pass in vivo kinetics of the optical and MR flow tracers (ICG and Gd-DTPA, respectively) and a reduced content of optical deposit flow tracer, IR676 in ex vivo experiments; (c) a considerable hypointense core zone on Gd-enhanced MR images surrounded by a thin hyperintense rim; (d) a hypointense area on Mn-enhanced ex vivo images; (e) a high RBC content in H and E stained samples of injured tissue. (2) Chronic cryoinjury (1–4 weeks): Gd-enhanced MRI revealed that the no-reflow core zone gradually reduced whereas the hyperintense zone increased upon injury progression over 1 and 2 weeks. After 4 weeks, the hypointense area was completely replaced by a hyperintense one, which was characterized by slower intensity decay upon Gd-DTPA washout relative to normal areas. The total size of injured area (hypointense+hyperintense) gradually decreased to
approximately 40% of initial over a 4-week period. Mn-enhanced ex vivo MRI showed a hypointense area 1 and 4 weeks post cryoinjury; the latter corresponded to a necrotic region not stained with TTC. H and E staining revealed gradual replacement of cellular material with collagen by the end of the 4-week period.
4. Discussion
Although cryoinjury-induced MI has been previously described in other animals [8], [9], [10],
[11], [12], [18], [19], [20], [21] and [22], this is the first report to outline the morphological and contrast-enhanced MRI features of cryoinjury-induced MI in pigs. Morphological variation of cryolesion in the present study significantly reduced as its feature depends mainly on exposure time and the cryoprobe tip-shape. Possible concern with the use of cryoinjury on the
myocardium is its potential negative influence on medium and small coronary vessels (artery and vein) and the blood inside them as it is difficult to find a “clean” LV epicardial area free from their passage. The potential danger is development of freezing-thawing-induced
thrombosis/embolism within such vessels leading to MI of downstream myocardium. However, such complications did not develop as Gd-enhanced MRI and NIR imaging did not show
perfusion deficits outside of the cryolesion, which is in agreement with previous publications [9],
[10] and [11]. In addition, NIR imaging revealed patent vessels (both artery and vein) within the cryolesions using indocyanine green as intravascular flow tracer.
4.2. Imaging techniques and data interpretation
We used in vivo and post-mortem imaging and spectroscopic methods to characterize perfusion and viability of cryoinjured cardiac tissue. Gd-enhanced MRI provided kinetics of contrast development ([Fig. 2] and [Fig. 6]), from which early and late enhancement data were extracted. The former revealed no-reflow phenomenon, which was most pronounced in acute cryoinjury (Fig. 2), less pronounced after 1–2 weeks and was not observed following 4-week cryoinjury (Fig. 6A--C). Severe flow restrictions were revealed in both the first pass kinetics (Fig. 2E, <1-s time resolution) and slow kinetics with low time resolution (2 min, Fig. 2D). Partial flow
limitations in the hyperintense zone, could be inferred from slower washout kinetics ([Fig. 2] and
[Fig. 6], upper curves). Late enhancement data showed hyperintense infarction areas, which could also contain edematous tissue with higher distribution volume for Gd-DTPA during acute cryoinjury (Fig. 2A–C). Mature 4-week infarctions (Fig. 6C) were composed of predominantly necrotic tissue with high collagen and low cellular contents (Fig. 5G). Furthermore, fast Gd-enhancement development (<2 min) and slower kinetics of its decay in the 4-week infarction area (Fig. 6D) imply substantial perfusion of this tissue. Note that the time courses and derived time constants are only semi-quantitative perfusion measures as they are not directly related to local Gd contents due to its high initial blood concentration, which results in nonlinear relations between concentration, relaxivity and signal enhancement.
Kinetics of Mn enhancement revealed abnormal areas as hypointense zones in acutely (Fig. 3C) and chronically (Fig. 7C) cryoinjured hearts. The nature of abnormality (hypoperfusion or necrosis) could not be identified without help of enhanced MRI (see above). However, Gd-enhanced MRI might potentially overestimate the necrotic zone due to the similarity between edema and necrosis in terms of increased extracellular space. Necrotic regions determined by MEMRI hardly could involve viable edematous tissues. In mature 4 weeks post cryoinjury infarctions, perfused scar tissue is dominant and should not significantly differ in size on Gd- and Mn-enhanced images.
It is not easy to compare cryoinjury sizes determined using different contrast agents because of the thicker slices in MEMRI images (10 vs. 5 mm in Gd-images) and the systolic vs. diastolic phases imaged with Mn and Gd, respectively. Theoretically, thicker slices increase the error in
determination of infarction size towards overestimation due to the round shape of the injury, which does not occupy the entire thickness of border slices. On the other hand, the necrotic zone may somewhat shrink during systole, which is a usual configuration of isovolumic Langendorff-perfused heart used in the MEMRI study.
Optical spectroscopy provided information on chemical changes related to cryoinjury in the sub-epicardial layer ( 5 mm thick) in vivo (Fig. 1B) and in cardiac slices post-mortem (Fig. 4C). Dramatic increase in 560- and 580-nm absorbance (Fig. 1B) in vivo and ex vivo (Fig. 4C) results from deposition of red blood cells rich in Hb in the LV capillaries as the content of Mb,
intracellular hemoprotein with nearly identical optical properties, cannot increase in a few minutes. This explains dark-red color of acutely cryoinjured tissue seen in short axis slices (Fig. 4A) and is confirmed by histological analysis showing red staining of RBC (Fig. 4D). In the short-axis slices, these changes in cryoinjured area co-existed with complete deoxygenation of Hb+Mb in normal areas (Fig. 4C). The latter indicates that normal tissue is still metabolically active 15–30 min after cardiac arrest as cell respiration consumes all oxygen that diffuses through the tissue-air interface.
NIR imaging of the first-pass kinetics of the intravascular NIR flow tracer ICG revealed slower passage of ICG through the subepicardium of cryoinjured region (Fig. 1D) confirming
substantial flow deficit observed with Gd-enhanced MRI. The data are semiquantitative in nature and allow evaluation of perfusion values relative to normal area using, e.g., upslope velocities (see [31]). Furthermore, “equilibrium” levels of ICG absorbance (30–60 s) permit estimation of
relative circulating blood volume in the LV wall sub-epicardium. Measurements of
“equilibrium” ICG concentration in blood samples enable conversion of tissue absorbance in absolute concentration due to its linear relation to absorbance if the light path length is known. A disadvantage of this method in comparison with MRI is an “interrogation” volume limited to the sub-epicardium ( 5 mm thick) of anterior side of the left and right ventricles.
4.3. Mechanism of cryoinjury
Acute injury is mainly induced by microembolization of the core area with RBC ([Fig. 1] and
[Fig. 3]), due most probably to swelling of vascular endothelial cells and myocytes resulting in narrowing of capillary lumen and “plugging” by RBC. The thin rim of cryoinjured area, which appears light on photographs of slices both prior to and after TTC staining and hyperintense on Gd-enhanced MRI images, perhaps corresponds to perfused tissue where the permeability of the myocyte cell membrane was compromised and extracellular (vasogenic) edema occurred. Although the mechanism of the rim formation is unknown, possibly, it is related to the
temperature gradient between the epicardium and deeper LV layers. For instance, the rim could correspond to the border layer with a near freezing temperature where ice crystals coexist with liquid water. Qualitatively, these features resemble the development of ischemia-reperfusion damage, with the formation of a core of poorly perfused tissue (no reflow phenomenon) [37],
[38], [39], [41], [55], [56], [57] and [58]. This implies that cell death in the no-reflow core of cryoinjury is at least partially ischemic in addition to possible direct injury induced by ice crystals and osmotic destruction of myocytes [59]. Upon cryoinjury progression, the no-reflow zone was gradually replaced by scar tissue (Fig. 5A–C), which virtually did not differ from that
formed after occlusion infarction. Interestingly an MRI study of the progression of injury evoked by radiofrequency ablation [60] showed patterns similar to that observed for cryoinjury.
Shrinkage of infarction size determined as a sum of hyper-+hypointense areas can be partially explained by reduction of edema at least during the first 2 weeks after cryoinjury (by 40%, Fig. 5E). However, we cannot exclude recovery of reversibly damaged tissue in the infarction periphery.
5. Conclusions
Acute cryoinjury produces a cryolesion with a large no/low-reflow core embolized with erythrocytes and thin a rim of perfused necrotic tissue that resembles ischemia-reperfusion injury. This implies that at least partially, ischemia contributes to cell death in addition to ice crystal formation and osmotic damage. Progression of chronic cryoinjury is characterized by gradual replacement of embolized tissue with perfused scar and decrease in the lesion size due to innate process of tissue repair, which involves reduction of edema and possibly regeneration. Cryoinjury is a convenient model for studies of regenerative therapies delivered
intrapericardially due to its similarity to occlusion infarction, epicardial interface and clearly demarcated borders.
Acknowledgments
The authors thank Dr. Yijun Fan for preparation of tissue samples and their H and E staining. Excellent technical support by Allan Turner, Lori Gregorash, Shelly Germscheid, Rachelle Mariash and Bo Xiang during animal surgeries, in vivo and ex vivo experiments is greatly appreciated.
References
[1] D. Lloyd-Jones, R. Adams, M. Carnethon, S.G. De, T.B. Ferguson and K. Flegal et al., Heart Disease and Stroke Statistics-2009 Update. A Report From the American Heart Association Statistics Committee and Stroke Statistics Subcommittee, Circulation (2008).
[2] G.A. Krombach, S. Kinzel, A.H. Mahnken, R.W. Gunther and A. Buecker, Minimally invasive close-chest method for creating reperfused or occlusive myocardial infarction in swine,
Invest Radiol 40 (2005), pp. 14–18.
[3] M. Maeng, U.M. Mortensen, J. Kristensen, S.B. Kristiansen and Andersen, Hypothermia during reperfusion does not reduce myocardial infarct size in pigs, Basic Res Cardiol 101 (2006), pp. 61–68.
[4] H.K. Haider, L. Ye, S. Jiang, R. Ge, P.K. Law and T. Chua et al., Angiomyogenesis for cardiac repair using human myoblasts as carriers of human vascular endothelial growth factor, J
[5] Y. Yang, M.L. Gruwel, J. Sun, P. Gervai, X. Yang and V.V. Kupriyanov, Manganese-enhanced MRI of acute cardiac ischemia and chronic infarction in pig hearts: kinetic analysis of enhancement development, NMR Biomed 22 (2009), pp. 165–173.
[6] M.P. Maxwell, D.J. Hearse and D.M. Yellon, Species variation in the coronary collateral circulation during regional myocardial ischaemia: a critical determinant of the rate of evolution and extent of myocardial infarction, Cardiovasc Res 21 (1987), pp. 737–746.
[7] T. Miura, D.M. Yellon, D.J. Hearse and J.M. Downey, Determinants of infarct size during permanent occlusion of a coronary artery in the closed chest dog, J Am Coll Cardiol 9 (1987), pp. 647–654.
[8] G.M. Hass and C.B. Taylor, A quantitative hypothermal method for the production of local injury of tissue, Arch Pathol 45 (1948), pp. 563–580.
[9] J.A. Jensen, J.C. Kosek, T.K. Hunt, W.H. Goodson III and D.C. Miller, Cardiac cryolesions as an experimental model of myocardial wound healing, Ann Surg 206 (1987), pp. 798–803.
[10] E.M. Mikat, D.B. Hackel, L. Harrison, J.J. Gallagher and A.G. Wallace, Reaction of the myocardium and coronary arteries to cryosurgery, Lab Invest 37 (1977), pp. 632–641.
[11] T. Misaki, S.P. Allwork and H.H. Bentall, Longterm effects of cryosurgery in the sheep heart, Cardiovasc Res 17 (1983), pp. 61–69.
[12] C.E. Murry, R.W. Wiseman, S.M. Schwartz and S.D. Hauschka, Skeletal myoblast transplantation for repair of myocardial necrosis, J Clin Invest 98 (1996), pp. 2512–2523.
[13] S. Ohkawa, D.B. Hackel, E.M. Mikat, J.J. Gallagher, J.L. Cox and W.C. Sealy, Anatomic effects of cryoablation of the atrioventricular conduction system, Circulation 65 (1982), pp. 1155–1162.
[14] A.C. Skanes, G. Klein, A. Krahn and R. Yee, Cryoablation: potentials and pitfalls, J
Cardiovasc Electrophysiol 15 (2004), pp. S28–S34.
[15] C.B. Taylor, C.B. Davis Jr., G.F. Vawter and G.M. Hass, Controlled myocardial injury produced by a hypothermal method, Circulation 3 (1951), pp. 239–253.
[16] H. Watanabe, S. Eguchi, H. Miyamura, J. Hayashi, Y. Aizawa and Y. Wakiya et al., Histologic findings of long-term cryolesions in a patient with ventricular tachycardia,
Cardiovasc Surg 4 (1996), pp. 409–411.
[17] L. Wetstein, R. Mark, A. Kaplan, H. Mitamura, C. Sauermelch and E.L. Michelson, Nonarrhythmogenicity of therapeutic cryothermic lesions of the myocardium, J Surg Res 39 (1985), pp. 543–554.
[18] L. Barandon, T. Couffinhal, P. Dufourcq, P. Alzieu, D. Daret and C. Deville et al., Repair of myocardial infarction by epicardial deposition of bone-marrow-cell-coated muscle patch in a murine model, Ann Thorac Surg 78 (2004), pp. 1409–1417.
[19] N. Derval, L. Barandon, P. Dufourcq, L. Leroux, J.M. Lamaziere and D. Daret et al., Epicardial deposition of endothelial progenitor and mesenchymal stem cells in a coated muscle patch after myocardial infarction in a murine model, Eur J Cardiothorac Surg 34 (2008), pp. 248–254.
[20] M.M. Ciulla, R. Paliotti, S. Ferrero, P. Braidotti, A. Esposito and U. Gianelli et al., Left ventricular remodeling after experimental myocardial cryoinjury in rats, J Surg Res 116 (2004), pp. 91–97.
[21] R.K. Li, Z.Q. Jia, R.D. Weisel, F. Merante and D.A. Mickle, Smooth muscle cell transplantation into myocardial scar tissue improves heart function, J Mol Cell Cardiol 31 (1999), pp. 513–522.
[22] B.Z. Atkins, M.T. Hueman, J. Meuchel, K.A. Hutcheson, D.D. Glower and D.A. Taylor, Cellular cardiomyoplasty improves diastolic properties of injured heart, J Surg Res 85 (1999), pp. 234–242.
[23] M.D. Sage, Ultrastructural alterations to myocytes and associated microvascular functional changes at lateral margins of developing experimental myocardial infarcts, J Mol Cell Cardiol 18 (Suppl 4) (1986), pp. 17–21.
[24] G.B. Hunt, R.B. Chard, D.C. Johnson and D.L. Ross, Comparison of early and late dimensions and arrhythmogenicity of cryolesions in the normothermic canine heart, J Thorac
Cardiovasc Surg 97 (1989), pp. 313–318.
[25] A.S. Most, D.O. Williams and R.W. Millard, Acute coronary occlusion in the pig: effect of nitroglycerin on regional myocardial blood flow, Am J Cardiol 42 (1978), pp. 947–953.
[26] H. Fujiwara, M. Ashraf, S. Sato and R.W. Millard, Transmural cellular damage and blood flow distribution in early ischemia in pig hearts, Circ Res 51 (1982), pp. 683–693.
[27] R.E. Patterson and E.S. Kirk, Analysis of coronary collateral structure, function, and ischemic border zones in pigs, Am J Physiol 244 (1983), pp. H23–H31.
[28] D.J. Hearse, C.A. Muller, M. Fukanami, L.H. Opie and D.M. Yellon, Regional myocardial ischemia: characterization of temporal, transmural and lateral flow interfaces in the porcine heart, Can J Cardiol 2 (1986), pp. 48–61.
[29] P. Gonschior, G.M. Gonschior, P.F. Conzen, J. Hobbhahn, A.E. Goetz and K. Peter et al., Myocardial oxygenation and transmural lactate metabolism during experimental acute coronary stenosis in pigs, Basic Res Cardiol 87 (1992), pp. 27–37.
[30] D. Sahni, G.D. Kaur, H. Jit and I. Jit, Anatomy and distribution of coronary arteries in pig in comparison with man, Indian J Med Res 127 (2008), pp. 564–570.
[31] V.V. Kupriyanov, S. Nighswander-Rempel and B. Xiang, Mapping regional oxygenation and flow in pig hearts in vivo using near-infrared spectroscopic imaging, J Mol Cell Cardiol 37 (2004), pp. 947–957.
[32] V.V. Kupriyanov, D.M. Manley and B. Xiang, Detection of moderate regional ischemia in pig hearts in vivo by near-infrared and thermal imaging: effects of dipyridamole, Int J
Cardiovasc Imaging 24 (2008), pp. 113–123.
[33] D.M. Manley, B. Xiang and V.V. Kupriyanov, Visualization and grading of regional ischemia in pigs in vivo using near-infrared and thermal imaging, Can J Physiol Pharmacol 85 (2007), pp. 382–395.
34] S.P. Nighswander-Rempel, V.V. Kupriyanov and R.A. Shaw, Regional cardiac tissue
oxygenation as a function of blood flow and pO2: A near-infrared spectroscopic imaging study, J
Biomed Opt 054004 (2006), p. 11.
[35] V.V. Kupriyanov, B. Xiang, J. Sun, O. Jilkina and B. Kuzio, Imaging of ischemia and infarction in blood-perfused pig hearts using 87Rb MRI, Magn Reson Med 49 (2003), pp. 99– 107.
[36] A.M. Frings, B. Mayer, W. Bocker, C. Hengstenberg, D. Willemsen and G.A. Riegger et
al., Comparative coronary anatomy in six twin pairs with coronary artery disease, Heart 83
(2000), pp. 47–50.
[37] J.A. Lima, R.M. Judd, A. Bazille, S.P. Schulman, E. Atalar and E.A. Zerhouni, Regional heterogeneity of human myocardial infarcts demonstrated by contrast-enhanced MRI. Potential mechanisms, Circulation 92 (1995), pp. 1117–1125.
[38] G.L. Raff, W.W. O'Neill, R.E. Gentry, A. Dulli, K.G. Bis and A.N. Shetty et al.,
Microvascular obstruction and myocardial function after acute myocardial infarction: assessment by using contrast-enhanced cine MR imaging, Radiology 240 (2006), pp. 529–536.
[39] C.E. Rochitte, J.A. Lima, D.A. Bluemke, S.B. Reeder, E.R. McVeigh and T. Furuta et al., Magnitude and time course of microvascular obstruction and tissue injury after acute myocardial infarction, Circulation 98 (1998), pp. 1006–1014.
[40] J. Vogel-Claussen, C.E. Rochitte, K.C. Wu, I.R. Kamel, T.K. Foo and J.A. Lima et al., Delayed enhancement MR imaging: utility in myocardial assessment, Radiographics 26 (2006), pp. 795–810.
[41] K.C. Wu, R.J. Kim, D.A. Bluemke, C.E. Rochitte, E.A. Zerhouni and L.C. Becker et al., Quantification and time course of microvascular obstruction by contrast-enhanced
echocardiography and magnetic resonance imaging following acute myocardial infarction and reperfusion, J Am Coll Cardiol 32 (1998), pp. 1756–1764.
[42] M.H. Mendonca-Dias, E. Gaggelli and P.C. Lauterbur, Paramagnetic contrast agents in nuclear magnetic resonance medical imaging, Semin Nucl Med 13 (1983), pp. 364–376.
[43] R.M. Judd, C.H. Lugo-Olivieri, M. Arai, T. Kondo, P. Croisille and J.A. Lima et al., Physiological basis of myocardial contrast enhancement in fast magnetic resonance images of 2-day-old reperfused canine infarcts, Circulation 92 (1995), pp. 1902–1910.
[44] R.S. Pereira, F.S. Prato, G. Wisenberg and J. Sykes, The determination of myocardial viability using Gd-DTPA in a canine model of acute myocardial ischemia and reperfusion, Magn
Reson Med 36 (1996), pp. 684–693.
[45] M.F. Wendland, Applications of manganese-enhanced magnetic resonance imaging (MEMRI) to imaging of the heart, NMR Biomed 17 (2004), pp. 581–594.
[46] D.R. Hunter, R.A. Haworth and H.A. Berkoff, Cellular manganese uptake by the isolated perfused rat heart: a probe for the sarcolemma calcium channel, J Mol Cell Cardiol 13 (1981), pp. 823–832.
[47] Y.J. Lin and A.P. Koretsky, Manganese ion enhances T1-weighted MRI during brain activation: an approach to direct imaging of brain function, Magn Reson Med 38 (1997), pp. 378–388.
[48] C.E. Gavin, K.K. Gunter and T.E. Gunter, Manganese and calcium efflux kinetics in brain mitochondria. Relevance to manganese toxicity, Biochem J 266 (1990), pp. 329–334.
[49] E. Kustermann, W. Roell, M. Breitbach, S. Wecker, D. Wiedermann and C. Buehrle et al., Stem cell implantation in ischemic mouse heart: a high-resolution magnetic resonance imaging investigation, NMR Biomed 18 (2005), pp. 362–370.
[50] A. Springsteen, Standards for the measurement of diffuse reflectance – an overview of available materials and measurement laboratories, Anal Chim Acta 380 (1999), pp. 379–390.
[51] S.P. Nighswander-Rempel, S.R. Anthony, J.R. Mansfield, M. Hewko, V.V. Kupriyanov and H.H. Mantsch, Regional variations in myocardial tissue oxygenation mapped by near-infrared spectroscopic imaging, J Mol Cell Cardiol 34 (2002), pp. 1195–1203.
[52] M.E. Titford and M.G. Horenstein, Histomorphologic assessment of formalin substitute fixatives for diagnostic surgical pathology, Arch Pathol Lab Med 129 (2005), pp. 502–506.
[53] M. Titford, The long history of hematoxylin, Biotech Histochem 80 (2005), pp. 73–78.
[54] D.F. King and L.A. King, A brief historical note on staining by hematoxylin and eosin, Am
[55]R.A. Kloner, C.E. Ganote and R.B. Jennings, The “no-reflow” phenomenon after temporary
coronary occlusion in the dog, J Clin Invest 54 (1974), pp. 1496–1508.
[56] R.A. Kloner, R.E. Rude, N. Carlson, P.R. Maroko, L.W. DeBoer and E. Braunwald, Ultrastructural evidence of microvascular damage and myocardial cell injury after coronary artery occlusion: which comes first?, Circulation 62 (1980), pp. 945–952.
[57] S.H. Rezkalla and R.A. Kloner, No-reflow phenomenon, Circulation 105 (2002), pp. 656– 662.
[58]T. Reffelmann and R.A. Kloner, The “no-reflow” phenomenon: basic science and clinical
correlates, Heart 87 (2002), pp. 162–168.
[59] R.J. Carpenter III and G.G. Snyder III, Cryosurgery: theory and application to head and neck neoplasia, Head Neck Surg 2 (1979), pp. 129–141.
[60] T. Dickfeld, R. Kato, M. Zviman, S. Lai, G. Meininger and A.C. Lardo et al.,
Characterization of radiofrequency ablation lesions with gadolinium-enhanced cardiovascular magnetic resonance imaging, J Am Coll Cardiol 47 (2006), pp. 370–378.