HAL Id: cirad-00699335
http://hal.cirad.fr/cirad-00699335
Submitted on 25 May 2012HAL is a multi-disciplinary open access archive for the deposit and dissemination of sci-entific research documents, whether they are pub-lished or not. The documents may come from teaching and research institutions in France or abroad, or from public or private research centers.
L’archive ouverte pluridisciplinaire HAL, est destinée au dépôt et à la diffusion de documents scientifiques de niveau recherche, publiés ou non, émanant des établissements d’enseignement et de recherche français ou étrangers, des laboratoires publics ou privés.
Accounting methods for carbon credits: Impacts on the
minimum area of CDM forestry projects
Bruno Locatelli, Lucio Pedroni
To cite this version:
Bruno Locatelli, Lucio Pedroni. Accounting methods for carbon credits: Impacts on the minimum area of CDM forestry projects. Climate Policy, Taylor & Francis, 2004, 4 (2), pp.193-204. �cirad-00699335�
1
Accounting methods for carbon credits: impacts on the minimum
area of forestry projects under the Clean Development Mechanism
Bruno Locatelli
1*, Lucio Pedroni
2Accepted version of the article published in Climate Policy: Locatelli B., Pedroni L., 2004. Accounting methods for carbon credits : impacts on the minimum area of CDM forestry projects. Climate Policy 4(2): 193‐204. 1 CIRAD, Montpellier, France ; CATIE, Turrialba, Costa Rica 2 Global Change Group, CATIE, Turrialba, Costa Rica * Corresponding author (bruno.locatelli@cirad.fr)
2
Abstract
The Ninth Conference of the Parties (COP‐9) decided to adopt an accounting system based on expiring carbon credits to address the problem of non‐permanent carbon storage in forests established under the Clean Development Mechanism (CDM). This article reviews and discusses carbon accounting methods that were under consideration before COP‐9 and presents a model which calculates the minimum area that forest plantation projects should reach to be able to compensate CDM transaction costs with the revenues from carbon credits. The model compares different accounting methods under various sets of parameters on project management, transaction costs, and carbon prices. Model results show that under current carbon price and average transaction costs, projects with an area of less than 500 ha are excluded from the CDM, whatever accounting method is used. Temporary crediting appears to be the most favorable approach to account for non‐permanent carbon removal in forests and also for the feasibility of smaller projects. However, lower prices for credits with finite lifetimes may prevent the establishment of CDM forestry projects. Also, plantation projects with low risk of unexpected carbon loss and sufficient capacity for insuring or buffering the risk of carbon re‐emission would benefit from equivalence‐adjusted average carbon storage accounting rather than from temporary crediting.Keywords
Kyoto Protocol; Clean Development Mechanism; Non‐permanence; Forestry project; Carbon accounting; Small‐scale projectIntroduction
Carbon storage in forests is not permanent. After a finite residence time in vegetation and soil, it may be released into the atmosphere through respiration, decomposition, digestion, or fire. Nevertheless, it is generally accepted that temporary carbon removal by forests contributes to mitigating climate change. In Bonn (2001), the Kyoto Protocol negotiators had already agreed that atmospheric carbon removal by newly afforested or reforested landscapes has such a value for climate change mitigation that it should be awarded under the Clean Development Mechanism (CDM). In this context, we need to ask how to quantify the value of temporary carbon removal for climate change mitigation in comparison to the value of permanent greenhouse gas (GHG) emission reductions. This is the essence of the non‐ permanence problem. For Kyoto Protocol carbon accounting, non‐permanence is uniquely a problem of forestry projects in the CDM. Greenhouse gas (GHG) emission reductions achieved through CDM projects in the energy sector are assumed to be permanent because the energy supplied by these projects will never be demanded again (Chomitz, 2000a). The non‐permanence of carbon removals by forests of Annex I countries is not a problem for GHG emission accounting because these countries have assigned amounts of GHG emissions. Therefore, if carbon dioxide (CO2) is released from an Annex I forest, an equivalent amount of CO2 emissions is debited in the national GHG accounting book of that country. Similarly, when CO2 is removed by Annex I forests, the corresponding amounts of CO2 are credited to those countries. Since non‐Annex I countries do not have quantified emission limitations and reduction commitments, this type of national accounting cannot be made, and carbon removal in specific forestry projects must be assumed to be non‐permanent (Ellis, 2001). Before the ninth Conference of the Parties (COP‐9) decided how to address the non‐permanence problem, there were many suggestions on how to deal with this issue in CDM forestry projects. The leading paradigm was to address non‐permanence through specific carbon accounting methods. The IPCC Special Report on Land Use, Land‐Use Change and Forestry (LULUCF) describes at least three3 conceptually distinct accounting methods (IPCC, 2000). From the submissions that different countries presented to the UNFCCC Secretary, it appeared that Parties of the United Nations Framework Convention on Climate Change (UNFCCC) held different positions and interpretations regarding these accounting methods. In addition (Chomitz, 2000b), Colombia and, later, the European Union and other countries, advanced proposals regarding a temporary accounting regime, which received increasing support by the Parties of the Convention (UNFCCC, 2002). A temporary carbon accounting approach based on expiring temporary Certified Emission Reductions (tCERs) and long‐term CERs (lCERs) was finally adopted at COP‐9 (UNFCCC, 2004). In this article, we analyze the main accounting methods considered before the ninth Conference of the Parties (COP‐9, Milan, Italy, 1–12 December 2003).1 Carbon accounting methods have a strong impact on project viability and on the scale at which projects are benefiting from the CDM. The issuance of carbon credits, or Certified Emission Reductions (CERs), as these are called under the CDM, is the last stage of a project development sequence that requires many investments that are clearly above business‐as‐usual practices in forest plantation entrepreneurship. They include additional costs at the stages of project design, negotiation, validation, monitoring, verification, and issuance of carbon credits (Aukland et al., 2002; PCF, 2000; Vine et al., 1999). These so called ‘transaction costs’ reduce the attractiveness of the CDM (Michaelowa et al., 2003). They are independent of carbon accounting methods, but the number and price of credits that can be awarded to the projects are very dependent on the accounting method used. The question of the scale at which projects are viable for the CDM is relevant from at least three points of view. The first is equity. If only large‐scale projects would turn out to be feasible, many countries, and in particular small community forestry projects, would be excluded from the CDM. The second is the impacts on local livelihoods, biological diversity, and the local environment (Smith and Scherr, 2002; Orlando et al., 2002). Plantation projects may bring positive impacts on sustainable development but not in all situations. Large‐scale projects are believed to be particularly prone to having negative impacts on local livelihoods, biological diversity, and the local environment. The third is leakage. Large‐ scale projects may inundate local, regional, and even global markets with their forest‐derived products and therefore lower the prices of those products. This might discourage forest entrepreneurship at other locations, where new forests would have been established in the absence of such large projects. The aim of this article is to show the impact of accounting methods of carbon credits on the minimum area at which forest plantation projects would start to benefit from the CDM. First, the article reviews the most discussed accounting methods that were under consideration before COP‐9, their possible interpretations, as well as their respective implications on the incentives for forestry projects and on the risks for climate mitigation. Then, the model used to calculate the minimum area of the projects is described and, finally, model results are presented and discussed.
Accounting methods
Accounting methods for carbon credits for CDM forestry projects have been summarized and discussed by IPCC (2000), Fearnside et al. (2000),), Ellis (2001), Marland et al. (2001), Dutschke (2001), Subak (2003) and in many submissions of Parties on the UNFCCC, among others. As the interpretations of these methods can vary, a review and discussion of each of them is required. Ton‐year The ton‐year accounting method (or equivalence‐factor yearly crediting) assumes that, to prevent the cumulative radiative forcing effect exerted by CO2 during its residence time in the atmosphere, it is 1 This article was written and submitted for publication before COP‐9.4 necessary to store an equivalent amount of CO2 as carbon in biomass or soil during a period of time called ‘equivalence time’ (Te) (Moura‐Costa and Wilson, 2000). To apply this method, an agreement on the value of Te is required. Proposed lengths vary between 50 and >100 years (Chomitz, 2000a; IPCC, 2000). The model developed for this study assumes 100 years, as proposed by Fearnside et al. (2000) since this timeframe has been adopted under the Kyoto Protocol to establish the CO2 equivalence of the global warming potentials of all other GHGs (UNFCCC, 1997). According to Equation (1), used to calculate ton‐year credits, one credit would be awarded to a project that stores 1 ton of CO2 during Te years as well as to a project that would store Te tons of CO2 during 1 year. The amount of ‘ton‐year’ credits issued during a given period of time is calculated as follows: (1) where Te is the ‘equivalence time’ as defined before, x is the beginning of a crediting period, and i is its duration in years. Instead of Te in the denominator, in some publications the nominator is multiplied by an equivalence factor (Ef), which is 1/Te. Ton‐year accounting can be considered safe for the climate under two conditions: the concept of equivalence between avoided emissions and temporary removal is accepted and defined, and credits are awarded ex post, that is after verifying that the carbon removals to be credited have effectively been stored. Only achieved climate change mitigation would be credited, and the maintenance of the verified carbon removals after credit issuance would therefore not be required. The greatest disadvantage of this accounting method is that projects would earn credits very slowly, which would make the CDM unattractive to them (Figure 1). Figure 1. Net removal (thin gray line; Mg CO2e/ha), cumulated ‘ton‐year’ credits (dotted line; Te = 100 years), and cumulated ACS credits (thick black line; Te = 100 years) for a 25‐year rotation plantation, 75‐year project Equivalence‐adjusted average carbon storage The equivalence‐adjusted average carbon storage (ACS) accounting method is based on the same theoretical assumption as the ‘ton‐year’ method (Moura‐Costa and Wilson, 2000). Carbon removal would be considered equivalent to permanent if the duration is at least equal to Te or fractioned for Te.
5 The difference from the ‘ton‐year’ method is that the total amount of credits is calculated as the average quantity of CO2 stored by the project during its lifetime. Since projects have different lifetimes, the average removal has to be adjusted for Te in the denominator of Equation (2) instead of the project lifetime n. This would make credits issued from projects of different durations fully comparable. The total amount of ACS credits would be calculated as follows: (2) where Te is the ‘equivalence time’ which is defined above, and n is the project duration in years. There are at least two interpretations of this method regarding the point in time at which credits should be awarded. The first interpretation is to assign credits in line with removals, that is to say that credits would be equal to removals, but once the total amount of credits is equal to the equivalence‐adjusted average removal, projects would not be able to issue additional credits. This approach is used by the model in this study. The second interpretation is to calculate credits in line with the running equivalence‐adjusted average removal, which would delay the issuance of credits compared with the first interpretation (Groen et al., 2003). In both interpretations, the way that credits are assigned to the projects is risky for the climate. ACS‐ accounting allows the projects to be credited very early in their lifetime, but credits are awarded for the amount of carbon that will be stored on average during the whole project duration according to projected growth, mortality, and harvest. Therefore, the method does not take into account that in the time interval between credit issuance and predicted project end (‘uncertainty time’) growth could turn out to be less than predicted, and that disturbances might occur that could revert carbon flows toward the atmosphere. Of course, ACS‐accounting generates credits earlier than the ‘ton‐year’ approach (Figure 1), which is more attractive to projects, unless credit calculations are discounted with a high rate to account for risks and uncertainties. Temporary crediting In contrast to the previous methods, temporary crediting does not result in credits that would be fungible with permanent credits issued from projects in the energy sector. Temporary crediting assigns a lifetime to the credits, thus fully recognizing the finite period of time that carbon can be stored in forests (Chomitz, 2000b). Once temporary credits expire, they have to be replaced by the buyer with new temporary or permanent credits. The original Colombian proposal of temporary crediting (UNFCCC, 2000) assigns a variable lifetime to the credits, depending on the period of time between credit issuance and tree harvesting or project expiration. This option is similar to the lCER method, proposed by COP‐9. Most likely, there would be a market preference for permanent and long‐lived credits, which would differentiate their price and would lower, in particular, the price of short‐term credits. International bookkeeping of transactions of credits with different lifetime and expiration date will certainly not be easy. Another issue is that credits with long lifetimes would be risky for the climate, since they would be awarded at the beginning of a projected lifetime. A variation of the Colombian proposal presented by the European Union (UNFCCC, 2002) is to assign the same lifetime to all temporary credits, for instance 5 years. Periodically, carbon removals would then be verified, and if they were still present at each verification, new temporary credits would be
6 issued accordingly or, respectively, the original credits would be renewed for additional 5‐year time periods. This option is called tCER in the COP‐9 decision. As Figure 2 shows, before COP‐9 different interpretations of this accounting method were possible. The different interpretations have implications for the climatic risk associated to the credits. A first interpretation (tCER1) is that credits would be awarded for the current removal at the time of verification. It assumes that on average the verified removals existed previous to the date of verification for a period of time half as long as the credit lifetime, and that they would be maintained for the other half. Figure 2. Removals and tCER credits (all interpretations): tCER1, current removal at verification time (year 20); tCER2, average removal during past verification interval (years 15–20); tCER3, minimum removal during past verification interval (years 15–20). For the sake of simplicity, credits issuance is only represented for year 20. The curve shows carbon removal, the arrow shows the amount of credits issued at year 20, and the gray box shows the 5‐year removal for which credits are issued A more conservative option (tCER2) would be to calculate the credits as the average carbon quantity stored during the period of time as long as the credit lifetime and preceding the verification. This interpretation eliminates the risk of overestimating the amount of carbon stored by the projects over time and is safe for the climate because the verified removals would not have to be maintained after the point in time that their existence has been verified. Of course, this second interpretation results in slightly less credits for the projects than the previous interpretation does (Figure 2). The most conservative option (tCER3) is the issuance of credits for the minimum removal observed during the period of time as long as the credit lifetime and preceding verification. For a specific crediting period, tCER3 will result in fewer credits than the two other alternatives or, in some cases, in the same amount as tCER1 but with a 5‐year delay in issuance. Therefore tCER3 has no advantage for the project compared with the two other options. For this reason, the model developed in this study will not use tCER3. None of these interpretations addresses the problem of the price of temporary credits. If the price of permanent carbon credits (CERs) increases in the future, Annex I countries will have little or no incentive to buy short‐lived carbon credits because at their expiration these would have to be replaced with new and more expensive credits (Chomitz and Lecocq, 2004).
7 Risks for the climate associated with issued carbon credits are different from those associated with projected credits as defined during the project design stage (Dutschke, 2002). At the project design stage, risks and uncertainties are associated with all accounting methods. At the project verification stage, when credits are awarded to the projects, uncertainties are lower because data from monitoring become available. However, the associated risk for the climate is strongly related to the accounting method used. There are few risks for the climate when using ‘ton‐year’ crediting (provided the concept of equivalence time is accepted and defined) or temporary crediting of the average quantity of carbon stored in the past period of time (tCER2). There are slightly more risks when using the other interpretation of temporary crediting (tCER1), and there is a higher level of risks when using equivalence‐adjusted crediting (ACS). Risks exist only for methods that require assumptions about the future evolution of removals during a specific ‘uncertainty time’: the longer the ‘uncertainty time’ the higher the risks. Accounting methods that require this type of assumptions should therefore be complemented by appropriate methods to account for risks and uncertainties, such as the issuance of insured credits, as proposed by Canada (UNFCCC, 2003). Another issue of relevance for carbon credits accounting is the duration of the crediting period, which is the period of time during which the project baseline is considered as valid and credits can be issued. COP‐9 decided to limit the validity of the baseline of CDM forestry projects to a period of 20 years, with two options of renewal (for a maximum crediting period of 60 years), or 30 years without option of renewal. As this decision was not yet available at the time this study was prepared, the crediting periods considered here are of 10, 30, and 50 years.
Model and assumptions
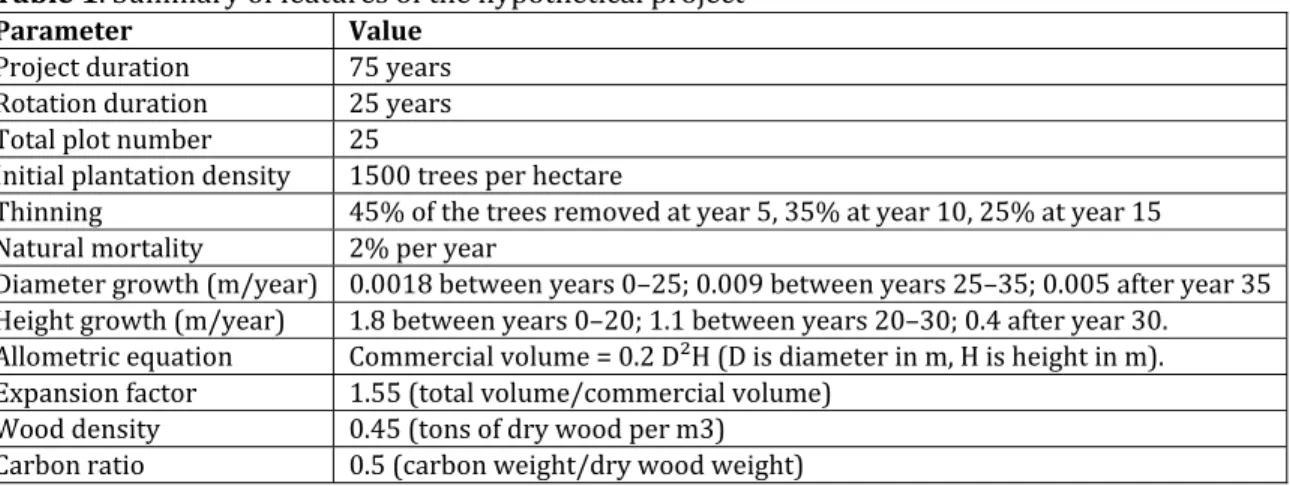
The purpose of the model developed in this study is to calculate the minimum area at which CDM plantations would be viable, taking into account the following factors: • Plantation project: management (plantation density, thinning, harvesting); environment and trees (wood density, carbon fraction, growth, allometric equations, expansion factor, and natural mortality rate); spatial arrangements and economics (project duration, number of stands, economic discount rate). • CDM‐modalities: accounting methods, period of validity of the baseline (crediting period), and interval between verifications. • Carbon market: price of carbon credits (CERs) and its variation rate, transaction costs (project design, validation, monitoring, and verification), and share of proceeds (national and international levy on CDM credits). The model represents the point of view of the project and does not take into account the use of credits by Annex I countries. Consequently, the model does not consider the commitment periods in which credits are issued, neither does it consider the possibility of different future rules in the international regime on climate mitigation. To be able to consider the effects of all factors on the minimum area of the projects, simulation scenarios were calculated for a hypothetical plantation project as shown in Table 1. The minimum area estimated for each scenario was defined as the area at which the present value of transaction costs would be equal to the present value of the revenues from CER sales. Through a Visual Basic program written in‐house, 7776 sets of parameters (scenarios) were calculated using all combinations presented in Table 2.8 Table 1. Summary of features of the hypothetical project Parameter Value Project duration 75 years Rotation duration 25 years Total plot number 25 Initial plantation density 1500 trees per hectare Thinning 45% of the trees removed at year 5, 35% at year 10, 25% at year 15 Natural mortality 2% per year Diameter growth (m/year) 0.0018 between years 0–25; 0.009 between years 25–35; 0.005 after year 35 Height growth (m/year) 1.8 between years 0–20; 1.1 between years 20–30; 0.4 after year 30. Allometric equation Commercial volume = 0.2 D²H (D is diameter in m, H is height in m). Expansion factor 1.55 (total volume/commercial volume) Wood density 0.45 (tons of dry wood per m3) Carbon ratio 0.5 (carbon weight/dry wood weight) Table 2. Sets of parameters used in the model
Parameter Range Number of
values Methods Ton‐year, ACS, tCER1, and tCER2 4 CER price 3, 6, 9, and 12 US$/tCO2e 4 Variation rate of CER price ‐3%, 0%, and 3% annual 3 Design and validation costs 40,000, 120,000, and 200,000 US$ 3 Monitoring costs 2000, 6000, and 10,000 US$ for each monitoring. Plus : 0.1, 0.3, or 0.5 US$/hectare as an additional cost per hectare Verification costs 15,000, 45,000, and 75,000 US$ 3 Crediting period 10, 30, and 50 years 3 Risk discounting 0%, 1%, and 2% annual 3 Economic discount rate 3%, 6%, and 9% 3 Verification interval 5 and 10 years 2 Total number of parameter combinations 7776 The values of transaction costs were obtained from interviews with experts, literature review (Michaelowa et al., 2003), certification agency data, and existing project case studies. The model used the estimated current CER price (US$3/tCO2e) and three higher prices (Grütter, 2002). The model includes important assumptions about risks, monitoring, and the price of tCERs. It assumes that risks depend on an annual risk factor (characterizing the local situation) and on an uncertainty time related to the accounting method. When calculating credits with the ‘ton‐year’ and the tCER2 methods, there is no uncertainty time and therefore no risks, as the issuance of credits is totally ex post. For the ACS method, the uncertainty time is the period of time between project verification and project end. For the tCER1 method, the uncertainty time is half the credit lifetime (or half of the interval between verifications). The risks are taken into account by discounting a part of the carbon stored. The discounted quantity can be interpreted as the cost of insuring the credits, or as a buffer or insurance stock, usable in case of unexpected carbon stock decrease.
9 Regarding carbon monitoring, the model assumes that it would be carried out only at the years of verification and during the crediting period. For the price of temporary credits, the model uses the Equation (3): (3) where $tCER is the price estimated for temporary credits, $CER1 is the current market price for permanent CERs, $CER2 is the future market price of permanent CERs (at the time when tCERs expire), and i is the discount rate. Equation (3) shows that if the price of permanent CERs raises more quickly than the discount rate i, then the price of tCERs would turn out to be negative. In this study, since $CER2 cannot be known, we assumed three scenarios: constant CER price ($CER1 = $CER2), increasing or decreasing CER price (plus or minus 3% annually). In the model, the variation rate for the CER price was only used in the calculation of tCER prices and can be interpreted as the perception of future price variation rate by the buyers of credits. Other model assumptions are that the baseline is zero, leakage is zero, project length is 75 years, equivalence time is 100 years, and the share of proceeds is 7% (2% for the Adaptation Fund, and 5% for national and international administrative costs of the CDM).
Results
The planted forest stand simulated in the model reaches a total removal of 140 Mg of carbon per hectare (or 520 Mg of CO2 per hectare) after 25 years in the aboveground biomass, which is the only carbon compartment taken into account in this study. The average removal during a rotation is 45 Mg of carbon per hectare or 166 Mg of CO2 per hectare. On average, in the whole multiple‐stand plantation project, the removal increases during the first 25 years as the stands are being successively planted, and stabilizes around 170 Mg of CO2 per hectare (Figure 3). Figure 3. Net removal (Mg CO2e/ha or tCO2e/ha) in the whole plantation for Years years 0–7510 According to the 7776 simulations, the minimum area for carbon trading being profitable to the project varies between 100 ha and more than 1 million ha, depending on the combination of parameters and accounting methods used. The median value is 4200 ha, which corresponds to an equivalence‐adjusted average removal of 530,000 Mg of CO2 during the 75‐year project lifetime. Interpreting project scale in terms of CO2 is not easy, as distinct indicators are often used, such as the cumulated net removal or the total removal over lifetime (IPCC, 2000). For this reason, the following results will be expressed in terms of area. Only 7.1% of the parameter sets allow that projects smaller than 500 ha take advantage of the CDM, and only 18.5% for projects smaller than 1000 ha. The model results differ according to the carbon credits accounting method. The median value of the minimum area is the lowest for the tCER1 method and the highest for the ‘ton‐year’ method (Table 3). The latter method does not allow projects smaller than 500 ha to be profitable within the CDM, whereas the former method allows them in 13.7% of the simulations. Table 3. Some key factors describing the distribution of model results according to the carbon credits accounting method Method Median value (ha) Percentage of the simulations allowing projects smaller than 500 ha to be profitable in the CDM Percentage of the simulations allowing projects smaller than 1000 ha to be profitable in the CDM Ton‐ year 11,000 0 2.8 ACS 3,000 5.1 17.7 tCER1 2,300 13.7 30.2 tCER2 3,250 9.7 23.1 Assuming a CER price of US$3/tCO2e, a crediting period of 50 years, and standard or average values for the other parameters (economic discount rate: 6%; design and validation cost: US$80,000; monitoring cost: US$4,000 + US$0.2/ha; verification cost: US$30,000; risk discounting: 1% annual; verification interval: 5; share of proceeds: 7%), projects smaller than 1000 ha cannot profit from the CDM. Even with lower transaction costs (half of the previous ones), projects smaller than 500 ha cannot profit from the CDM. The dependence of net benefits from carbon selling on the total project area was estimated for the current value of CER price (US$3/tCO2e), a crediting period of 50 years and standard or average values for the other parameters, as specified above. With the assumption of constant CER prices, the two tCER methods appear to be the most profitable for the project. They allow projects of approximately 1400 ha to gain advantage from the CDM, whereas the limit is around 3500 ha for ACS and 7000 ha for ‘ton‐ year’. If CER prices increase, the price of tCERs would be lower and the tCER method would be less profitable for the project. Using the same parameter set as specified above, and assuming a hypothetical increase rate of CER price rate of 4.5%, the model shows that the profit for the project would be higher with the ACS method than with the tCER method. Under these assumptions, the tCER accounting methods would be of benefit only to projects larger than 5000 ha, compared with 3500 ha for ACS. We define the ‘best’ accounting method as the one that allows the smallest projects to benefit from the CDM. The tCER1 method is the best method in 65% of the simulations and the ACS method is the best in 39% of the simulations (the sum is more than 100% because two methods may give the same best result). The two other methods can be qualified as the best methods in very few cases (6% for tCER2
11 and 1% for ‘ton‐year’). The ‘ton‐year’ is the best method only when risk discounting disadvantages the ACS method and increasing CER prices disadvantage the tCER method. Due to the equation used to calculate the price of tCERs, the results of the tCER methods are highly dependent on the CER price variation. Assuming constant CER prices, the tCER1 method is definitely more profitable for small projects as it is the best method in 75% of the simulations, compared with 31% for ACS. However, if the price of CERs was expected to increase, the ACS method would be the best in 66% of the simulations, compared with 38% for tCER1. The CER price variation is not the only factor that determines the best method. With high risk discounting, the ACS method is disadvantaged and turns out to be the best method in only 17% of the simulations, compared with 85% for tCER1. If risk discounting is zero, 61% of the simulations show that the ACS method is the best one, compared with 46% for tCER1. Under ‘extreme conditions’, unfavorable for CDM projects, the tCER1 method appears to be the best, except when the price of CERs increases (Table 4). In this case, the disadvantage of the tCER1 method is very high compared with the ACS method: the minimal project scale is respectively 14,550 ha and 3000 ha. The most limiting extreme condition is related to the crediting period: if it were limited to only 10 years, only very large projects would benefit from the CDM (Table 4). Table 4. Median value of minimum project area under extreme conditions Extreme condition Median value of minimum project area (ha) With ton‐
year With ACS tCER1 With tCER2 With methods All
The crediting period is only 10 years 275,000 14,200 3,000 50,000 50,000 The CER price is only US$3/tCO2e 30,000 6,750 4,500 6,550 8,900 The transaction costs are the highest 18,550 5,650 3,700 5,000 8,300 The risk discounting is the highest (2% annual) 11,000 5,150 2,400 3,250 5,300 The CER price is foreseen to increase 3% annual 11,000 3,000 14,550 30,000 7,300 Without any condition (all simulations) 11,000 3,000 2,300 3,250 4,200
Discussion and conclusions
Only long crediting periods allow small to medium sized projects to benefit from the CDM, particularly crediting periods longer than the stand rotation cycle. Most likely, a 20‐year crediting period will result in large projects, promote the use of fast‐growing species, and increase the likelihood of negative socio‐ economic and environmental impacts of CDM forestry projects. As only long crediting periods encourage the use of native species, the establishment of near‐permanent forest, and the participation of smaller projects, longer crediting periods should be considered in the forthcoming discussions on the post‐2012 period. Our analysis of accounting methods suggests that if carbon accounting methods were to be reconsidered for the second commitment period, the discussion should focus on the ACS and tCER methods, since the ‘ton‐year’ method would make carbon selling a very poor incentive for forestry projects. The climatic risks associated with the ACS method require the establishment of a clear liability regime. This regime would specify how much compensation would be required in the case that the carbon credited would be involuntarily or deliberately re‐emitted. This liability regime could be based on the12 ‘ton‐year’ method to calculate the project contribution to climate change mitigation up to the moment of carbon re‐emission. Under this approach, liability would not last forever and credits could be bundled with an insurance coverage for a limited period of time. Provided that the concept of equivalence between avoided emissions and temporary removal is accepted and defined, the amount of ACS credits to be insured would decrease over time as the cumulative ton‐year line increases. Liability would end when the cumulative ton‐year value is equal to the ACS amount (Figure 1). TCER methods appear to be more appropriate to address the non‐permanence of carbon in forests. However, the lower price of expiring CERs may not be sufficient to motivate the establishment of CDM forests, particularly of smaller ones. From a climatic point of view there is no reason to decide on a single accounting method. Therefore, the possibility of letting the project decide about the most convenient accounting method should not be excluded a priori. According to the intended project duration, the local risks of non‐permanence, the availability of insurance providers, and the expected variation of CER prices, a project may choose one or the other accounting method. This flexibility may help more initiatives to participate to the CDM after 2012. The high transaction costs generated by the modalities and procedures of the CDM and the few credits resulting from the different accounting methods appear to exclude small plantation projects from the CDM. Because of equity and leakage considerations, and because small‐scale projects are more prone to induce positive impacts on sustainable development than large projects, there is an interest in proposing regulations and institutional arrangements that would facilitate the participation of small‐ scale projects. The challenge is how to define these rules without increasing climatic risks and transaction costs. The discussion on simplified modalities and procedures for small‐scale projects has so far not provided evidence that significant transaction cost savings can be made in the case of CDM forestry projects. Eventually, more attention should be given to measures to facilitate the implementation of small‐scale projects, such as bundling of small‐scale projects under an umbrella organization. Such bundling may facilitate the participation of small and medium stakeholders in the CDM as economy of scale and knowledge concentration becomes possible. However, this type of organization requires important institutional capacities, as large numbers of small projects must be managed and coordinated. Furthermore, host countries might have to design and implement innovative financial schemes to create incentives for small forest plantations. The entity managing such umbrella projects and incentives could finance small projects under its proper rules and, at the same time, sell carbon credits under the CDM rules. The challenge is to develop schemes that are real incentives for small plantations and that guarantee the long‐term financial viability of the umbrella organization. The participation of small forestry projects might be eased by the addition of other climate‐related activities, such as energy mitigation activities or adaptation activities. The combination of a small forestry project with an energy project producing electricity from woody residues may allow the generation of permanent credits and a more effective contribution to sustainable development. Indeed, under some conditions, this type of arrangement would provide constant energy to the local population and at the same time avoid emissions from fossil fuel consumption and develop or maintain plantation areas as a result of a permanent wood demand.
13
References
Aukland, L., Moura Costa, P., Bass, S., Huq, S., Landells‐Mills, N., Tipper, R., Carr, R., 2002. Laying the Foundations for Clean Development: Preparing the Land Use Sector. A Quick Guide to the CDM. IIED, London. Chomitz, K.M., 2000a. Evaluating Carbon Offsets from Forestry and Energy Projects: How do they Compare? Development Research Group, World Bank, Washington, DC. Chomitz, K.M., 2000b. “Renting” Carbon Sinks: A Solution to the Permanence Problem for Forestry‐based Carbon Offsets? World Bank, Washington, DC. Chomitz, K.M., Lecocq, F., 2004. Temporary sequestration credits: an instrument for carbon bears. Climate Policy 4(1). Dutschke, M, 2002. Risk for Forestry Investment under the Clean Development Mechanism. Hamburg Institute for International Economics, Hamburg, Germany. Dutschke, M., 2001. Permanence of CDM Forests or Non‐permanence of Land Use Related Carbon Credits? HWWA Discussion Paper 134. HWWA‐Institut für Wirtschaftsforschung‐Hamburg. Ellis, J., 2001. Forestry Projects: Permanence, Credit Accounting and Lifetime. Information Paper, COM‐ ENV‐EPOC‐IEA‐SLT(2001)11. OECD Environment Directorate and International Energy Agency. Available at http://www.oecd.org/dataoecd/ 4/58/2467909.pdf Fearnside, P.M., Lashof, D.A., Moura‐Costa, P., 2000. Accounting for time in mitigating global warming. Mitigation and Adaptation Strategies for Global Change 5(3), 230–270. Groen, T., Nabuurs, G.J., Pedroni, L., 2003. Carbon Accounting and Cost Estimation in Land Use, Land Use Change and Forestry Projects using CO2Fix V.3. Working Paper, Alterra, Wageningen University, The Netherlands. Grütter, J.M., 2002. Greenhouse Gases Market Trends: Third Quarter 2002. Grütter Consulting, see www.ghgmarket.info IPCC (Intergovernmental Panel on Climate Change), 2000. Land Use, Land‐Use Change, and Forestry. Special Report of the Intergovernmental Panel on Climate Change. Watson, R.T., Noble, I.R., Bolin, B., Ravindranath, N.H., Verardo, D.J., Dokken, D.J. (Eds). Cambridge University Press, Cambridge, UK. Marland, G., Fruit, K., Sedjo, R., 2001. Accounting for sequestered carbon: the question of permanence. Environmental Science and Policy 4, 259–268. Michaelowa, A., Stronzik, M., Eckermann, F., Hunt, A., 2003. Transaction costs of the Kyoto Mechanisms. Climate Policy 3(3), 261–278. Moura‐Costa, P., Wilson, C., 2000. An equivalence factor between CO2 avoided emissions and sequestration: description and applications in forestry. Mitigation and Adaptation Strategies for Global Change 5(1), 51–60. Orlando, B., Baldock, D., Canger, S., Mackensen, J., Maginnis, S., Socorro, M., Rietbergen, S., Robledo, C., Schneider, N., 2002. Carbon, Forests and People: Towards the Integrated Management of Carbon Sequestration, the Environment and Sustainable Livelihoods. IUCN, Gland, Switzerland.14 PCF, 2000. Validation, Verification and Certification for PCF Projects. Prototype Carbon Fund, Implementation Note No. 4. World Bank, Washington, DC. Smith, J., Scherr, S.J., 2002. Forest Carbon and Local Livelihoods: Assessment of Opportunities and Policy Recommendations. CIFOR, Occasional Paper No. 37, Bogor, Indonesia. Subak, S., 2003. Replacing carbon lost from forests: an assessment of insurance, reserves, and expiring credits. Climate Policy 3(2), 107–122. UNFCCC, 1997. Decision 2/CP3. In: Report of the Conference of the Parties on its Third Session, held at Kyoto, 1–11 December 1997. Addendum. Part Two: Action taken by the Conference of the Parties at its Third Session, p. 31. Available at http://unfccc.int/resource/docs/cop3/07a01.pdf UNFCCC, 2000. Paper 5: Colombia. Land‐use, land‐use change and forestry (LUCF) projects in the CDM: expiring CERs, a proposal to addressing the permanence issues. In: Methodological Issues, FCCC/SBSTA/2000/Misc.8, pp. 23–26. Available at http://unfccc.int/resource/docs/2000/sbsta/misc08.pdf UNFCCC, 2002. Paper 8: Denmark on behalf of the European Community and its Member States. In: Views from Parties on Issues Related to Modalities for the Inclusion of Afforestation and Reforestation Project Activities Under the CDM in the First Commitment Period, FCCC/SBSTA/2002/Misc.22, pp. 38– 48. Available at http://unfccc.int/resource/docs/2002/sbsta/ misc22.pdf UNFCCC, 2003. Paper 4: Canada. Issues related to definitions and modalities for including afforestation and reforestation project activities under the CDM in the first commitment period. In: Methodological Issues: Land use, Land‐use Change and Forestry: Definitions and Modalities for Including Afforestation and Reforestation Activities Under Article 12 of the Kyoto Protocol, FCCC/SBSTA/2003/L.13. Available at http://unfccc.int/resource/docs/2003/sbsta/misc05.pdf UNFCCC, 2004. Decision 19/CP9. In: Report of the Conference of the Parties on its Ninth Session, held at Milan from 1 to 12 December, 2003. Addendum. Part Two: Action taken by the Conference of the Parties at its Ninth Session, Bonn, pp. 13– 31. Available at http://unfccc.int/resource/docs/cop9/06a02.pdf Vine, E., Sathaye, J., Makundi, W., 1999. Guidelines for the Monitoring, Evaluation, Reporting, Verification, and Certification of Forestry Projects for Climate Change Mitigation. Report for the US EPA, Lawrence Berkeley National Laboratory, Berkeley, California.