Publisher’s version / Version de l'éditeur:
Journal of ASTM International (JAI), 6, 6, pp. 1-29, 2009-06-01
READ THESE TERMS AND CONDITIONS CAREFULLY BEFORE USING THIS WEBSITE. https://nrc-publications.canada.ca/eng/copyright
Vous avez des questions? Nous pouvons vous aider. Pour communiquer directement avec un auteur, consultez la
première page de la revue dans laquelle son article a été publié afin de trouver ses coordonnées. Si vous n’arrivez pas à les repérer, communiquez avec nous à PublicationsArchive-ArchivesPublications@nrc-cnrc.gc.ca.
Questions? Contact the NRC Publications Archive team at
PublicationsArchive-ArchivesPublications@nrc-cnrc.gc.ca. If you wish to email the authors directly, please see the first page of the publication for their contact information.
NRC Publications Archive
Archives des publications du CNRC
This publication could be one of several versions: author’s original, accepted manuscript or the publisher’s version. / La version de cette publication peut être l’une des suivantes : la version prépublication de l’auteur, la version acceptée du manuscrit ou la version de l’éditeur.
For the publisher’s version, please access the DOI link below./ Pour consulter la version de l’éditeur, utilisez le lien DOI ci-dessous.
https://doi.org/10.1520/JAI102048
Access and use of this website and the material on it are subject to the Terms and Conditions set forth at
Water penetration of cladding components - results from laboratory
tests on simulated sealed vertical and horizontal joints of wall cladding
Lacasse, M. A.; Miyauchi, H.; Hiemstra, J.
https://publications-cnrc.canada.ca/fra/droits
L’accès à ce site Web et l’utilisation de son contenu sont assujettis aux conditions présentées dans le site LISEZ CES CONDITIONS ATTENTIVEMENT AVANT D’UTILISER CE SITE WEB.
NRC Publications Record / Notice d'Archives des publications de CNRC:
https://nrc-publications.canada.ca/eng/view/object/?id=7f2460c6-20f3-40de-b168-fc4fafa0d899 https://publications-cnrc.canada.ca/fra/voir/objet/?id=7f2460c6-20f3-40de-b168-fc4fafa0d899
http://www.nrc-cnrc.gc.ca/irc
Wa t e r pe ne t ra t ion of c la dding c om pone nt s - re sult s from la bora t ory
t e st s on sim ula t e d se a le d ve rt ic a l a nd horizont a l joint s of w a ll
c la dding
N R C C - 5 0 8 2 9
L a c a s s e , M . A . ; M i y a u c h i , H . ; H i e m s t r a , J .
F e b r u a r y 2 0 1 0
A version of this document is published in / Une version de ce document se trouve dans:
Journal of ASTM International (JAI), 6, (6), pp. 1-29, June 01, 2009, DOI:
10.1520/JAI102048
The material in this document is covered by the provisions of the Copyright Act, by Canadian laws, policies, regulations and international agreements. Such provisions serve to identify the information source and, in specific instances, to prohibit reproduction of materials without written permission. For more information visit http://laws.justice.gc.ca/en/showtdm/cs/C-42
Les renseignements dans ce document sont protégés par la Loi sur le droit d'auteur, par les lois, les politiques et les règlements du Canada et des accords internationaux. Ces dispositions permettent d'identifier la source de l'information et, dans certains cas, d'interdire la copie de documents sans permission écrite. Pour obtenir de plus amples renseignements : http://lois.justice.gc.ca/fr/showtdm/cs/C-42
Michael A. Lacasse1, Hiroyuki Miyauchi2 and J. Hiemstra3
Water Penetration of Cladding Components – Results from Laboratory Tests
on Simulated Sealed Vertical and Horizontal Joints of Wall Cladding
Michael A. Lacasse, Hiroyuki Miyauchi and J. Hiemstra (2008), “Water Penetration of Cladding Components –A comparison of Laboratory Tests on Simulated Sealed Vertical and Horizontal Joints of Wall Cladding”, Journal of
ASTM International (JAI), Third Symposium on Durability of Building and Construction Sealants and Adhesives
(2008-DBCSA), June 25-26, 2008, Denver, Colorado.
ABSTRACT: Considerable work has focused on the deterioration of jointing compounds used to seal building
joints; less emphasis has been placed on understanding the consequences of seal failure, particularly in respect to watertightness. Jointing products are subjected to different climate effects; some induce aging in the sealant that in time leads to deficiencies. Deficiencies may also come about from design faults or improper installation. Water entry at deficiencies may lead to a number of different deteriorating effects on the building fabric that may induce failure of other envelope components or premature failure of the joint sealant. Joints are also subjected to substantial wind-driven rain loads in particular atop multi-storey buildings. The approach taken in this study focuses on determining the fault tolerance of joint systems of a simulated wall panel when subjected to watertightness tests that emulate heightened wind-driven rain loads. Vertical and horizontal joints of 20 mm width and sealed with a one-component polyurethane product were subjected to water spray rates ranging between 1.6 and 6 Lmin-1m-2 and pressures of up to 2 kPa. Faults introduced to the sealed joint and representative of deficiencies through which water could penetrate, consisted of cracks of 2 to 16 mm long introduced along the sealant to substrate interface. For specific crack lengths, the crack size related to the degree of joint extension, the extension reaching a maximum of 10% of joint width. Rates of water entry across the joint were determined for cracks of different lengths and size and the nature of water entry at deficient joints in which cracks were introduced was also examined. Results on vertical joints indicated that water readily enters open cracks in relation to the crack size, quantity of water present at the crack and pressure across the opening. Water may also penetrate cracks of non-extended “closed” joints.
KEYWORDS: fault tolerance, joint deficiencies, sealant failure, watertightness, water penetration, testing
1. Senior Research Officer, National Research Council Canada, Institute for Research in Construction, Ottawa, Canada, Ph.D., P. Eng
2. Assistant Professor, Structural Engineering Research Centre, Tokyo Institute of Technology,
Y o k o h a m a , J a p a n , Dr. Eng.
1.0 Introduction
1.1 Overview
Considerable work has focused on the deterioration of jointing compounds used to seal building joints, either to determine suitable methods to evaluate loss in their pertinent physical or chemical characteristics or establish test methods to evaluate their expected long-term performance. Less emphasis has been placed on understanding the consequences of seal failure along joints, in particular in respect to the expected loss in air and watertightness at the joint.
Jointing products are subjected to a number of climatic effects, some of which induce aging in the sealant that in time may lead to openings or deficiencies along the joint. Deficiencies may also come about from design faults or improper installation. Indeed, deficiencies due either to the effects of aging or from lack of attention to details or installation practice are inherent to any jointing system.
Joints are also subjected to substantial wind-driven rain loads atop multi-storey buildings in particular those located along an exposed coastline. Water entry at deficiencies along joints may lead to: leakage to the interior living space resulting in the formation of mould; moisture uptake by moisture sensitive components in the wall assembly, such as corrosion prone metal substrates or rot sensitive wood components; the premature loss in adhesion of the sealant. To what extent are joints, having small deficiencies through which water enters, vulnerable to water leakage when subjected to a substantial rain event, such as a typhoon, as might be experienced in Japan, or a severe thunderstorm or hurricane as in North America? Indeed, what wind-driven rain loads might be associated with a typhoon or hurricane and how often do these occur in a given climate? In other words, what risk might there be of water entry for any location, given a specific building height, façade type, and joint configuration and inherent deficiencies in the jointing system? How fault tolerant is the façade jointing system?
As an initial step, it is useful to briefly review the incidence and nature of failure at joints and thereafter, gain some insight into the nature of climate loads atop buildings subjected to wind-driven rain and loads associated with typhoon, hurricane and storm events.
1.2 Defects in buildings envelopes and jointing systems
Few comprehensive surveys have been published on the incidence of failure in building joints; there is literature that is of some value, notably that from survey work carried out in the UK [1], the results of which are reportedly [2] emulated by a similar work in Japan [3]. The highlights of the survey conducted in 1990 in the UK indicated that 55% of joints failed within less than 10 years, and only 15% lasted more than 20 years.
In North America, interestingly, little has been published on this topic although there is information on individual buildings, specifically that published by Huff [4] who provides examples of two surveys, one of which was carried out on a newly constructed 11-storey building and the other, on a twin 18-storey condominium in Long Beach, California. It the latter case, a 5.6% failure rate was detected in the EIFS cladding joints based on 1%, 5%, and 10% sampling rates. Interestingly Huff [4] determined from this that the failure rate remained constant irrespective of the sample size.
The former example [4] of the 11-storey building had a total of ca. 10700 m (35,000 ft.) of jointing product installed. The survey was conducted on 2 of 24 grid locations representing an 8.3% sampling rate. From this study, 14 adhesive failures were detected on one grid section, and 20 on the other, yielding an average of 17 failures per grid section. Based on this information an estimate of the number of failures in adhesion of the entire building was 408 whereas, following a survey of the entire building 427 adhesive failures were uncovered (i.e., a 0.2% failure rate). The author notes that although the failure rate appears small, there are nonetheless 427 failure locations that represents, based on an average length of failure of 50 mm (2-in.), approximately 21.6 m (71-ft.) of product that has failed and through which water can enter.
An investigation of defects and complaints of execution of constructed works in Japan was reported by the Building Construction Society of Japan, results for which are summarized in Figure 1 [5]. The results indicate that 65% relate directly to water leakage, of which 44% can be attributed to water leakage of the wall system and of this proportion, 32% of the defects are due to leakage at the exterior of the wall, that is, at the jointing system. Hence, based on the results of this study, it is evident that a considerable proportion of defects accrue from water leakage alone. Thus understanding the nature of wind-driven rain is important when assessing the loads to which the building envelope is subjected. Additionally, considering the relatively high portion of defects attributable to jointing systems suggests that attention be placed not only on the nature of failure at joints but also, the consequences of failure.
In respect to the nature of failure at joints, the Building Construction Society of Japan reports on the different types of failure of jointing products, as summarized in Figure 2 [6]. The greatest proportion of failures can be attributed to failure due to adhesion (56%), whereas, the proportion of failures in cohesion is reported as 24% [6].
Water leak at the external wall: 32%
Water leak at the roof: 21% Water leak at crack of wall: 12%
Delamination of interior and external wall: 6% Settlement problem: 5% Dew condensation: 3%
Other: 21%
Water leak at the external wall: 32%
Water leak at the roof: 21% Water leak at crack of wall: 12%
Delamination of interior and external wall: 6% Settlement problem: 5% Dew condensation: 3%
Other: 21%
Water leak at the external wall: 32%
Water leak at the roof: 21% Water leak at crack of wall: 12%
Delamination of interior and external wall: 6% Settlement problem: 5% Dew condensation: 3%
Other: 21%
Figure 1 – Investigation of defects and complaints of building work in Japan [5]
Adhesive failure of sealed joint: 56% Cohesive failure of sealed joint : 24% Substrate failure of sealed joint : 8% Others : 12% Adhesive failure of sealed joint: 56% Cohesive failure of sealed joint : 24% Substrate failure of sealed joint : 8% Others : 12%
Figure 2 – Cause of failure of sealed joint in Japan [6]
This may broadly suggests that when attempting to determine the significance of jointing product failures on the watertightness of joints, defects such as those that accrue due to adhesion failure should first be investigated as these are perhaps the more likely to occur in building joints.
In general then, deficiencies in building façade joints are inherent in any façade jointing system even those for which proper installation procedures have been conscientiously followed. These deficiencies would typically be adhesive in nature and could lead to leakage across the wall joint. However, given openings exist along joints, water leakage evidently can only occur if water is present at the opening and if there are forces driving water through these deficiencies. The presence of water on the façade is in part a function of the climate loads, specifically, the intensity
of wind driven rain, that varies, not only in relation to the basic climate parameters of wind speed and rainfall intensity, but also in respect to the height and width of the building, and orientation of the building to the prevailing direction of the driving rain. Features on the facade such as overhangs and balconies necessarily affect local
deposition of water on the façade, such features shielding the facade from direct rainfall. Once water is deposited on the façade, it migrates downwards, the concentration of water being determined by different vertical and horizontal features that form part of the cladding proper [7]. In this paper, some basic information relating to characteristic of
wind speed and rainfall intensity during key climate events is given such that these can be related to test loads used in assessing wall and cladding weathertightness performance.
1.3 Characteristics of climate loads
Wind driven rain is necessarily characterized by two basic climate parameters: wind or wind speed, and rainfall intensity, the latter parameter typically referred to as the rainfall rate and reported in mm/h. Wind driven rain events are associated with tropical cyclonic events such as tropical storms, typhoons (in the Western Pacific) and hurricanes (in the Eastern Atlantic). Table 1 provides the range of wind speeds and related velocity pressures in relation to different categories of tropical cyclonic events.
Table 1 – Characteristic wind speeds and related velocity pressures for different categories of tropical cyclonic events
Category Wind speed
(km/h)
Velocity pressure*
(Pa) WEAK TROPICAL STORM
Speeds / velocity pressures 42 - 69 82 - 224
Gust speeds / pressures 64 - 103 198 - 515
SEVERE TROPICAL STORM
Speeds / velocity pressures 69 - 103 224 - 515
Gust speeds / pressures 105 - 151 550 - 1080
Category 1 HURRICANE /
MINIMAL TYPHOON
Speeds / velocity pressures 105 - 132 515 - 840
Gust speeds / pressures 153 - 193 1130 - 1850
Design wind pressure/ speed for
Southern coastal US 113 581 (12 psf)
* Pυ (Pa) = ½ ρυ2; ρair = ca. 1.2 kgm-3; υ (ms-1)
The values provided in Table 1 are those that occur at a height of 10 m, the height at which meteorological data are collected. Thus these would suffice for estimating the wind loads for a residential building of three stories or
less. Wind loads atop buildings of greater height can be estimated by using the following equation for velocity pressure, qz, given in ASCE-7 [8]:
qz (Nm-2) = 0.613 [2.01 (z/zg)2/α] Kzt Kd V2 I………(1)
where z = height above ground (m); zg = 213.36 m (atmospheric boundary layer reference height); and
assuming, α = 7 and α = 11.5 for exposure categories B and D respectively, and I (Importance factor); Kzt
(topographic factor); Kd (wind directionality factor) = 1
For example, using this relationship, and assuming wind velocities at 10 m consistent with the range of speeds associated for a severe tropical storm (i.e. 69 – 103 km/h), information on velocity pressures at different building heights for different exposure categories such as urban (Exposure category B) and flat, open terrain (Exposure category D) can be estimated as given in Table 2. The information is important because it shows that the pressures are not linearly proportional to the height but vary exponentially in height, thus the severity of the wind can be significantly more important atop tall buildings as compared to low-rise structures. This may be self-evident however, it bears directly on the risk to water entry through small openings in exposed joints of tall buildings as the risk to entry is itself proportional to the pressure difference across the joint.
Table 2 – Velocity pressures at different building heights associated with severe tropic storms for buildings subjected to ASCE exposure categories B (Urban, suburban) and D (flat, unobstructed)
Height
(m) Storey*
Velocity pressure (Pa) Exposure category B Exposure category D 10 3 183 – 417 258 – 587 30 10 250 – 571 313 – 711 75 25 326 – 742 367 – 834 150 50 398 – 904 413 – 941
*Estimate assuming a 3-m storey height; **ASCE 7-05; § 6.5.6.3 [8]
Rainfall intensity during storms — An example of the amount of rainfall that can occur during a typhoon in provided in Figure 3 [9] that shows the temporal variation in rainfall intensity for an occurrence of two typhoons in Taiwan in 1996. Taiwan receives an annual rainfall of 2,500 mm of which 80 % of the annual rainfall occurs in May to October and especially during typhoons. Rainfall intensity during some typhoons may exceed 100 mm/h and 1,000 mm over a 24-h period with the recorded maximum one-hour and 24-h rainfall before 1996 being 300 mm and 1,672 mm, respectively [9]. As can be seen in Figure 3, the recorded 96-h rainfall for typhoon Herb was
accompanied by heavy rain that reached 1,994 mm over this period, the bulk of the rain falling in a 48-h (1987 mm) with maximum rainfall rates attaining values in exceedence of 110 mm/h.
Figure 3 – Temporal rainfall variation during Typhoon Gloria and Herb, 1996 [10]
Relating test conditions to weather parameters — A summary of extreme wind-driven rain (WDR) conditions in relation to the return period in years is provided in Table 3 for different locations across the United States including: Boston, MA, Miami, FL, Minneapolis, MN, Philadelphia, PA and Seattle, WA [11]. Information on rates of wind driven rain (L/(min-m2) and driving rain wind pressures (DRWP) are given as average extreme hourly values. The DRWP is the velocity pressure exerted on a surface (e.g. wall) normal to the wind direction during rain. The analysis from which these values were determined also indicated that the wind driven rain values provided for Miami, FL, would be overestimated for shorter return periods (i.e. ≤ 10 years), and underestimated for the longer return periods (≥ 20 yrs); the extent of under or over estimation has not yet been determined as this would require a more detailed analysis of the effects of tropical cyclonic activity on the wind-driven rain and driving rain wind pressures.
In the United States, design wind pressures are derived from information based on a 1 in 50 year return period [12]. With reference to this return period, extreme WDR conditions in Miami, FL indicate a water deposition load of 3.9 L/(min-m2) and a DRWP of 553 Pa, whereas in comparison, Seattle, WA provides for much reduced WDR loads – 0.3 L/(min-m2) and a DRWP of 198 Pa. It should be emphasized that these values represent extreme values associated with each individual driving rain parameter and are unlikely to occur coincidentally.
Table 3 ― Summary of extreme WDR values
Location BOS MIA MSP PHL SEA
Return Period WDR, L/(min-m2) DRWP, Pa WDR, L/(min-m2) DRWP, Pa WDR, L/(min-m2) DRWP, Pa WDR, L/(min-m2) DRWP, Pa WDR, L/(min-m2) DRWP, Pa 2 0.40 197 0.883 121 0.45 105 0.466 122 0.167 109 5 0.483 247 1.85 259 0.633 134 0.6 172 0.2 137 10 0.55 280 2.48 351 0.766 153 0.7 206 0.233 156 20 0.617 311 3.1 439 0.883 171 0.783 238 0.266 174 30 0.65 329 3.45 490 0.95 182 0.85 256 0.266 185 50 0.70 352 3.88 553 1.033 195 0.9 279 0.3 198 100 0.75 383 4.483 638 1.15 212 1 310 0.316 216
BOS = Boston MA, MIA = Miami FL, MSP = Minneapolis MN, PHL = Philadelphia PA, SEA = Seattle WA This implies that testing at conditions in which both extremes are used would subject a specimen to an event that would have a much heighten return period as compared to the return period associated with a particular extreme WDR parameter. Typically, for non-tropical cyclonic events, at heightened rates of wind-driven rain, the
corresponding DRWP are lower than those of the extreme values shown in the table and likewise, rates of WDR are lower when extreme values of DRWP are evident.
However, what is evident from this information is that tests undertaken at the 700 Pa level and
3.4 L/(min-m2) adequately represent expected extremes for the different locations of the United States provided in Table 3. The WDR rates at which tests were conducted (i.e. 0.8, 1.6 and 3.4 (min-m2)) may be slightly higher that that provided in Table 3 for Seattle and Boston, however the threshold value for WDR rate of 0.8 L/(min-m2) is reflected in values given for Minneapolis at a 1 in 10 year return period (0.76 L/(min-m2)), Philadelphia at a 1 in 20 year return period (0.78 L/(min-m2)) and every other year in Miami (1-in-2 yr: 0.88 L/(min-m2)). It is cautioned that for Miami, FL the values provided are likely an overestimate of WDR.
1.4 Overview of approach
The question of fault tolerance in jointing systems has not yet been broadly explored and the approach taken in this study provides some fundamental information on the nature of water entry at joints. In this paper, information is provided on results from a laboratory study on the weathertightness of vertical and horizontal joints of a simulated wall system when subjected to water penetration tests in which test conditions emulate heightened wind-driven rain loads. An account of the experimental program is provided that includes a summary of the approach, and a description of the test apparatus, specimen, methods and parameters. Thereafter, results of watertightness tests on both vertical and horizontal joints are given in terms of the rates of water entry across the sealed joint in relation to
simulated wind-driven rain loads. The discussion focuses on the nature of entry through openings of deficiencies of the jointing product and the function of the backer rod in providing a watertight seal.
2.0 Approach and Description of Test Apparatus, Specimen, and Methods
2.1 Approach
The fault tolerance of simulated vertical and horizontal panel joints was assessed in a laboratory study in which the degree of watertightness of defective joints was determined by subjecting the joints to a range of simulated wind-driven rain loads, loads that were consistent with those that might be found atop tall buildings in a severe storm event. The joints were 20 mm wide and consisted of a one-component polyurethane product and closed cell backer rod. Small deficiencies (cracks), ranging in size between 2 and 16 mm in length, were purposely introduced in the jointing product, thus permitting water to pass through these openings. The joint was extended up to a maximum of 10% of joint width so that the nature and size of the crack could be varied. Consequently, joints with cracks of varying length and size were subjected to water spray rates ranging between 1.6 and 6 L/(min-m2) and pressures of up to 2 kPa. The watertightness tests were carried out using a purposely developed test apparatus described in detail in the subsequent section.
2.2 Test apparatus
The water penetration tests were carried out using a recently developed test apparatus (Figure 4) in which both the quantity of water applied to the surface of the test specimen and the air pressure difference across the assembly were automatically regulated. An elevation view of the test frame of the Mini-Dynamic Wall Testing facility (m-DWTF) is shown in Figure 5; a vertical sectional view of the same apparatus is given in Figure 6. Other basic components of the apparatus including the air and water pressure control systems, data acquisition and control systems, and the PC-based central processing unit are illustrated in Figure 5. The automated set-up permits acquiring information on spray rate, pressures differentials and water collection rates in real-time over the course of a test sequence.
The water spray attachment (rack or individual nozzle) is located on the test frame; the rate of water supplied to the spray attachment is monitored from a flow sensor (Kobold; Model DPM-1170N2F300). The supply water is
drained through an opening at the base of the test frame. Likewise, a drain is provided at the base of the test specimen (Figure 5) to remove water leakage that accumulates in the space just beyond the interior plane of the jointing system. This water may also be collected in a calibrated vessel (Figure 6) in which is placed a water level sensor (Intempco; Model LTX20RP-B-3). This permits determining the rate of water collection in the container and hence establishing the rate of leakage through the jointing system.
Air pressure sensors (Druck, Model LPM1110) are located in the test frame portion as well as in the test specimen potion; the pressure in the test frame measures the driving pressure across the entire joint, whereas the pressure sensor located in the test specimen measures the pressure in the space between the weather seal (exterior portion of joint) and the air seal, or the inside of the joint. There is an adaptor to the test frame that permits connecting to an air leakage test device; thus, the air leakage of the test assembly can also be determined using a laminar flow element (Meriam; Model 50MW20-1) coupled to a pressure sensor (not shown).
Hence the basic wind-driven rain parameters at a panel joint can be replicated (i.e. rain deposition, pressure differential) using this apparatus and the conditions at the joint thus simulated in a reproducible manner.
700 874
87 87
Water drain Water spray rack
Test frame apparatus
Air leakage connection Main air pressure regulators Sub air pressure regulators Air pressure amplifier I/P air pressure
transducer Computer monitor Computer CPU D/A card Water level sensor Power supply Pressure supply Control Card Sub pre water ssure regulators Main press water ure regulator Water supply Flow sensor
Air pressure control system Water pressure control system
Control pressure sensor (Unit: mm) 700 874 87 87 Water drain Water spray rack
Test frame apparatus
Air leakage connection Main air pressure regulators Sub air pressure regulators Air pressure amplifier I/P air pressure
transducer Computer monitor Computer CPU D/A card D/A card Computer CPU Computer monitor Water level sensor Power supply Pressure supply Water supply Control Card Sub pre water ssure regulators Main press water ure regulator Flow sensor
Air pressure control system Water pressure control system
Control pressure sensor
Figure 5 – Test frame apparatus of Mini-Dynamic Wall Testing facility Figure 6 – Vertical sectional view of Mini-Dynamic Wall Testing Facility
Test specimen frame Test frame apparatus
Clear sheet Air pressure regulators
Test specimen
Crack area Water spray Air pressure sensor Water drain Water pressure regulators Water level sensor
Test specimen frame Test frame apparatus
Clear sheet
Sealed
Air pressure regulators
Test specimen
Crack area Water spray Air pressure sensor Water drain Water pressure regulators Water level sensor Sealed
2.3 Test specimen
The configurationof the vertical and horizontal jointare illustrated inFigure 7and Figure 8 respectively. The overall size of the test specimen was 610 mm by 610 mm (Figure 7). The vertical or horizontal joint was located at the middle of the specimen (width 20 mm; depth 15 mm) that was sealed with a 1-part polyurethane sealant* (white; no primer). The sealant was applied to a closed-cell polyethylene backer rod having a diameter of 25 mm and cured in laboratory conditions (20°C; 35% RH) for 2 weeks before initiating the test. The crack introduced in the jointing product was located approximately at mid-length of either the vertical or horizontal joint. The panel assembly, and substrate to which the sealant was applied, was made of transparent acrylic sheathing; this permitted visual
observation of water penetration along the joint in different test conditions over the course of the investigation. One portion of the panel assembly was fixed to the test frame (Figs. 6 and 7; fixed portion), the other was moveable thus permitting the width of the joint to be changed up to a maximum of approximately 25% of a joint of 20 mm in width (i.e. ca. 5 mm).
Figure 7 – Front elevation of test specimen showing 20 mm vertical joint and nominal degree of movement of
transparent acrylic panel
Figure 8 – Front elevation of test specimen showing horizontal joint, location of crack in joint
* ISO 11600-F-25LM; ASTM C 920, Type S, Grade NS, Class 35, Use NT, M, A, G, and I; Canadian Specification CAN/CGSB-19.13-M87, Classification MCG-2-25-A-N 61 0 76 2 76 76 Sealant
(Initial joint width:20mm, joint depth:15mm) Acrylic plate Movable portion Fixed portion Crack Test specimen frame
(Unit: mm) 61 0 76 2 76 76 61 0 76 2 76 76 Sealant
(Initial joint width:20mm, joint depth:15mm) Acrylic plate Movable portion Fixed portion Crack Test specimen frame
(Unit: mm) 610 762 76 76 Spray nozzle multiple openings
Water spray rack
61 0 76 2 76 76 Crack Fixed portion
2.4 Test parameters
An overview of possible test parameters is provided in Table 4. Not all parameters given in Table 4were tested in this study; as an initial test series reported in this paper, rates of water leakage across a deficient joint were evaluated in relation to simulated wind driven rain loads (i.e. water deposition rate and pressure differential). The degree of deficiency of the joint was dependent on the degree of joint displacement (i.e. movement in extension) and specific “crack characteristics”, such as crack location (adhesion) and crack length. Essentially, and as will be discussed in a subsequent section, the size of the crack opening in the deficient joint and through which water might penetrate, is a function of the degree of joint extension and crack length.
However the notional list of possible test parameters permits considering those results that might be obtained from, for example, testing joints: of different width and depth (or varying W/D ratios); with backer rods of varying size or type; in compression as opposed to expansion; having different types of cracks (i.e. adhesive at the interface of the sealant and substrate as compared to a crack along center of joint), and cracks of increased size as compared to that evaluated in this study.
The different water deposition rates to which the specimens were subjected are provided in Table 4 and the corresponding rates of water flow necessary to produce these rates are given in Table 5. On the vertical joint, the “rainfall area”, was the area over which water was deposited to ensure a uniform rate over the crack (i.e. 0.1 m wide by 0.55 m high).
Table 4 – Experimental parameters Table 5 – Rainfall area
Environmental parameters
1. Water deposition rate 1.6, 3.4, 4.0, 6.0L/(min-m2) Flow rate
L/min L/min-m (width) Deposition rate L/(min-m2)
2. Pressure differential Static pressure: (0, 75, 150, 500, 1000, 2000 Pa) 0.088 0.88 1.6
Building (façade) condition 0.187 1.87 3.4
3. Joint characteristics Cross section type Single joint 0.22 2.2 4
Joint orientation Linear vert. or horiz. joint 0.33 3.3 6
4. Jointing product
Type Working joint *Width 0.1 m, height 0.55 m
Joint width 20 mm
Joint depth 15 mm
Backer rod Yes (25 mm)
5. Movement Wall movement type Expansion / Compression
Movement ratio 0% 2.5% 5%, 10%
6. Crack characteristics
Crack condition Yes / No
Crack location 1 Linear joint
Crack location 2 Adhesion failure
2.5 Test methods
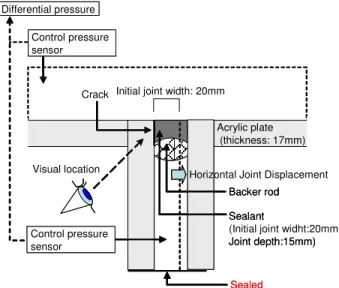
The water penetration test method is summarized in Figure 9. The quantity of water deposition on the surface of the specimen and the air pressure difference across it was controlled according to the prescribed parameters as provided in Table 6 for tests on vertical joints, and Table 7 for those on horizontal joints. Testing undertaken at 4.0 L/(min-m2)was consistent with the requirements of the Japanese Institute of Standards A 1414-1† [13] whereas those completed at 3.4 L/(min-m2) replicated conditions specified in the ASTM E331-00‡. Testing at the other two spray rates (i.e. 1.6 and 6 L/(min-m2)) permitted subjecting the crack opening to a broader range of water deposition rates perhaps consistent with that found on the exterior of tall buildings.
The rate of water deposition (L/(min-m2)), pressure differential (Pa), and rate of water leakage (L/min) was recorded automatically by the data acquisition system. The behavior of water leakage was verified by visual
observation, as depicted in Figure 9. Figure 9 provides a horizontal sectional view of the vertical joint test specimen at the crack location. Transparent acrylic plates were used to form the panel face, and the face and sides of the joint, thus permitting observation of water entry at the crack location. The eye icon in Figure 9 indicates the position of the observer in relation to that of the crack location in the vertical joint.
The back of the specimen was sealed with an adhesive tape (Figure 9) permitting control of pressure differences across the joint. The joint strain to the prescribed displacement was adjusted with a clamp. Tests were carried out over a period of ten minutes for each test parameter.
Acrylic plate (thickness: 17mm)
Sealant
(Initial joint widht:20mm, Joint depth:15mm) Backer rod Crack Differential pressure Sealed Control pressure sensor Visual location
Initial joint width: 20mm
Control pressure sensor Acrylic plate (thickness: 17mm) Sealant Joint depth:15mm) Backer rod Crack Differential pressure Control pressure sensor
Initial joint width: 20mm
Horizontal Joint Displacement Visual location
Control pressure sensor
Sealed
Figure 9 – Horizontal sectional view of the vertical joint test specimen at crack location; the eye icon indicates the position of the observer in relation to that of the crack location.
† JIS A 1414-1: Water-spray rate 4.0 L/(min-m2), Maximum test-pressure: 2303 Pa, Minimum test-pressure: 49 Pa ‡ ASTM E331-00: Water-spray minimum rate of 3.4 L/(min-m2), Test-pressure of at least 137 Pa
Table 6 – Test matrix for water penetration tests on vertical joints Crack length (mm) Joint displacement (mm)
Quantity of water L/(min-m2)
1.6 3.4 4 6 No crack (0) 0, 0.5, 1, 2 - - - 6* 2 0, 0.5, 1, 2 6* 1** 6* 6* 4 0, 0.5, 1, 2 - 1** 6* - 8 0, 0.5, 1, 2 - 1** 6* - 16 0, 0.5, 1, 2 6* 1** 6* 6* *6 tests at : 0, 75, 150, 500, 1000, 2000 Pa, **1 test at : 150 Pa
Table 7 – Test matrix for water penetration tests on horizontal joints
Crack length (mm) Δ - Joint displacement (mm)
Quantity of water L/min
0.088 0.187 0.22 0.33
2 0, 0.5, 1, 2 - - 6* 6*
4 0, 0.5 6* 6* 6* 6*
8 0, 0.5, 1, 2 6† 1** 6* - 16 0, 0.5, 1, 2 - - 6* - *6 tests at : 0, 75, 150, 500, 1000, 2000 Pa, **1 test at : 150 Pa
†6 tests only at Δ of 1 mm
3. Results from Laboratory Tests on Sealed Vertical Joints
3.1 Crack width related to joint movement and crack length
The nature of the degree of crack opening is illustrated in Figure 10 and a representative photograph of the different crack lengths when not extended, and when extended by 0.5, 1 and 2 mm is given in Figure 11. As is evident from the photograph, the greater the degree of joint extension, the more apparent the crack opening size. This is more evident in the case of the 16 mm and longest crack length shown in Figure 11 (displacement 2 mm; joint width 22 mm).
The results obtained from joint movement at prescribed displacements and the relation to crack width and crack length is shown in Figure 12. There is a linear relationship between joint displacement and crack opening (width) for the largest crack length. For shorter crack lengths, this relationship approaches linearity. As well, when the joint is displaced, the longer crack lengths provide for a broader crack opening. Hence, as might be expected, the largest crack openings occur for 16 mm crack lengths at a joint displacement of 2 mm (10% joint width).
Figure 10 – Sealed joint condition
Figure 11 – Crack opening of vertical sealed joint
Figure 12 – Relationship between vertical joint displacements and crack opening 3.2 Water penetration test results for vertical joint
A summary of the results from water penetration tests on the vertical joint is provided in Figure 13. In this summary, the degree of water penetration is given in terms of water leakage (L/min) as a function of pressure
Crack
Initial joint width: 20 mm Se Joint displacement: 0, 0.5, 1, 2 mm Crack opening Sealant Crack length: 0, 2, 4, 8, 16 mm Displacement:0 mm (Joint width:20 mm) Displacement:0.5 mm (Joint width:20.5 mm) Displacement:1 mm (Joint width:21 mm) Displacement:2 mm (Joint width:22 mm) 0 0.2 0 0.5 1 1.5 2 Displacement (mm) 0.4 0.6 0.8 1 1.2 1.4 1.6 1.8 2 C rac k o p en in g ( m m ) Crack length:2mm Crack length:4mm Crack length:8mm Crack length:16mm
Crack length 16mm Displacement 2mm 0 0.002 0.004 0.006 0.008 0.01 0.012 0.014 0.016 0.018 0.02 0.022 0.024 0 500 1000 1500 2000 Pa L/ m in . 1.6L/min/m2 3.4L/min/m2 4L/min/m2 6L/min/m2 Crack length 16mm Displacement 1mm 0 0.002 0.004 0.006 0.008 0.01 0.012 0.014 0.016 0.018 0.02 0.022 0.024 0 500 1000 1500 2000 Pa L/ m in. 1.6L/min/m2 3.4L/min/m2 4L/min/m2 6L/min/m2 Crack length 16mm Displacement 0.5mm 0 0.002 0.004 0.006 0.008 0.01 0.012 0.014 0.016 0 500 1000 1500 2000 Pa L/ m in . 1.6L/min/m2 3.4L/min/m2 4L/min/m2 6L/min/m2 Crack length 16mm Displacement 0mm 0 0.002 0.004 0.006 0.008 0.01 0.012 0.014 0.016 0 500 1000 1500 2000 Pa L/ m in . 1.6L/min/m23.4L/min/m2 4L/min/m2 6L/min/m2 Crack length 8mm Displacement 0mm 0 0.002 0.004 0.006 0.008 0.01 0.012 0.014 0.016 0 500 1000 1500 2000 Pa L/ m in . 3.4L/min/m2 4L/min/m2 Crack length 8mm Displacement 2mm 0 0.002 0.004 0.006 0.008 0.01 0.012 0.014 0.016 0 500 1000 1500 2000 Pa L/ m in . 3.4L/min/m2 4L/min/m2 Crack length 8mm Displacement 1mm 0 0.002 0.004 0.006 0.008 0.01 0.012 0.014 0.016 0 500 1000 1500 2000 Pa L/ m in . 3.4L/min/m2 4L/min/m2 Crack length 8mm Displacement 0.5mm 0 0.002 0.004 0.006 0.008 0.01 0.012 0.014 0.016 0 500 1000 1500 2000 Pa L/ m in . 3.4L/min/m2 4L/min/m2 Crack length 4mm Displacement 0mm 0 0.002 0.004 0.006 0.008 0.01 0.012 0.014 0.016 0 500 1000 1500 2000 Pa L/ m in. 3.4L/min/m2 4L/min/m2 Crack length 4mm Displacement 0.5mm 0 0.002 0.004 0.006 0.008 0.01 0.012 0.014 0.016 0 500 1000 1500 2000 Pa L/ m in . 3.4L/min/m2 4L/min/m2 Crack length 4mm Displacement 1mm 0 0.002 0.004 0.006 0.008 0.01 0.012 0.014 0.016 0 500 1000 1500 2000 Pa L/ m in . 3.4L/min/m2 4L/min/m2 Crack length 4mm Displacement 2mm 0 0.002 0.004 0.006 0.008 0.01 0.012 0.014 0.016 0 500 1000 1500 2000 Pa L/ m in . 3.4L/min/m2 4L/min/m2 Crack length 2mm Displacement 0mm 0 0.002 0.004 0.006 0.008 0.01 0.012 0.014 0.016 0 500 1000 1500 2000 Pa L/ m in . 1.6L/min/m2 3.4L/min/m2 4L/min/m2 6L/min/m2 Crack length 2mm Displacement 0.5mm 0 0.002 0.004 0.006 0.008 0.01 0.012 0.014 0.016 0 500 1000 1500 2000 Pa L/ m in . 1.6L/min/m2 3.4L/min/m2 4L/min/m2 6L/min/m2 Crack length 2mm Displacement 1mm 0 0.002 0.004 0.006 0.008 0.01 0.012 0.014 0.016 0 500 1000 1500 2000 Pa L/ m in . 1.6L/min/m2 3.4L/min/m2 4L/min/m2 6L/min/m2 Crack length 2mm Displacement 2mm 0 0.002 0.004 0.006 0.008 0.01 0.012 0.014 0.016 0 500 1000 1500 2000 Pa L/ m in . 1.6L/min/m2 3.4L/min/m2 4L/min/m2 6L/min/m2 Wa te r l e a k a g e Wa te r l e a k a g e Wa te r l e a k a g e Wa te r l e a k a g e Pressure Crack length 16mm Displacement 2mm 0 0.002 0.004 0.006 0.008 0.01 0.012 0.014 0.016 0.018 0.02 0.022 0.024 0 500 1000 1500 2000 Pa L/ m in . 1.6L/min/m2 3.4L/min/m2 4L/min/m2 6L/min/m2 Crack length 16mm Displacement 1mm 0 0.002 0.004 0.006 0.008 0.01 0.012 0.014 0.016 0.018 0.02 0.022 0.024 0 500 1000 1500 2000 Pa L/ m in. 1.6L/min/m2 3.4L/min/m2 4L/min/m2 6L/min/m2 Crack length 16mm Displacement 0.5mm 0 0.002 0.004 0.006 0.008 0.01 0.012 0.014 0.016 0 500 1000 1500 2000 Pa L/ m in . 1.6L/min/m2 3.4L/min/m2 4L/min/m2 6L/min/m2 Crack length 16mm Displacement 0mm 0 0.002 0.004 0.006 0.008 0.01 0.012 0.014 0.016 0 500 1000 1500 2000 Pa L/ m in . 1.6L/min/m23.4L/min/m2 4L/min/m2 6L/min/m2 Crack length 8mm Displacement 0mm 0 0.002 0.004 0.006 0.008 0.01 0.012 0.014 0.016 0 500 1000 1500 2000 Pa L/ m in . 3.4L/min/m2 4L/min/m2 Crack length 8mm Displacement 2mm 0 0.002 0.004 0.006 0.008 0.01 0.012 0.014 0.016 0 500 1000 1500 2000 Pa L/ m in . 3.4L/min/m2 4L/min/m2 Crack length 8mm Displacement 1mm 0 0.002 0.004 0.006 0.008 0.01 0.012 0.014 0.016 0 500 1000 1500 2000 Pa L/ m in . 3.4L/min/m2 4L/min/m2 Crack length 8mm Displacement 0.5mm 0 0.002 0.004 0.006 0.008 0.01 0.012 0.014 0.016 0 500 1000 1500 2000 Pa L/ m in . 3.4L/min/m2 4L/min/m2 Crack length 4mm Displacement 0mm 0 0.002 0.004 0.006 0.008 0.01 0.012 0.014 0.016 0 500 1000 1500 2000 Pa L/ m in. 3.4L/min/m2 4L/min/m2 Crack length 4mm Displacement 0.5mm 0 0.002 0.004 0.006 0.008 0.01 0.012 0.014 0.016 0 500 1000 1500 2000 Pa L/ m in . 3.4L/min/m2 4L/min/m2 Crack length 4mm Displacement 1mm 0 0.002 0.004 0.006 0.008 0.01 0.012 0.014 0.016 0 500 1000 1500 2000 Pa L/ m in . 3.4L/min/m2 4L/min/m2 Crack length 4mm Displacement 2mm 0 0.002 0.004 0.006 0.008 0.01 0.012 0.014 0.016 0 500 1000 1500 2000 Pa L/ m in . 3.4L/min/m2 4L/min/m2 Crack length 2mm Displacement 0mm 0 0.002 0.004 0.006 0.008 0.01 0.012 0.014 0.016 0 500 1000 1500 2000 Pa L/ m in . 1.6L/min/m2 3.4L/min/m2 4L/min/m2 6L/min/m2 Crack length 2mm Displacement 0.5mm 0 0.002 0.004 0.006 0.008 0.01 0.012 0.014 0.016 0 500 1000 1500 2000 Pa L/ m in . 1.6L/min/m2 3.4L/min/m2 4L/min/m2 6L/min/m2 Crack length 2mm Displacement 1mm 0 0.002 0.004 0.006 0.008 0.01 0.012 0.014 0.016 0 500 1000 1500 2000 Pa L/ m in . 1.6L/min/m2 3.4L/min/m2 4L/min/m2 6L/min/m2 Crack length 2mm Displacement 2mm 0 0.002 0.004 0.006 0.008 0.01 0.012 0.014 0.016 0 500 1000 1500 2000 Pa L/ m in . 1.6L/min/m2 3.4L/min/m2 4L/min/m2 6L/min/m2 Wa te r l e a k a g e Wa te r l e a k a g e Wa te r l e a k a g e Wa te r l e a k a g e Pressure
Figure 13 – Water penetration test results for vertical joint.
Variation in water leakage rates (L/min) in relation to pressure different across specimen (Pa) for sixteen test conditions for joints having crack length deficiencies of 2, 4, 8 and 16 mm and
difference across the test specimen (Pa) for sixteen test conditions for which the crack length was 2, 4, 8 and 16 mm and the joint displacement (Δ) varied from 0 to 2 mm (Δ = 10% joint width).
Quantity and pattern of water leakage — The quantity and pattern of water leakage is very complex because the parameters affecting leakage are interrelated. However in general, greater rates of water leakage occurred through cracks in the sealed joint, given either higher water deposition rates on the specimen surface or higher pressure differentials across the specimen.
The pattern of water leakage and the effect of the backer rod on water entry across the joint are characterized in Figure 14. Specifically, when the diameter of the backer rod (nominal size 20 mm) was greater than the joint width, water flowed downwards along the gap between sealant and backer rod which is illustrated as type “A” water leakage in Figure 14. Whereas, when the rod diameter was less than the joint width, i.e., when the joint was
extended from its original width of 20 mm, water flowed from the opening across the gap at the substrate-backer rod interface, towards the back of the joint; this pattern of water leakage is illustrated as Type “D” in Figure 14. When the rate of water entry was less than or equal to the drainage capacity along the gap, water flowed down the gap as in pattern “B”, (Figure 14), whereas, if the rate of entry exceeded the drainage capacity along the gap, excess water flowed up the gap as in pattern “C” (Figure 14).
Gasket
Water leakage
Water
Crack
A
B
C
D
Water leakage
Gap
Sealant
Backer rod
Water
C
Figure 14 – Characterization of water leakage of vertical joint
Water C Sealant Backer rod Water Crack Sealant Backer rod
3.3 Discussion of water penetration results for vertical joint
The discussion focuses on two principal aspects that affect water leakage across deficient vertical joints, specifically, the influence of joint displacement and crack length, and the effect of the backer rod. Each is dealt with in turn.
Influence of joint displacement and crack length — Given the presence of a crack, at no joint displacement (0 mm), water leakage nonetheless occurred. Additionally, and excluding results obtained with no joint displacement (0 mm), the longer the crack length and the greater the joint displacement, the greater the rate of water penetration. Hence, the crack length and joint displacement provided a multiplicative effect on water leakage rates. As well it can be observed that at the largest joint displacement, water readily penetrated the joint, even at low pressure conditions. From this, it follows that the greatest water penetration rate (0.05 L/min) occurred at the maximum test joint extension (2 mm), largest crack length (16 mm) and highest test pressure differential (2000 Pa).
Some additional observations from the results include the following:
• The greater the driving pressure across the joint, the greater the rate of water penetration.
• When the crack length is “small” (e.g.. ≤ 2 mm), regardless of the rate of water deposition at the crack location, at the low pressures, there are few differences in the rate of water penetration across the joint. • However, given the “small” crack lengths, at high pressure differences across the joint, increases in the
rate of water penetration are evident for corresponding increases in the rate of water deposition at the crack location.
• When the crack length is large (e.g. 16 mm), the higher the rate of water deposition at the crack, the greater the rate of water leakage.
• At larger joint displacements (i.e. 5 and 10%) and for low water deposition rates at the crack (i.e.
1.6 L/(min-m2)), even at high pressure differences, the increase in the rate of water leakage with increase in pressure difference are not as significant as compared to leakage rates achieved at more substantial water deposition rates; hence occlusion of the opening with water is a factor that affects gross water entry rates. Effect of backer rod — The closed-cell polyethylenebacker rod acted as a gasket providing a secondary barrierto water entry at the joint. When leakage occurred at the crack, and given that the backer rod was compressed, water leakage was arrested beyond the position where the backer rod interfaces with the substrate; this typically occurred in conditions of no joint extension or when the extension was or no greater than 0.5 mm. However, when the joint was extended (e.g. 1 and 2 mm) and the width of the backer rod was then smaller than the extended joint width, the rod no longer acted as a gasket. It is to be noted that the backer rod (nominal diameter 25 mm) once compressed in the 20 mm joint did not recover its size upon extension of the joint. Hence the degree of compression set of the rod
affected its capability to seal the jointing product. It appears critical to consider the diameter of backer rod and its degree of compression in a joint to help avoid water leakage should a fail-safe system be of interest.
There may also be consideration as to whether an open or closed cell backer rod would greatly affect water leakage when the rod is sufficiently compressed as to arrest the flow of water; it is expected that an open cell rod would deter water entry but perhaps not as effectively as a closed cell backer rod. However, such a notion would have to be evaluated from results of further testing.
3.4 Water penetration test results for horizontal joint
Evidence of water penetration at the horizontal joint is given in Figure 15 and Figure 16. A view of water entry along the interior side of the joint is shown in the photo of Figure 14; water is seen to be pooling on the surface of the interior of the joint but ultimately made its way to the drainage opening. A photo (Figure 16) at the underside of the joint at the crack location shows the path for water leakage through a crack opening of length 16 mm.
Backer rod Backer rod
Joint product
Drain
Figure 15 – View of horizontal joint from “interior” side showing backer rod between adjacent joint faces
and accumulation of water on horizontal surface
Figure 16 – View of underside of horizontal joint showing backer rod and location of crack (16 mm) opening along jointing product; arrow shows direction
of water leakage across joint
A summary of the results from water penetration tests on the horizontal joint is provided in Figure 17. In this summary, the degree of water penetration is given in terms of water leakage (L/min) as a function of pressure difference across the test specimen (Pa) for ten test conditions. Results for water leakage for crack lengths of 4, 8 and 16 mm are given at joint displacements varying from 0 to 2 mm (10% joint width). The range of scale for water leakage rate varies by three orders of magnitude, from a low of ca. 0.0018 L/min. used for assessing water leakage across joints with no displacement, to a high of 0.2 L/min. for joints having displacements of 2 mm.
Figure 17 – Water penetration test results for horizontal joint. Variation in water leakage rates (L/min) in relation to pressure different across specimen (Pa) for joints having crack length deficiencies of 4, 8 and 1 mm and joint
displacements (Δ) of 0, 2.5, 5 and 10% joint width. 0 0.02 0.04 0.06 0.08 0.1 0.12 0.14 0.16 0.18 0.2 0 500 1000 1500 2000 Pa W a te r L e ak ag e (L /m in ) 0 0.02 0.04 0.06 0.08 0.1 0.12 0.14 0.16 0.18 0.2 0 500 1000 1500 2000 Pa Wa te r le a k a g e ( L /m in ) 0 0.01 0.02 0.03 0.04 0.05 0.06 0.07 0.08 0.09 0 500 1000 1500 2000 Pa Wa te r le a k a g e ( L /m in) 0 0.01 0.02 0.03 0.04 0.05 0.06 0.07 0.08 0.09 0 500 1000 1500 2000 Pa Wa te r le a k a g e ( L /m in) 0 0.0002 0.0004 0.0006 0.0008 0.001 0.0012 0.0014 0.0016 0.0018 0 500 1000 1500 2000 Pa Wa te r le a k a g e ( L /m in ) 0 0.0002 0.0004 0.0006 0.0008 0.001 0.0012 0.0014 0.0016 0.0018 0 500 1000 1500 2000 Pa W a te r l eak ag e ( L /m in ) 0 0.0002 0.0004 0.0006 0.0008 0.001 0.0012 0.0014 0.0016 0.0018 0 500 1000 1500 2000 Pa W a te r l eak ag e ( L /m in ) Crack length 8 mm Displacement 0 mm Crack length 16 mm Displacement 0 mm Crack length 4 mm Displacement 0 mm — —¡ 0.088 L/min —S— 0.220 L/min —z— 0.330 L/min — — 0.220 L/minS — — 0.220 L/minS 0 0.002 0.004 0.006 0.008 0.01 0.012 0.014 0.016 0.018 0.02 0 500 1000 1500 2000 Pa Wa te r le a k a g e ( L /m in ) 0 0.002 0.004 0.006 0.008 0.01 0.012 0.014 0.016 0.018 0.02 0 500 1000 1500 2000 Pa Wa te r le a k a g e ( L /m in ) 0 0.002 0.004 0.006 0.008 0.01 0.012 0.014 0.016 0.018 0.02 0 500 1000 1500 2000 Pa Wa te r le a k a g e ( L /m in ) Crack length 4 mm Displacement 0.5 mm Crack length 8 mm Displacement 0.5 mm Crack length 16 mm Displacement 0.5 mm — —¡ 0.088 L/min —S— 0.220 L/min —z— 0.330 L/min — — 0.220 L/minS — — 0.220 L/minS —S— 0.220 L/min Crack length 16 mm Displacement 1 mm Crack length 8 mm Displacement 1 mm — — 0.088 L/min¡ — — 0.220 L/minS — — 0.220 L/minS Crack length 8 mm Displacement 2 mm Crack length 16 mm Displacement 2 mm — — 0.220 L/minS — — 0.220 L/minS
Some key observations from water penetration tests on deficient horizontal joints are:
• Water leakage occurs when joints are “closed” (i.e. Δ = 0); even under low pressure differentials; • Water leakage is pressure dependent; higher rates of leakage are obtained at higher pressure differences; • A heightened degree of leakage can occur, up to ca. 1.6 L over a 10 minute interval; this was estimated
from the maximum leakage rates of greater than 0.16 L/min obtained for a crack length of 16 mm and 10% joint opening at 1 kPa and 2 kPa driving pressures.
• Water leakage rates for a crack length of 16 mm are dependent on the crack opening size.
The final observation is more clearly evident from information provided in Figure 18; the variation in water leakage as a function of pressure difference across specimen and joint displacements of 0, 2.5, 5 and 10% are given for a joint having a crack length deficiency of 16 mm. The adjoining Figure 18b provides results for no displacement given that these are not readily apparent from that provided in Figure 18a. It is evident that as the crack length increases there is a corresponding increase in the rate of water leakage at the opening. For example, at the 1 kPa pressure difference, there is a ca. 50-fold increase in water leakage rate between a joint displacement of 2.5% (0.5 mm) and a closed joint (no displacement), and 5-fold increase in leakage rate, for increases in joint displacement from 2.5% to 5% and from 5% to 10% respectively.
Figure 18 Variation in water leakage as a function of pressure difference and joint displacement for a joint with crack length of 16 mm (a) results for displacement of 0, 2.5, 5 and 10% joint width; (b) results for no displacement
Additionally it can been seen that for the smaller crack opening sizes (i.e. Δ = 0, 2.5, 5%; 0, 0.5 mm, 1 mm), rates of water entry increase with corresponding increases in pressure difference across the specimen; this suggests
0 0.02 0.04 0.06 0.08 0.1 0.12 0.14 0.16 0.18 0.2 0 500 1000 1500 2000 0 0.0002 0.0004 0.0006 0.0008 0.001 0.0012 0.0014 0.0016 0.0018 0 500 1000 1500 2000 Δ = 10% Δ = 2.5% Δ = 5% Δ = 0 Pa Pa Water leaka g e (L/ min ) Water leaka L/ min ) ( g e
that the openings are completely occluded with water and the air pressure is driving water through these openings in increasing amounts and in proportion to the pressure difference. Whereas at the largest crack opening (Δ = 10%; 2 mm), the leakage rate reaches a maximum at 1 kPa pressure difference (0.162 L/min) and at 2-kPa there is only a small increase in leakage rate as compared to that obtained at 1-kPa ( < 2% to 0.165 L/min). This suggests that at 1 kPa pressure level, the maximum leakage rate has been reached for the given water deposition rate and crack opening size; in this instance, the opening is no longer completely occluded with water hence air pressure can not drive additional water through the opening and no additional rate of entry is possible at these test conditions. Such findings mirror those found for the vertical joint.
At water deposition rates at which the comparatively smaller openings are occluded, the larger openings are less readily filled but nonetheless this may occur intermittently given the erratic nature of water migration over openings. For larger openings, there are likely instances in which these openings will intermittently fill with water and thereafter, these water “plugs” would be ejected by the pressure differential across the opening.
3.5 Comparison between water penetration test results of vertical and horizontal joints
A comparison was made between water leakage through deficient vertical and horizontal joints as shown in Figure 19. The results reflect leakage rates of joints subjected to a water deposition rate of 4 L/(min-m2). The Y-axis provides the rates of leakage (L/min) across the horizontal joint; that of the X-axis for the vertical joint.
0.0001 0.001 0.01 0.1 1 0.0001 0.001 0.01 0.1 1 Water leak ag e o f ho rizo n tal j o in t 0 . 0 0 5
Water leakage of vertical joint
Results have been organized in terms of different crack lengths; cracks of 16 mm length are shown as circular data points, 8 mm as square points, and 4 mm as triangular points. The dotted lines delineate the outer boundary of the data and the oblique line joining points 0.0001 and 1 L/min on the plot indicates when the values of horizontal and vertical leakage rates are equal. A point falling beneath this line indicates that the leakage rate through the defect at the vertical joint is greater than the rate through the defect in the horizontal joint at the given test condition.
It is apparent from this plot that there can be substantial increases in leakage rate of either vertical or horizontal joints and up to an order of magnitude difference.
The following was also evident:
• Overall, it is more likely that vertical joints will leak at higher rates than horizontal joints (ca. 59%); as well, this was most prevalent at reduced water leakage rates (i.e. < 0.005 L/min) where 81% of the data points were those of the vertical joint having a greater leakage rate than that of the horizontal joint; On the other hand,
• At large crack openings (i.e. crack lengths of 8- and 16 mm, displacement of 1 and 2 mm) there is a greater chance (ca. 75%) that the rate of water leakage at the horizontal joint will be more severe than that of the vertical joint;
• Clearly the rate of water leakage depends on the nature of the crack opening (i.e. crack length and width); horizontal joints appear to be more susceptible to water leakage for joints having larger defect sizes.
5. Conclusions
1. For vertical joints evaluated in this study:
• There exists a linear relationship between crack width and joint displacement for cracks introduced in a sealant at the sealant-substrate interface; as well,
• Larger crack lengths induce greater crack widths and crack sizes in extended joints;
• The size and shape of the backer rod affects the nature of water leakage across the vertical joint. 2. For both vertical and horizontal joints evaluated in this study:
• If a crack exists in a sealed jointing system, even if the joint displacement is 0 mm, water may penetrate the opening at the crack;
• The higher the quantity of water deposition on or air pressure differential across the specimen, the greater the rate of water leakage of the jointing system.
3. Additionally, it may be suggested that if the crack length in a joint of an actual building is known or verified from a field inspection, an estimate of the rate of water leakage can be calculated by using the information given above and provided information is also given on the expected climate loads impinging on the façade.
It should be borne in mind that estimates provided in this initial series of tests only offer a gross approximation of leakage across a deficient joint and are based on the limited number of tests and test variations. The movement of water through small openings will be affected by the tortuosity of the leakage path and the nature of the materials along which it flows. Hence, other factors such as the type of sealant, backer rod and substrate material to which the jointing product is adhered may affect water entry. For example, a deficient joint of sealant installed on a concrete substrate is not likely to comport itself in exactly the same manner as suggested by results on the leakage through cracks reported in this study when considering the idealised test conditions. Nonetheless, these studies offer some initial measure of the degree of water penetration at deficient joints – additional studies using the same approach would help elucidate the likely variations in leakage rate across a deficient joint that would arise given for example, different sealant and substrate materials or crack location and crack size.
Acknowledgements
That portion of this work on vertical joints was conduced over the course of a 10 month visiting researcher work term at the Institute for Research in Construction (IRC), National Research Council Canada, in Ottawa. The authors are indebted to the Tokyo Institute of Technology, Japan for having provided funding to Dr. Miyauchi for his stay at the IRC, and to the IRC for their support to the research conducted by Dr. Miyauchi and Dr. Lacasse.
References
1. Woolman, R. and A. R. Hutchinson, Eds. (1994), Resealing of Buildings – A Guide to Good Practice, Butterworth-Heinemann, Oxford, UK, 169 p.
2. Wolf, A. T. (2000), “Improving the Service Life of Sealed cladding Joints Through a Total Quality
Management Approach”, in: 3rd International RILEM Symposium on Durability of Building and Construction Sealants, Fort Lauderdale, FL, February, 2-3, 2000, A. T. Wolf, editor, RILEM Publications, pp. 45-59 3. Chiba, R., Wakimoto, H., Kadono, M., Kawakubo, F., Koji, H., Karimori, M., Hirano, E., Amaya, T., Sasatani,
S. and Hosokawa, K. (1992), “Improvement System of Waterproofing by Sealants in Japan”, in: Proceedings on International Conference, Kyoto Kokusai Hotel, May 1992, Japan Industry Sealant Association, Tokyo, Japan, pp. 175-199
4. Huff, D. (2003), ‘Non-Destructive Testing of Installed Weatherproofing Sealant Joints’ ASTM STP 1453, pp. 335-345
5. Building Constructors Society (Kenchikugyo Kyokai) (1995), Manual of defect and complaint prevention technology in building work (revised edition), 1995.7, Japan
6. Building Constructors Society (Kenchikugyo Kyokai) (2002), Failure in building construction sealant, 2002.1, Japan
7 . El-Shimi, M., White, R. and Fazio, P. (1980), “Influence of Facade Geometry on Weathering”, Can. J. Civ. Eng., Vol. 7, pp. 597-613
8. ASCE Standard ASCE/SEI 7-05 (2006), Minimum Design Loads for Buildings and Other Structures, prepared by the Structural Engineering Institute of the ASCE, American Society of Civil Engineers, 388 p.
9. Jan, Chyan-Deng (2004), “Debris Flow Hazards Mitigation in Taiwan”, International Sabo Association, www.sabo-int.org/projects/taiwan.html (accesssed 10 July, 2008)
10. Jan, C. D. and Chen, C. L. (2005), “Debris Flows Caused by Typhoon Herb in Taiwan”, in: Debris-Flow Hazards and Related Phenomena (Chapter 21), M. Jakob and O. Hungr (Eds.), Praxis Publishing Ltd., Chichester, England, pp. 539-563
11. S. M. Cornick and M. A. Lacasse (2007), An Investigation of Climate Loads on Building Facades for selected locations in the US, submitted to: ASTM E06 Symposium Up Against the Wall - An Examination of Building Envelope Interface Techniques and Systems, 1 November 2007, B. G. Hardman, C. Carll and T. A. Weston, Eds., ASTM International, West Conshohocken, PA, 2007
12. K. C. Mehta and J. M. Delahay (2004) Guide to the Use of the Wind Load Provisions of ASCE 7-02, January 2004, American Society of Civil Engineers, ASCE Press, Reston, VA, 142 p.
13. Japanese Industrial Standard (JIS) A1414-1, Building (Architectural) performance testing of panel components - Part 1: general
![Figure 1 – Investigation of defects and complaints of building work in Japan [5]](https://thumb-eu.123doks.com/thumbv2/123doknet/14156017.472540/7.918.230.728.220.424/figure-investigation-defects-complaints-building-work-japan.webp)


![Figure 3 – Temporal rainfall variation during Typhoon Gloria and Herb, 1996 [10]](https://thumb-eu.123doks.com/thumbv2/123doknet/14156017.472540/10.918.219.729.117.476/figure-temporal-rainfall-variation-typhoon-gloria-herb.webp)