DOI: 10.1007/s00339-005-3403-1 Materials Science & Processing m. hahn1,u o. barbieri1 f.p. campana1 r. k ¨otz1 r. gallay2
Carbon based double layer capacitors
with aprotic electrolyte solutions:
the possible role of intercalation
///insertion
processes
1Electrochemistry Laboratory, Paul Scherrer Institute, 5232 Villigen PSI, Switzerland 2Maxwell Technologies SA, 1728 Rossens, Switzerland
Received: 5 October 2004/Accepted 17 August 2005
Published online: 18 November 2005 • © Springer-Verlag 2005
ABSTRACT The extraordinary stability and cycle life per-formance of today’s electrochemical double-layer capacitors (EDLCs) are generally ascribed to the fact that charge storage in activated carbon (AC) is based on pure double-layer charging. In contrast, Faradaic charge-transfer reactions like those occur-ring in batteries are often connected with dimensional changes, which can affect the cycle life of these storage devices. Here we report the charge-induced height change of an AC elec-trode in an aprotic electrolyte solution, 1 mol/l (C2H5)4NBF4
(TEABF4) in acetonitrile. The results are compared with those
obtained for a graphite electrode in the same electrolyte. For both electrodes, we observe an expansion/contraction of sev-eral percent for a potential window of±2 V vs. the immersion potential (ip). For the EDLC electrode, significant expansion starts at about 1 V remote from the ip and hence is well within the normal EDLC operation range. For the graphite electrode, the height changes are unambiguously caused by intercalation/deintercalation of both anions and cations. The close analogies between the graphite and the EDLC electrode suggest that ion intercalation or insertion processes might play a major role for charge storage, self discharge, cyclability, and the voltage limitation of EDLCs.
PACS82.47.Uv; 82.45.Fk; 82.45.Gj; 82.80.Fk; 81.05.Uw
1 Introduction
The much higher stability and cycle life per-formance of today’s electrochemical double-layer capacitors (EDLCs) when compared to batteries are generally ascribed to the circumstance that charge storage is based on pure double-layer charging, and not on Faradaic reactions. Such charge-transfer processes are often accompanied by micro-scopic structural changes, which may be not fully reversible and thus limit the cycle life of batteries.
In general, microscopic structural changes will result in macroscopic dimensional changes of the electrode. Conse-quently, dilatometry is a convenient means to distinguish be-tween Faradaic (chemical) and capacitive (electrostatic) pro-cesses. This is especially true for poorly crystalline materials u Fax: +41 56 310 4415, E-mail: [email protected]
like activated carbon (AC), where diffraction experiments of-ten give no satisfactory information.
For carbon materials, several possible phenomena have been identified which may lead to charge-induced dimen-sional changes: (i) an increase of the interlayer distance upon ion intercalation between adjacent basal planes [1, 2], (ii) widening of the intralayer C−C bond length upon electron injection into the aromatic planes (and shrinking upon hole in-jection) [3–8], and (iii) an expansion due to the decrease of surface tension with increasing excess charge in the electro-chemical double layer [9–11].
For graphite, intercalation of a large variety of ions of either sign is well established. The accompanying c-axis-distance widening ranges from about 10% for Li+ (in the compound LiC6) [2] to more then hundred percent for some large ions [1].
Besides this large c-axis expansion a much smaller effect (about 1.5% at maximum) of intercalation was predicted [3– 5] and measured [5–8] for the intralayer C−C bond length. The corresponding strain, being due to quantum-mechanical effects (changes in orbital occupation and band structure), changes sign from an expansion for electron injection to a contraction for hole injection. Notably, this effect is ex-pected to occur for double-layer charging as well.
The third postulated effect is based on the decrease of surface tension with increasing excess charge in the elec-trochemical double layer. This effect, well established for the liquid-mercury electrode, would lead to an expansion of a solid spherical electrode upon charging in either direction and consequently also to an expansion of a porous electrode composed of such spheres. In fact, the predicted linear relation between strain and excess charge of either sign remote from the potential of zero charge (pzc) has been observed for dif-ferent carbon electrodes in neutral aqueous solutions [9–11]. However, the reported overall height change is very small, be-low 0.05%.
In the present contribution we report measurements of di-mensional changes of an AC electrode used for electrochem-ical double layer capacitors in organic, aprotic electrolyte solutions, where higher charge densities can be obtained than with neutral aqueous solutions. The results obtained are compared with corresponding experiments performed with a graphite electrode, and are discussed on the basis of the above mechanisms.
2 Experimental
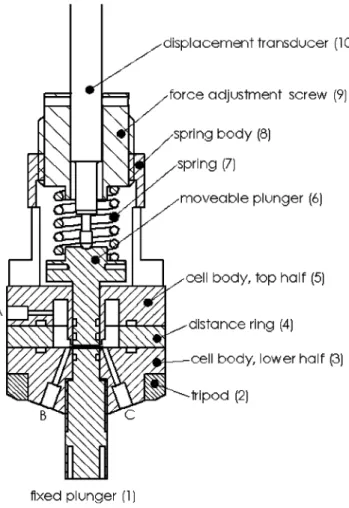
The electrochemical measurements were per-formed with a purpose-made dilatometer (Fig. 1). Related set-ups were used by Biberacher et al. [12], Besenhard et al. [13], Winter et al. [14], and Ohzuku et al. [15]. Basically the dilatometer consists of a cell stack, i.e. two electrodes sep-arated by a paper separator. The lower electrode is fixed and serves as the counter electrode (CE) while the upper elec-trode serves as the working elecelec-trode (WE) and is free to move against a constant load (20 N) applied by means of a spring. The overall height change of the cell is monitored by an in-ductive displacement transducer (W5TK, in combination with a measuring amplifier MGT 233.D4, both by Hottinger Bald-win Messtechnik, Germany) mounted on top of the plunger that contacts the WE. In order to avoid any pressure build up due to gas evolution, the cell was connected to atmospheric pressure via a drying agent (molecular sieve 0.4 nm, Merck) filled column.
A small stripe of the EDLC electrode material (2×4 mm2) being fixed and contacted by an aluminum wire served as the reference electrode. All electrode potentials are referred to the immersion potential (ip) of the EDLC electrode, 3.05 V vs. Li/Li+. The potential was controlled by means of a
potentio-FIGURE 1 Dilatometer in the full cell configuration. The cell stack is lo-cated between the two plungers (1 and 6). One opening (B) serves as the electrolyte solution inlet. The second opening (A) connects the cell volume via a drying column to atmospheric pressure. An aluminum wire contacting the reference electrode is introduced through the third opening (C)
stat (model 273A, EG&G Princeton Applied Research). Some electrochemical impedance measurements were performed in combination with an impedance/gain-phase analyzer (model 1260, Solartron).
The cell components are made of titanium grade 2 (current collectors), PEEK (housing), and EPDM (sealings). A com-mercial EDLC electrode material was employed, which con-sists of a 0.15-mm-thick PTFE-bound activated carbon film. One series of measurements was performed with a graph-ite electrode. This electrode was prepared by spin coating an aqueous suspension of graphite (KS44, Timcal, with 10 wt. % carboxymethylcellulose sodium salt, Merck) on an etched aluminum foil (0.03-mm thick) and subsequent drying. By repeating this procedure several times a 0.016-mm-thick coat-ing with a total mass of 1.2 mg was prepared.
After assembly in air the dilatometer (with the displace-ment transducer detached) was dried for 24 h at 140◦Cand < 0.01 mbar in a vacuum oven, then cooled to ambient tem-perature in argon atmosphere, transferred to a glove box (ar-gon,< 10 ppm water), and finally filled there with the elec-trolyte solution, 1 mol/l tetraethylammoniumtetrafluorobo-rate (TEABF4) in acetonitrile (< 20 ppm water). Measure-ments were performed outside the glove box in a test cabinet at constant temperature (25± 0.05◦C).
The dilatometer was used in three different configurations. (i) For measurements of EDLC full cell height changes two identical electrodes (10-mm diameter, 0.15-mm thick, 8.5 mg) were used, and the cell voltage was controlled. The full cell equivalent series resistance (real part of the impedance) measured at 0 V was about 0.8 Ω at 1 kHz and 2 Ω at 0.01 Hz.
(ii) For EDLC half cell measurements the WE (10-mm diameter, 0.15-mm thick) was combined with a large CE (diameter 18 mm, height 2 mm) made from the same EDLC electrode material. Due to the much higher capacitance, the CE potential stays almost pinned. The WE potential was con-trolled with respect to the reference electrode. In this configu-ration the full cell equivalent series resistance was about 1.3 Ω at 1 kHz and 7Ω at 0.01 Hz.
(iii) Half cell measurements of the graphite electrode were performed using a large CE (18-mm diameter, 2-mm thick) made from the same EDLC electrode material. The poten-tial of the much smaller graphite electrode (10-mm diameter, 0.016-mm thick) was controlled with respect to the reference electrode.
The dilatometer was designed to minimize parasitic back-ground currents stemming from other components than the carbon electrodes themselves. However, at extreme positive potentials, a small parasitic background current was caused by the titanium current collectors. The reported cyclic voltam-mograms and Coulombic efficiencies are not corrected for this background.
The resolution of the dilatometer was about 20 nm. In the discharged state (U= 0) and after a settling period of 6 h (after filling) drifts of< 100 nm/h and < 300 nm/day were measured.
A nitrogen adsorption measurement of the EDLC elec-trode material was performed with an ASAP 2010 apparatus (Micromeritics) at 77 K. Prior to measurement the sample was
outgassed at 250◦Cfor 24 h. From the isotherm the pore-size distribution was calculated according to the density functional theory (DFT) method [16] assuming slit-shaped pores.
3 Results
3.1 Pore-size distribution
The pore-size distribution as obtained by DFT an-alysis of the nitrogen adsorption isotherm is shown in Fig. 2. For the incremental surface area two maxima are observed around 0.7-nm and 1.3-nm pore widths. The cumulative sur-face dred plot shows that almost the entire sursur-face is generated by pores below 2 nm.
3.2 Voltammetry and height change
Several cycles of the cyclic voltammogram (CV) and the concomitant height changes of an EDLC cell (con-figuration (i), see Sect. 2) are shown in Fig. 3. The current is normalized to the weight of the dry electrodes and the sweep
FIGURE 2 Incremental surface area (solid line) and cumulative surface area (dashed line) of the EDLC electrode material as obtained by DFT an-alysis of the nitrogen adsorption isotherm
FIGURE 3 CV (second to fifth cycles, top) and simultaneous dilatation record of a full EDLC cell with a total electrode height of 0.3 mm. Scan rate: 20 mV/s. Electrolyte solution: 1 M TEABF4in acetonitrile
rate, thus yielding the gravimetric cell capacitance. The CV shows almost ideal capacitor behavior with a slight increase of the capacitance towards the charged state. During charg-ing, we observe a smooth increase of the cell height with perpetually increasing slope. A significant expansion of the cell is evident for voltages above 1.5 V. A distinct hystere-sis between the charging and the discharging branches can be seen. At the upper vertex points of the CV (2.5 V), i.e. for the fully charged capacitor cell, half cell potentials of−1.35 V and+1.15 V, respectively, were measured.
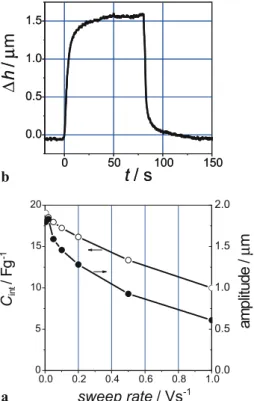
In order to estimate the time response of the electrode ex-pansion we performed CVs with different scan rates. Both the overall height change (amplitude) and the integral capacitance decrease with increasing scan rate (at U= 2.5 V, Fig. 4a). From the time response of the height change when apply-ing a staircase voltage profile (0 to 2.5 V) one can determine a time constant of only a few seconds for the expansion pro-cess (Fig. 4b).
In order to distinguish between the contributions of the two electrodes, we performed half cell measurements in the respective potential ranges of the single electrodes (0 to
−1.35 V for the negative, and 0 to +1.15 V for the positive).
For this purpose we used the dilatometer with a large CE (con-figuration (ii)). In this set-up the CE potential stays almost constant and, since we expect no dimensional changes close to the ip, any observed changes can be attributed to the WE. The results obtained with one and the same electrode, first for cycling in the negative, and then for cycling in the positive po-tential range, are shown in Fig. 5. For the positive as well as for the negative CV dimensional changes of the electrode are evidenced with a maximum expansion of 0.25 µm for the
pos-FIGURE 4 (a) Integral capacity and full cell height change (amplitude) upon cycling between 0 and 2.5 V as a function of the scan rate. (b) Time response when applying a staircase voltage profile (0 to 2.5 V)
FIGURE 5 Top: EDLC half cell CVs (first to fifth cycles) for the negative (0 to−1.35 V) and the positive (0 to 1.15 V) potential ranges. Scan rate: 10 mV/s. Bottom: simultaneous dilatation record
itive and 1.0 µm for the negative CV. The sum of both values is in reasonable agreement with the value of 1.4 µm obtained for the full cell with two electrodes in Fig. 3. Thus, for a capacitor voltage of U= 2.5 V, 75% of the full cell expansion (and most of the hysteresis) occurs at the negative electrode. Maximum charge capacities of−86.3 A s/g (with 99.5% Coulombic ef-ficiency) and 83.0 A s/g (with 98.0% Coulombic efficiency) were determined for the third cycle of the negative and the positive voltage ranges, respectively.
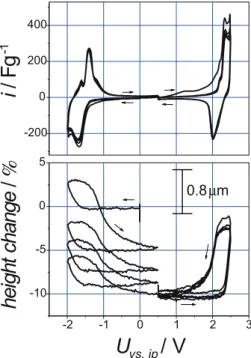
The situation changes when extending the voltage window (Fig. 6). For the negative potential range (0 to−2 V) a much more pronounced height change of several µm is now ob-served. On the other hand, the CV retains its featureless shape and quasi-stationary behavior is again attained within a few cycles. The maximum charge capacity is−149.5 A s/g with 98.7% efficiency (third cycle).
For the extended positive range (0 to+2 V) the height change is again smaller than for the negative range but no longer fully reversible, and a continuous swelling of the elec-trode is observed during cycling. At the same time, a Coulom-bic efficiency of only 75.5% (third cycle) and a maximum charge capacity of 237.6 A s/g are found. In the potential range between 1.5 V and 2.0 V a current increase is observed during the forward scan, which has no counterpart in the sub-sequent backward scan. Measurements with the sample-free dilatometer indicate that the poor Coulombic efficiency is not mainly due to parasitic charge transfer at the titanium current collector.
To cross check and to quantify our intercalation/insertion hypothesis, we also performed measurements with a graph-ite electrode (dilatometer in the half cell configuration (iii)). The results obtained with one and the same graphite electrode, first for cycling in the negative potential range (0 to−2.0 V vs. the EDLC immersion potential), and then for cycling in the positive potential range (0 to +2.5 V), are shown in
FIGURE 6 Top: EDLC half cell CVs (first to fifth cycles) for the extended negative (0 to−2 V) and the extended positive (0 to 2 V) potential ranges. Scan rate: 10 mV/s. Bottom: simultaneous dilatation record
FIGURE 7 Top: graphite half cell CVs (first to fourth cycles) for the nega-tive (0 to−2.0 V) and the positive (0 to 2.5 V) potential ranges. Scan rate: 5 mV/s. Bottom: simultaneous dilatation record
Fig. 7. The potential limits were chosen so as to obtain a max-imum charge capacity without obvious deterioration over a few cycles. Intercalation and concomitant expansion start at −1.5 V and +2.0 V, respectively. The maximum charge capacities amount to−146.5 A s/g with 84.8% Coulombic ef-ficiency (third cycle) and 138.6 A s/g with 68.4% efficiency. The relative height change for the positive potential range is significantly bigger for the graphite electrode than for the 10 times thicker EDLC electrode (Fig. 6). Upon cycling
in the negative potential range a continuous shrinking of the graphite electrode is observed, making it difficult to es-timate the expansion during cation intercalation. For both intercalation/deintercalation processes, a pronounced hys-teresis is observed.
4 Discussion
We have demonstrated for the first time that a re-versible expansion of the electrode material occurs in typi-cal EDLCs utilizing a high surface area activated carbon and an aprotic electrolyte solution. The observed effect is orders of magnitude larger than the one reported for double-layer charging of different carbons in aqueous electrolyte solu-tions [9–11]. Such pronounced dimensional changes during charge/discharge cycles are generally believed to cause or at least to contribute to degradation and cycle life limitation in batteries. For EDLCs, which have demonstrated a cycle life of several hundred thousand cycles, the observation of di-mensional changes of the electrode material is rather surpris-ing. On the other hand, if one could understand this process one might be able to improve the stability of EDLCs even further.
As mentioned in the introduction, we could identify three possible processes leading to charge-induced dimensional changes of carbon materials. Intralayer C−C bond length widening, however, can be neglected on the basis of our re-sults. First of all, injection of negative charge is predicted to cause expansion, while injection of positive charge should cause shrinking. In contrast, we observe expansion for either sign of the charge. Moreover, the predicted effect is much smaller than the presently measured one. Consequently, this effect can be excluded.
Likewise, the surface-tension hypothesis [9–11] can only account for small expansion effects (< 0.05%) that are orders of magnitude smaller than the presently observed ones. Hence, this explanation can also be abandoned.
However, in this context another, somehow related, hy-pothesis should be mentioned. When the carbon is envisaged as an agglomeration of nanometer-sized crystallites (as it is in the surface-tension hypothesis), the observed expansion might as well be due to the insertion of ions between these particles, and not due to the insertion between the graphene planes of the individual particles. We cannot fully exclude this explanation on the basis of the present results. However, for such an interparticle distance increase, one would expect a decrease of the electronic mobility across the electrode, i.e. between the particles. This is in clear contradiction to previous findings, according to which the electronic conductance of AC electrodes (which is governed by both the mobility and the density of charge carriers) does significantly increase during charging [17, 18].
In conclusion, the most probable effect leading to the ob-served dimensional changes is ion intercalation. For highly graphitized carbons, the electrochemical intercalation of both cations and anions from aprotic solutions is well estab-lished. In particular, the intercalation of tetraalkylammonium cations from aprotic solutions has been demonstrated by Besenhard [19, 20] and other workers [21, 22]. Santhanam and Noel [21] evidenced the intercalation of
tetrafluorobo-rate anions into graphite from acetonitrile solution by X-ray diffraction.
Only recently, we observed the intercalation /deinter-calation of both anions and cations from TEABF 4/propylen-carbonate solution into highly oriented pyrolytic graphite by means of in situ atomic force microscopy [23]. However, such intercalation effects were not discussed previously in the con-text of activated carbon based double layer capacitors. Our observations also open some analogy to the intercalation of alkali-metal ions (Li+ and Na+) into the nanocrystallites of hard carbons [24].
Recently, JEOL Ltd. (Japan) introduced a novel high en-ergy electrochemical (‘Nanogate’) capacitor, which utilizes a petroleum coke based KOH activated carbon with a surface area of about 100 m2/g, and a solution of TEABF
4in propy-lene carbonate [25]. Only upon first charging to above 2.5 V (cell voltage) is the capacitance developed by ion (and prob-ably also solvent) intercalation into this special carbon [26]. During intercalation a significant increase in pressure is ob-served for a dimensionally fixed set-up [26]. Takeuchi et al. [27] also measured the onset of insertion processes as a function of graphene layer spacing (d) of the pristine mate-rial and found that the onset voltage increases almost linearly from below 2 V (d= 0.38 nm) to above 3 V (d = 0.36 nm). This observation may also explain the high onset voltage of about 3.5 V (Fig. 7) for intercalation in graphite and the sig-nificant lower onset for AC (about 1.5 V, Fig. 6).
In order to estimate the contribution of insertion /inter-calation processes to the overall charge capacity we calculated the relative expansion for graphite and AC vs. the accumu-lated charge. Figure 8 shows the relative height changes of the graphite and the EDLC electrodes, respectively, as a func-tion of the mass specific charge. For clarity, only the charging branches of the third cycle (starting at 0 V) are shown. The re-sults clearly show that the relative expansion of graphite for a specific charge is larger than the respective expansion of AC. This difference was to be expected in view of the very different surface areas per gram. For AC, about every sec-ond or third carbon atom is part of the huge inner surface and
FIGURE 8 Relative height change of the graphite electrode (dashed line) and the EDLC electrode (solid line) upon charging as a function of the mass specific charge. (Charging data of third cycle taken from Figs. 6 and 7.) Also shown is the number of carbon atoms per elementary charge, n
therefore is accessible to double-layer charging at the ip. In contrast, the graphene layers of graphite (with a negligible surface area per gram) only become accessible upon intercala-tion; expansion is therefore a pre-requisite for charge storage in graphite.
A quantitative comparison of the height changes of the two electrodes, however, is difficult. First, expansion is not nec-essarily uniform inside the electrodes (due to different forces acting in the normal and the horizontal directions of the elec-trode, and due to possible anisotropies inside the electrodes). Second, part of the volume expansion might not result in a height change, but instead in a void volume reduction in-side the electrode. Third, irreversible swelling or shrinkage may be superimposed on the recorded height changes. This is obviously the case for the positive branch of AC (slight swelling, Fig. 6) and even more pronounced for the negative branch of graphite (shrinkage, Fig. 7). Therefore, the compar-ison of both electrode materials shown in Fig. 8 misleads one to strongly under-estimate graphite expansion upon negative charging, and to slightly over-estimate EDLC expansion upon positive charging.
Ignoring the above caveat, and comparing only the posi-tive branches in Fig. 8, we estimate the intercalation contribu-tion to be about 10% (at Q= 90 A s/g, corresponding to the fully charged capacitor with U= 2.5 V).
It can also be seen from Fig. 8 that the charge specific ex-pansion is different for cation and anion insertions. For AC the charge specific expansion (at Q= 90 A s/g) is a factor 2.7 higher for cation insertion. For comparison, the size ratio of the unsolvated ions is only 1.5 [28]. This discrepancy might indicate that the contribution of intercalation processes to the overall capacity is more pronounced for the negative EDLC electrode.
For graphite, the opposite trend is observed; the charge specific expansion (at Q= 90 A s/g) is now a factor 2.7 higher for anion insertion, suggesting strong co-intercalation of solvent.
One may wonder, then, why the EDLC current character-istics (Figs. 5 and 6) do not show the typical intercalation /de-intercalation peaks. In analogy to Li insertion into nanoporous hard carbons [24], this discrepancy may be explained by the heterogeneity and the poor crystallinity of activated carbon. The correspondingly broad distribution of adsorption /inter-calation site energies then results in a pseudocapacitive behavior.
Also, these pseudocapacitive intercalation processes might contribute to the butterfly-like shape of the CV, i.e. the increase of the capacity with increasing excess charge. One should note, however, that the carbon electronic band structure may give a reasonable explanation for this finding [18, 29].
5 Conclusion
We have demonstrated for the first time that charg-ing and dischargcharg-ing of a typical electrochemical double layer capacitor based on AC and an aprotic organic electrolyte is connected with a noticeable expansion of the carbon elec-trode. Expansion can be observed for a capacitor voltage be-low 2 V. Since dimensional changes are always related to stability and lifetime issues of electrochemical devices,
con-trol of this process is important for optimizing the cycle life of EDLCs.
In the context of accelerated life tests, it becomes evident that cycle tests of EDLCs will affect degradation in a different way than constant voltage load tests. While for the former pe-riodic dimensional changes contribute to the degradation, the latter test will be more sensitive to the thermodynamics of the electrode processes.
Finally, we demonstrated that ion insertion into spe-cial carbons, which is the fundamental effect utilized in the ‘Nanogate’ high energy capacitor of JEOL, can also be ob-served for AC-based EDLCs.
We believe that investigation and control of the ion inser-tion process will be of fundamental importance for further development and optimization of EDLCs.
ACKNOWLEDGEMENTSFinancial support of this work by the Swiss CTI (Project Nos. 5807.2 KTS-NM and 5945.2 TNS) and by Maxwell Technologies SA (Rossens, Switzerland) is gratefully acknowledged. We thank Maxwell Technologies SA (Rossens, Switzerland), Timcal SA (Bo-dio, Switzerland), and Honeywell Specialties (Seelze, Germany) for provid-ing the EDLC electrode material, the graphite, and the electrolyte solution, respectively.
REFERENCES
1 M.S. Dresselhaus, G. Dresselhaus, Adv. Phys. 51, 1 (2002) 2 J.R. Dahn, R. Fong, M.J. Spoon, Phys. Rev. B 42, 6424 (1990) 3 L. Pietronero, S. Strässler, Phys. Rev. Lett. 47, 593 (1981) 4 M. Kertesz, Mol. Cryst. Liq. Cryst. 126, 103 (1985)
5 C.T. Chan, W.A. Kamitakahara, K.M. Ho, Phys. Rev. Lett. 58, 1528 (1987)
6 D.E. Nixon, G.S. Parry, J. Phys. C: Solid State Phys. 2, 1732 (1969) 7 W.A. Kamitakahara, J.L. Zarestky, P.C. Eklund, Synth. Met. 12, 301
(1985)
8 J.E. Fischer, H.J. Kim, V.B. Cajipe, Phys. Rev. B 36, 4449 (1987) 9 Y. Oren, I. Glatt, A. Livnat, O. Kafri, A. Soffer, J. Electroanal. Chem.
187, 59 (1985)
10 Y. Oren, A. Soffer, J. Electroanal. Chem. 206, 101 (1986) 11 D. Golub, Y. Oren, A. Soffer, Carbon 25, 109 (1987)
12 W. Biberacher, A. Lerf, J.O. Besenhard, H. Möhwald, T. Butz, Mater. Res. Bull. 17, 1385 (1982)
13 J.O. Besenhard, M. Winter, J. Yang, W. Biberacher, J. Power Source 54, 228 (1995)
14 M. Winter, G.H. Wrodnigg, J.O. Besenhard, W. Biberacher, P. Novak, J. Electrochem. Soc. 147, 2427 (2000)
15 T. Ohzuku, N. Matoba, K. Sawai, J. Power Source 97–98, 73 (2001) 16 DFT User’s Guide v1.03, Micromeritics Instrument Corporation (1993) 17 B. Kastening, M. Hahn, B. Rabanus, M. Heins, U. Zum Felde,
Elec-trochim. Acta 42, 2789 (1997)
18 M. Hahn, M. Baertschi, O. Barbieri, J.-C. Sauter, R. Kötz, R. Gallay, Electrochem. Solid-State Lett. A33, 7 (2004)
19 J.O. Besenhard, H.P. Fritz, J. Electroanal. Chem. 53, 329 (1974) 20 J.O. Besenhard, Carbon 14, 111 (1976)
21 R. Santhanam, M. Noel, J. Power Source 66, 47 (1997) 22 C. Dano, J. Simonet, J. Electroanal. Chem. 564, 115 (2004) 23 F.P. Campana, Thesis, University of Bern (2005)
24 D.A. Stevens, J.R. Dahn, J. Electrochem. Soc. 148, A803 (2001) 25 H. Nakamura, M. Okamura, in 13th International Seminar on Double
Layer Capacitors and Hybrid Energy Storage Devices, Deerfield Beach,
FL (Florida Educational Seminars, Boca Raton, FL, 2003), p. 215 26 M. Takeuchi, K. Koike, T. Maruyama, A. Mogami, M. Okamura,
Elec-trochemistry 66, 1311 (1998)
27 M. Takeuchi, T. Maruyama, K. Koike, A. Mogami, T. Oyama, H. Kobayashi, Electrochemistry 69, 487 (2001)
28 M. Ue, in 8th International Seminar on Double Layer Capacitors and
Similar Energy Storage Devices, Deerfield Beach, FL (Florida
Educa-tional Seminars, Boca Raton, FL, 1998) 29 H. Gerischer, J. Phys. Chem. 89, 4249 (1985)