HAL Id: hal-00673229
https://hal.archives-ouvertes.fr/hal-00673229
Submitted on 26 Apr 2012HAL is a multi-disciplinary open access archive for the deposit and dissemination of sci-entific research documents, whether they are pub-lished or not. The documents may come from teaching and research institutions in France or abroad, or from public or private research centers.
L’archive ouverte pluridisciplinaire HAL, est destinée au dépôt et à la diffusion de documents scientifiques de niveau recherche, publiés ou non, émanant des établissements d’enseignement et de recherche français ou étrangers, des laboratoires publics ou privés.
A simple and efficient method for the long-term
preservation of plant cell suspension cultures.
Anne-Marie Boisson, Elisabeth Gout, Richard Bligny, Corinne Rivasseau
To cite this version:
Anne-Marie Boisson, Elisabeth Gout, Richard Bligny, Corinne Rivasseau. A simple and efficient method for the long-term preservation of plant cell suspension cultures.. Plant Methods, BioMed Central, 2012, 8 (1), pp.4. �10.1186/1746-4811-8-4�. �hal-00673229�
This Provisional PDF corresponds to the article as it appeared upon acceptance. Fully formatted PDF and full text (HTML) versions will be made available soon.
A simple and efficient method for the long-term preservation of plant cell
suspension cultures
Plant Methods 2012, 8:4 doi:10.1186/1746-4811-8-4 Anne-Marie Boisson ([email protected])
Elisabeth Gout ([email protected]) Richard Bligny ([email protected])
Corinne Rivasseau ([email protected])
ISSN 1746-4811 Article type Methodology Submission date 25 November 2011 Acceptance date 30 January 2012
Publication date 30 January 2012
Article URL http://www.plantmethods.com/content/8/1/4
This peer-reviewed article was published immediately upon acceptance. It can be downloaded, printed and distributed freely for any purposes (see copyright notice below).
Articles in Plant Methods are listed in PubMed and archived at PubMed Central.
For information about publishing your research in Plant Methods or any BioMed Central journal, go to
http://www.plantmethods.com/authors/instructions/
For information about other BioMed Central publications go to
http://www.biomedcentral.com/
Plant Methods
A simple and efficient method for the long-term preservation of plant cell
suspension cultures
Anne-Marie Boisson, Elisabeth Gout, Richard Bligny* and Corinne Rivasseau*
Commissariat à l’Energie Atomique, institut de Recherche en Technologies et Sciences pour le Vivant, Laboratoire de Physiologie Cellulaire Végétale, Unité Mixte de Recherche 5168 CNRS, UJF, INRA, CEA, F-38054 Grenoble, France.
[email protected]; [email protected]; [email protected]; [email protected]
*
To whom correspondence should be addressed. E-mail: [email protected] or
Abstract
Background: The repeated weekly subculture of plant cell suspension is labour intensive and
increases the risk of variation from parental cells lines. Most of the procedures to preserve cultures are based on controlled freezing/thawing and storage in liquid nitrogen. However, cells viability after unfreezing is uncertain. The long-term storage and regeneration of plant cell cultures remains a priority.
Results: Sycamore (Acer pseudoplatanus) and Arabidopsis cell were preserved over six
months as suspensions cultures in a phosphate-free nutrient medium at 5°C. The cell recovery monitored via gas exchange measurements and metabolic profiling using in vitro and in vivo
13
C- and 31P-NMR took a couple of hours, and cell growth restarted without appreciable delay. No measurable cell death was observed.
Conclusion: We provide a simple method to preserve physiologically homogenous plant cell
cultures without subculture over several months. The protocol based on the blockage of cell growth and low culture temperature is robust for heterotrophic and semi-autotrophic cells and should be adjustable to cell lines other than those utilised in this study. It requires no
specialized equipment and is suitable for routine laboratory use.
Key words: Plant cell suspension, Acer pseudoplatanus, Arabidopsis thaliana, cell
Background
Suspension culture of isolated plant cells is an invaluable tool for providing the material for high-throughput studies such as metabolic analyses, production of secondary plant products, and herbicide discovery. It enables easy experimentation on physiologically and
biochemically homogenous population of cells. Different methods for cultivating large quantities of plant cells in liquid nutrient medium (NM) have been described for a long time [1-4]. These methods are based on the subculture of cell suspensions having reached their growth plateau when most of the nutrients initially added to NM, particularly carbohydrates, are metabolised. It leads to more or less homogenous cell populations and usually induces a growth delay (lag phase) following subculture [5]. It has been shown that obtaining
homogenous cell suspension cultures requires sophisticated apparatus such as chemostats that optimize NM and cell growth [6]. Alternatively, subcultures every one or two days also yields homogenous cell populations [7], but involve much handling and maintenance that is therefore difficult to perform over long periods of time.
For this reason, alternative procedures to preserve newly optimized cell suspension cultures, ideally for indefinite periods, have been proposed. Apart from the maintenance of cell callus on solid media which lead to appreciable delays to initiate homogenous cell suspension cultures, most of the procedures are based on controlled freezing/thawing and storage in liquid nitrogen [8-12]. However, the viability of the cells after unfreezing is generally low and long lag phases before full recovery of cell culture growth are always mentioned by authors. The highest viability (up to 90 %) was observed by Menges and Murray [13] after cryopreservation of Arabidopsis and tobacco cells in the presence of DMSO and sorbitol. Nevertheless, even in this case, it takes at least one week for cells to
recover normal post-thaw growth and full re-establishment, and there is a risk that preserved cell lines may differ from the original ones [14].
Here, we describe a procedure aiming at preserving higher plant cell populations in their suspension nutrient medium over several months, keeping them homogenous and ready to restart growth after their return to standard culture conditions. The main problem is that, in standard cultures, carbon substrates are consumed within less than two weeks. Afterwards autophagic process and cell death are observed [15,16]. In order to diminish the carbohydrate consumption by cells, cultures were carried out at low temperature in a first series of assays. Cultures were then carried out at low temperature in the absence of phosphate (Pi) so as to induce the arrest of cell growth [17]. In order to validate this procedure, the cell’s
physiological and biochemical states were monitored both via the measurement of cell growth and gas exchange and by in vivo and in vitro metabolic profiling utilising 31P- and
13
C-NMR [18-20]. Indeed, NMR monitoring permits the detection of early signals of metabolic disruption related to carbon deprivation [21] leading to the expression of autophagy-related genes [22]. Heterotrophic sycamore (Acer pseudoplatanus L.) cells and semi-autotrophic Arabidopsis cells (Arabidopsis thaliana L., wild type, Columbia ecotype) were used to compare results obtained with non-chlorophylous cells of cambial origin to those obtained with illuminated chlorophylous cells of leaf parenchyma origin. It was expected that, due to photosynthesis activity, the cellular need for exogenous carbohydrate would be lower, thus permitting a reduction in NM renewal.
Results and discussion
Growth of sycamore and Arabidopsis suspension-cultured cells at 22°C and 5°C
At 22°C, the fresh weight (FW) of weekly subcultured sycamore cells increases
exponentially with time, without a lag phase ([7] and Figure 1A). A plateau corresponding to a cell FW of 150 ± 15 g l-1 of culture is reached after two weeks. If cells are subcultured at this stage, a 2-d lag phase attributed to the exhaustion of sucrose supply and to the beginning of the related process of autophagy is observed. At 5°C, the cell density
doubling time is much longer: 10 d vs 2.5-2.7 d at 22°C (Figure 1B). Interestingly the pH of their NM, initially adjusted to 5.7, increased progressively up to 7.1-7.3. This is
probably due to the presence of nitrate as the only nitrogen source in Lamport’s NM and to the lower emission of acidifying CO2, whereas it remains below 6.5 at 22°C.
The growth of Arabidopsis cells cultivated under photomixotrophic conditions at 22°C showed a similar profile (Additional File 1A) and a plateau corresponding to a cell concentration of 200 ± 20 mg ml-1 culture was reached within ca 10 days. Here too, lowering the temperature resulted in a marked decrease of cell culture growth rate (Additional File 1B). The cell density doubling time increased from 2.1-2.3 d to ca 8 d. Cultures performed in Murashige and Skoog medium use ammonium and nitrate as a nitrogen source, leading the NM’s pH to decrease progressively to ca. 5.0.
The growth rates of both types of cells incubated over one month at 5°C recovered standard values as soon as the culture temperature was set back to 22°C (Figure 1 and Additional File 1, arrows). Despite this extended period of very slow growth, no significant lag phase was observed before cell growth restarted at 22°C, suggesting that the
properties. To confirm this conclusion, measurements of O2-uptake by cells and
NMR-based control of their metabolite profile were performed.
O2-uptake at 22°C and 5°C
The O2 uptake rates of sycamore and Arabidopsis cells cultivated at 22°C, harvested during
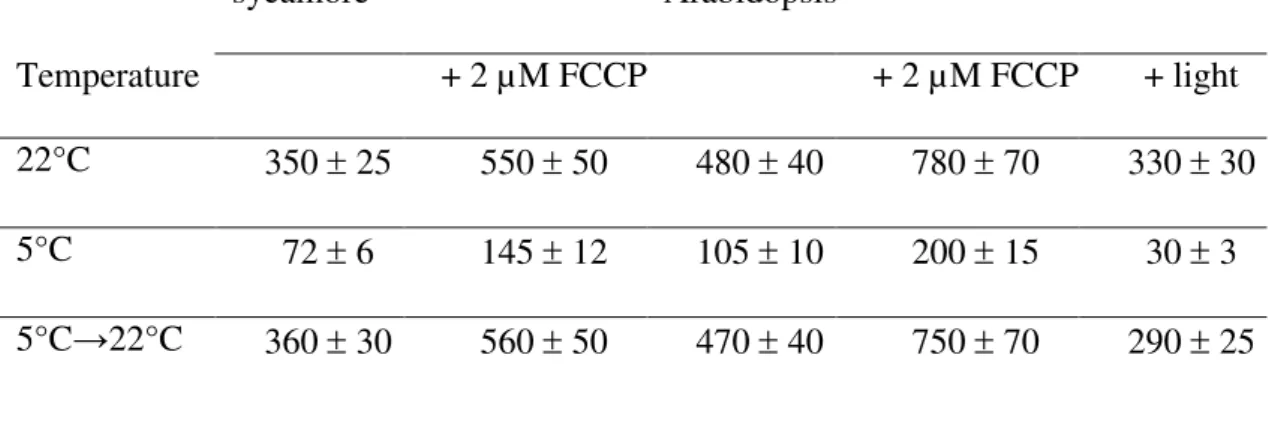
the exponential phase of growth, and measured at 22°C in the dark, were 350 ± 25 and 480 ± 40 nmol O2 min-1 g-1 cell FW, respectively (Table 1). In contrast, the O2 uptake rate of the same cells cultivated at 5°C for 20 d, and measured at 5°C in the dark, was much lower, averaging 72 ± 7 and 105 ± 10 nmol O2 min-1 g-1 cell FW, respectively.
Interestingly, the uncoupled rate of O2 consumption measured in the presence of 2 µM
FCCP showed a higher relative increase at low temperature. This increase was close to 60% at 22°C and reached 100% at 5°C in sycamore and Arabidopsis cells. This indicates that the decrease of the normal (coupled) cell respiration observed at low temperature was not caused by a limitation of substrate supply to mitochondria or by the intrinsic
mitochondria oxidative functioning. It is more likely caused by the general decrease of cell metabolism activity and the correlated decrease of cell need for nucleotide triphosphates (NTP). Increasing the temperature to 22°C after a 20-d incubation at 5°C led to the full recovery of coupled and uncoupled cell respiration within 10 minutes.
The illumination of Arabidopsis cells in the O2-electrode chamber decreased the
O2-uptake by cells by ca 30% at 22°C, probably due to the contribution of O2-generating
photosynthesis activity (Table 1). Indeed, in the light, these chlorophyllous cells
incorporate 13CO2 into carbon metabolites [unpublished result; 23]. At 5°C, illuminating
Arabidopsis cells also decreased the O2-uptake (Table 1). In addition, this decrease was
proportionally greater than that observed at 22°C suggesting that, at low temperature, the photosynthesis activity of illuminated Arabidopsis cells was affected less than their
respiration. Nevertheless, in these semi-autotrophic cells, even at 5°C, the O2 produced by
photosynthesis never compensated for the O2 consumed by respiration.
Metabolite profile of cells cultivated at 22°C and 5°C
The metabolic profiles of sycamore and Arabidopsis cells grown at 22°C and 5°C were analysed from perchloric acid (PCA) extracts using 13C- and 31P-NMR spectroscopy. 13 C-NMR spectra show that lowering the temperature in sycamore cells induces significant change in their carbohydrate and organic acid stores (Figure 2). For example, sucrose decreased from 70-80 µmol g-1 cell FW to 30-35 µmol g-1 cell FW, whereas citrate increased from 5.5-6.5 µmol g-1 cell FW to 40-48 µmol g-1 cell FW and proline increased from 2.5-3.5 µmol g-1 cell FW to 8.5-9.5 µmol g-1 cell FW. Arabidopsis cells did not contain 13C-NMR-detectable carbohydrates, neither at 22 °C nor at 5°C (Additional File 2). This means that their intracellular concentration was below 0.5 µmol g-1 cell FW, whatever the culture temperature. Concerning organic acids, glutamine concentration increased fourfold at low temperature, reaching 25-30 µmol g-1 cell FW, and aspartate twofold, reaching 9-10 µmol g-1 cell FW. On the contrary, citrate and malate, but not fumarate, decreased significantly. The very low level of soluble carbohydrates present in Arabidopsis cells and the low amount of starch [24] could contribute to why a dramatic fall of
physiological activity and extensive transcriptomic responses are observed a few hours only after the onset of sugar deprivation leading to cell death within 24 h [25]. Indeed, in suspension-cultured Arabidopsis cells more than one third of the proteins content is degraded during the first 24 h of sucrose starvation [22], whereas it takes 2-3 d in sycamore cells [26,27].
Increasing the temperature to 22°C after a one-month incubation at 5°C led to the recovery of standard 13C-NMR profiles for both types of cells within a couple of hours. For
example, proline and glutamine which accumulate at low temperature and/or in the absence of Pi [28-30] were metabolised within a few hours. The accumulation of citrate and malate in sycamore cells could be attributed to the fact that the pH of Lamport’s NM alkalizes with time [31]. The contrary was observed with Arabidopsis cells grown in Murashige and Skoog’s NM which acidifies.
31
P-NMR spectra (Figure 3) indicate that sycamore cells accumulate nearly twice as much hexoses phosphate and nucleotides at 5°C than at 22°C (0.70-0.80 µmol glucose 6-P g-1 cell FW at 5°C vs 0.45-0.50 µmol at 22°C, and 140-160 nmol ATP g-1 cell FW at 5°C vs 80-90 nmol at 22°C). Similar results were obtained with Arabidopsis cells with the exception of glycerophosphoglycerol (GPG) accumulating at low temperature (Additional File 3). GPG is a phosphodiester involved in the metabolism of phosphatidylglycerol, the only abundant phospholipid in chloroplast membranes. Importantly, in both cell lines, neither P-choline nor asparagine accumulated, indicating the absence of cytosplasmic autophagy processes known to occur in cells lacking carbon supply [15,16].
Increasing the temperature to 22°C after 20 days of incubation at 5°C led to the recovery of standard cell hexose-P and nucleotide concentrations within 10-15 minutes.
Carbohydrate stores
The consumption of sucrose in a nutrient medium is proportional to the number of cells growing in this medium and, consequently, it increases exponentially in accordance with the exponential growth of cell populations. At 22°C, the rate of carbohydrate consumption by sycamore cells was 40-50 mg sucrose d-1 g-1 cell FW (Figure 4 and Table 2). It took ca 10 d for the sucrose initially present in the NM, where cells were subcultured, to be exhausted. At 5°C, the rate of sucrose consumption per gram of cell FW was 4-5 times lower (Figure 4), and it took 5-6 weeks for the sucrose initially present in the culture medium to be exhausted.
Similar rates of sucrose uptake by Arabidopsis cells cultivated in the light were measured. In the dark it was slightly higher (50-60 mg sucrose d-1 g-1 cell FW at 22°C). At 5°C, the sucrose initially added in NM was consumed within only 4-5 weeks. This indicates that the
contribution of photosynthesis to sugar supply nearly compensated for the slightly higher growth rate of this cell strain. After exhaustion of the sucrose present in NM, the intracellular stores of carbohydrates are consumed and cell autophagy starts [15]. For this reason, it was necessary to subculture cells grown at 5°C at least every 4-5 weeks.
Subculturing cell cultures monthly might nevertheless still look as an excessive constraint. Thus, the question was to determine whether it was possible to further diminish the consumption of carbohydrates by cells whilst at the same time keeping cell suspensions physiologically safe. Since nearly one half of incorporated sugar is consumed by respiration and the other half by different metabolic pathways involved in cell growth [32], we stopped cell growth before lowering the temperature. For this we incubated cells in a Pi-free NM.
Cell culture at 5°C in Pi-starved media and recovery
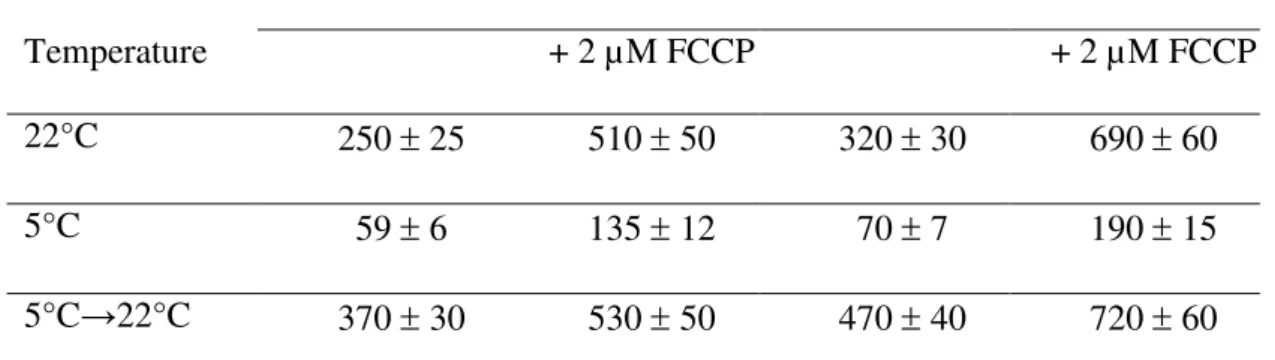
At 22°C, provided sucrose is added regularly to NM, it is possible to keep cell cultures alive in a Pi-free nutrient medium for several months. After a few days, the cell concentrations of Pi, phosphorylated intermediates of glycolysis, and nucleotides dramatically decrease [17,32], whereas the phospholipid/galactolipid ratio is reduced by ca. 70% [33,34]. Under these culture conditions, the growth of sycamore and Arabidopsis cells stops within one week (Figure 5 and Additional File 4). Afterwards, both the cell concentration and the rate of carbohydrate uptake from NM remained constant (Figure 4). Surprisingly, the cell respiration rate of Pi-deprived cells is only 30% lower (Table 3) than that of cells cultivated in standard NM (Table 1). In addition, the uncoupled respiration rates of P- deprived and Pi-supplied cells were similar, indicating that Pi-starvation did not modify the maximum potential
activity of mitochondria. After the addition of Pi to NM, cell respiration recovered to normal values within minutes and cell 31P-NMR spectra showed a normal profile within a couple of hours [17].
When the incubation temperature of Pi-deprived cells was dropped to 5°C, a fivefold decrease of cell respiration was observed (Table 3), as mentioned above in the case of Pi-supplied cells, and the sucrose uptake from the culture medium diminished accordingly (see Figure 4 for sycamore cells). The mean sucrose uptake by sycamore cells was close to 3.4 mg d-1 g-1 cell FW (Table 2). This suggests, since their culture medium initially contains 20 g l-1 sucrose, that it should be possible to keep alive 20 g of cells incubated at 5°C in one litre of a Pi-free NM culture over ca 10 months without renewing the culture medium.
After adding Pi to NMs and returning the temperature to 22°C, the cell respiration of cells stored during 6 months at 5°C in Pi free medium returned to standard values within minutes (Table 3). This suggests that cell suspensions remained physiologically homogenous after months of preservation at low temperature in Pi-free NMs. In particular, no appreciable cell death was measured. Accordingly, Figures 6 and Additional File 5 show examples of sycamore and Arabidopsis cell metabolite profile recovery after 6 months of incubation at 5°C in Pi-free NMs. At time zero, the concentration of cell’s soluble P-compounds was close to the threshold for in vivo 31P-NMR detection of ca 20 nmol. Thirty minutes after the
addition of phosphate in the perfusing NMs, cytoplasmic Pi (cyt-Pi), and NTP recovered standard values, rapidly followed by glucose 6-P and UDP-glucose, and one hour later by vacuolar Pi. After two hours, the in vivo 31P-NMR profiles of sycamore and Arabidopsis cells were close to those of standard cells. In fact, the time course recovery of the metabolite profile of Pi-starved cells incubated over 6 months at 5°C resembles that observed by Pratt et al. [17] for cells incubated 5 days in Pi-free NMs at 22°C. The analysis of in vivo spectra also indicated that the cytoplasmic pH of both types of cells, as measured from the chemical shift
of cyt-Pi as soon as it was unambiguously identified (30 min), remained close to 7.4. This suggests that the regulation of the cytoplasmic pH was maintained by Pi-starved cells
incubated at low temperature, as is the case at 22°C [32]. In vivo 13C-NMR cell profiles of Pi-starved cells cultivated at 5°C were comparable to those of corresponding Pi-supplied cells. Similarly, a full recovery was observed within a few hours: hexoses were metabolised as well as accumulated amino acids.
Finally, the growth rates of cells incubated at low temperature in Pi-free NM rapidly recovered to standard values after the return to standard culture conditions. In particular, no appreciable delay was noticed (Figure 5) and cells can be further normally subcultured. This confirms that the preservation of culture cells at low temperature in a Pi-free medium not permitting cell growth, and without the addition of growth inhibitors, did not generate long-lasting physiological and metabolic changes. Importantly, in vitro and in vivo 13C- and 31 P-NMR analyses showed that the metabolic changes observed at low temperature in the absence of Pi in NM were rapidly reversed following the return to standard cell culture conditions. In addition, the absence of lag phase during the recovery of full cell respiration and growth rates suggests that the cell population remains physiologically homogenous during the preservation period.
The protocol for preserving plant cells without subculture over several months is described step-by-step in Additional file 6.
Conclusion
The incubation of sycamore and Arabidopsis cells in a Pi-free nutrient medium at 5°C allowed the cell lines to stay alive for several months. This was due to the arrest of cell growth resulting from Pi starvation, which was initiated 10 days before lowering the temperature, and to the large decrease of cell metabolic activity at low temperature as
indicated by the drop of respiration. Importantly, no cell death was observed and cells
recovered a normal physiological and biochemical activity without a long delay or lag period. To summarize, the procedure of cell preservation described in this paper opens the possibility of storing plant cells lines for several months whilst retaining their capacity to restart growing homogenously and without delay. It can be performed easily and routinely, without requiring any specific equipment, freezing procedure, or addition of growth inhibitors. This method for the preservation of suspension cultured cell lines, with a medium renewal every 6 months only, is now routinely used in our laboratory.
Material and Methods
Plant material and growth conditions
Sycamore (Acer pseudoplatanus L.) and Arabidopsis (Arabidopsis thaliana L.) cells were respectively grown in Lamport [2] and Murashige and Skoog [35] nutrient media as described by Bligny and Leguay [36]. Both types of cells were aerated on orbital shakers monitored at 120 rpm in either a cell culture room at 22°C, or in a cold room at 5°C. Arabidopsis cells received continuous illumination delivering 100 µmol m-2 s-1
photosynthetic photon flux density (PPFD) whatever the temperature. Nutrient media
contained 20 g l-1 sucrose as carbohydrate source. At 22°C, cell suspensions were subcultured each 7 days, i.e. before sucrose present in NM was exhausted, by adding 40 ml of old cell culture to 200 ml of fresh NM in 800-ml flasks in order to obtain an initial cell concentration of nearly 5-10 mg FW ml-1. At 5°C cells were subcultured when 90% of the initially added sucrose was consumed.
Metabolomic analyses using NMR
Analyses were performed either in vitro from perchloric acid (PCA) cell extracts or in vivo using freshly harvested cells. Extracts were prepared from 10-g (wet wt) cells quickly filtered, washed with pure water at 0°C, and thrown into liquid nitrogen. Frozen samples with 0.7 ml of 70% (v/v) PCA were ground to a fine powder with a mortar and pestle at liquid nitrogen temperature. The frozen powder was then thawed at 0°C and the resulting thick suspension was centrifuged at 15,000 g for 10 min at 0°C to remove particulate matter. The supernatant was neutralised to pH 5.0 with 2 M KHCO3 to precipitate PCA as KClO4, centrifuged at 15,000 g for 5 min and lyophilised. The freeze-dried material was
dissolved in 2.0 ml water containing 10% 2H2O for further NMR adjustment and 1µM
sodium azide to avoid fermentation when unfrozen, and it was stored at -20°C.
In vitro NMR analyses were performed on a Bruker AMX 400 wide bore spectrometer (Bruker Instruments, Inc., Billerica, MA, USA) equipped with a 10-mm multinuclear-probe. The probe was tuned at 100.6 and 162.0 MHz for 13C- and 31P-NMR, respectively. The deuterium resonance of 2H2O was used as a lock signal. Spectra were
recorded at 295 K. 13C-NMR spectra were the result of 3600 transients with a 6-s repetition time (6 h) recorded with 90° pulses (11 µs), a 20 kHz spectral width, and a Waltz-16 1H decoupling sequence with 2.5 W and 0.5 W during acquisition time and delay,
respectively. Free induction decays were collected as 32,000 data points, zero-filled to 64,000 and processed with a 0.2-Hz exponential line broadening. 31P-NMR spectra were the result of 1000 transients with a 3.6-s repetition time (1 h) recorded with 70° pulses (15 µs), a 8.2 kHz spectral width, and a Waltz-16 1H decoupling sequence with 1 W during acquisition and 0.5 W during delay, respectively. Free induction decays were collected as
16,000 data points, zero-filled to 32,000 and processed with a 0.2-Hz exponential line broadening.
For 13C-NMR analyses, 4 µmol 1,2-cyclohexylenedinitrilotetraacetic acid (CDTA) was added to the PCA extract to chelate Mn2+, 150 µmol of maleate was added for
calibration, and the pH was adjusted to 7.4. Spectra were referenced to the -CH=CH- peak of maleate positioned at 131.4 ppm. For 31P-NMR analyses, all divalent cations were chelated by the addition of sufficient amounts of CDTA, 2 µmol methylphosphonate was added for calibration, and the samples were buffered by addition of 150 µmol Hepes at pH 7.4. Spectra were referenced to the peak of methylphosphonate positioned at 22.67 ppm. The identification of the peaks of resonance was done by comparing the spectra of standard solutions of known compounds at pH 7.4 with that of the PCA extracts. The definitive assignments were made after running a series of spectra of the extracts spiked with authentic compounds, at different pHs to separate potentially overlapping peaks [18]. To accurately quantify compounds identified on spectra, the intensities of their different resonance peaks were referred to those of the reference compounds added to samples before grinding. Twenty seconds recycling time was used to obtain fully relaxed spectra. The integration function of the spectrometer was utilized to compare the intensity of resonance peaks.
In vivo NMR analyses were performed on the same spectrometer equipped with a 25-mm multinuclear-probe. The deuterium resonance of 2H2O was used as a lock signal.
Cells (10 g FW) were placed in a 25-mm NMR tube and oxygenated as described by Aubert et al. [18] with a perfusion flux of 20 ml min-1 sufficient for a perfect oxygenation of all cells at 22°C. The 4 l of perfusion NM contained the macro-nutrients (sucrose, KNO3, NH4NO3, KCl, Ca[NO3]2, and MgSO4) normally present in 200 ml of Lamport’s or
of 10 g of cells over several days and limits decoupling-related temperature elevation at the level of analyzed cells. To further improve the signal-to-noise ratio, micro-nutrients, and in particular Mn2+, were not added to NM. The temperature of the perfusing NM was adjusted in a thermoregulated water bath outside the magnet.
13
C-NMR spectra were acquired by accumulating 900 scans recorded with 90° pulses (70 µs) at 5.6-s intervals, a 20.7 kHz spectral width, and a Waltz-16 1H decoupling
sequence with 4 W and 0.5 W during acquisition time and delay, respectively. Free
induction decays were collected as 16,000 data points, zero-filled to 32,000, and processed with a 2-Hz exponential line broadening. Spectra were referenced to hexamethyldisiloxane contained in a capillary inserted inside the central outlet perfusion tube at 2.7 ppm. 31 P-NMR spectra were acquired as described by Pratt et al. [17]. Spectra were referenced to methylenediphosphonate (MDP, pH 8.9) contained in the same capillary, at 17.38 ppm. The identification of the resonance peaks was performed by comparing the in vivo spectra of perfused cells to those of PCA extracts prepared from these cells and adjusted at different pHs, as described above. In vivo quantification was performed by comparing the spectra of analyzed cells with those of the extracts prepared from the same amount of cells, and using the MDP reference. The concentration of metabolites in the cytoplasm and in the vacuole were calculated as indicated in Pratt et al. [17]. Cytoplasmic and vacuolar pH (cyt- and vac-pH) was estimated from the chemical shift of the pools of Pi (cyt- and vac-Pi) present in these two compartments as described by Gout et al. [21].
Other analytical methods
The cell samples FW and the growth of cell suspensions were measured as described by Bligny and Leguay [36]. The oxygen uptake by cells was measured at 5°C and 22°C in their respective cell culture media. O2-uptake was monitored polarographically using a
Clark-type oxygen-electrode (Hansatech Ltd King's Lynn, UK). 50 mg cell (FW) was stirred in the 1 ml measurement chamber filled with NM. The O2 concentration in the
air-saturated NM was taken as 250 µM at 22°C and 360 µM at 5°C according to Truesdale and Downing [37]. Uncoupled respiration was measured after adding 2 µM cyanide
p-trifluoromethoxyphenylhydrazone (FCCP). For photosynthesis measurements, Arabidopsis cells were illuminated with 500 µmol m-2 s-1 PPFD.
The sucrose present in NM was measured as described by Bergmeyer [38], using invertase, hexokinase, and glucose 6-P dehydrogenase, and by 13C-NMR.
Neutral red was be used as a vital stain to detect the presence of dead cells in cultures. When means ± SD are given, the statistical Student’s t-test was applied to the data with P values ≤ 0.05.
List of abbreviations
Pi: inorganic phosphate; PCA: perchloric acid; NM: nutrient medium; NMR: nuclear magnetic resonance
Acknowledgements
We thank Dr James Tabony for reading the draft of the manuscript and for critical comments. We are indebted to Jean-Luc Le Bail for his assistance with NMR.
Author’s contribution
RB and CR conceived the study and drafted the manuscript. A-M B and EG carried out the analysis and contributed to draft the manuscript. All authors approved the final manuscript.
Competing interests
References
1. Tulecke W, Nickel LG: Methods, problems and results of growing plant cells under
submerged conditions. Transactions of New York Academy of Sciences 1960,
22:196-206.
2. Lamport DTA: Cell suspension cultures of higher plants: isolation and growth
energetics. Experimental Cell Research 1964, 33:195-206.
3. Short KC, Brown EG, Street HE: Studies on the growth in culture of plant cells. V.
Large-scale culture of Acer pseudoplatanus L. cell suspensions. Journal of
Experimental Botany 1969, 20:572-578.
4. Wilson JB, King PJ, Street HE: Studies on the growth in culture of plant cells. XII.
A versatile system for the large scale batch or continuous culture of plant cell suspensions. Journal of Experimental Botany 1971, 22:177-207.
5. Henshaw GG, Jha KK, Mehta AR, Shakeshaft DJ, Street HE: Studies on the growth in
culture of plant cells. I . Growth patterns in batch propagated suspension cultures. Journal of Experimental Botany 1966, 17: 362-377.
6. Monod J: La technique de culture continue. Théorie et applications. Annales de l’Institut Pasteur 1950, 79:390-410.
7. Bligny R: Growth of suspension-cultured Acer pseudoplatanus L. cells in automatic
units of large volume. Plant Physiology 1977, 59:502-505.
8. Nag KK, Street HE: Freeze preservation of cultured plant cells. Part I. The
pretreatment phase. Physiologia Plantarum 1975a, 34:254-260.
9. Nag KK, Street HE: Freeze preservation of cultured plant cells. Part II. The
10. Maddox AD, Gonsalves F, Shields R: Successful preservation of suspension-cultures
of 3 Nicotiana species at the temperature of liquid-nitrogen. Plant Science letters
1983, 28:157-162.
11. Jain S, Jain RK, Wu R: A simple and efficient procedure for cryopreservation of
embryogenic cells of aromatic Indica rice varieties. Plant cell reports 1996,
15:712-717.
12. Kim SI, Choi HK, Son JS, Yun JH, Jang MS, Kim HR, Song JY, Kim JH, Choi HJ, Hong SS: Cryopreservation of Taxus chinensis suspension cell cultures. Cryo-letters 2001, 22:43-50.
13. Menges M, Murray JAH: Cryopreservation of transformed and wild-type
Arabidopsis and tobacco cell suspension cultures. Plant Journal 2004, 37:635-644.
14. Zeliang PK, Pattanayak A, Inagrai B, Khongwir EA, Sarma BK: Fertile plant
regeneration from cryopreserved calli of Oryza rufipogon Griff. and assessment of variation in the progeny of regenerated plants. Plant Cell Report 2010,
29:1423-1433.
15. Roby C, Martin J-B, Bligny R, Douce R: Biochemical changes during sucrose
deprivation in higher plant cells. Phosphorus-31 nuclear magnetic resonance studies. Journal of Biological Chemistry 1987, 262:5000-5007.
16. Aubert S, Gout E, Bligny R, Mazars-Marty D, Barrieu F, Alabouvette J, Marty F, Douce R: Ultrastructural and biochemical characterization of autophagy in higher
plant cells submitted to carbon deprivation; control by the supply of mitochondria with respiratory substrates. Journal of Cell Biology 1996a, 133:1251-1263.
17. Pratt J, Boisson A-M, Gout E, Bligny R, Douce R, Aubert S: Phosphate (Pi)
tonoplast in plant cells: an in vivo 31P-nuclear magnetic resonance study using
methylphosphonate as Pi analog. Plant Physiology 2009, 151:1646-1657.
18. Aubert S, Bligny R, Douce R: NMR studies of metabolism in cell suspensions and
tissue cultures. In Nuclear Magnetic Resonance in Plant Physiology. Edited by
Shachar-Hill Y, Pfeffer P. Rockville, USA: American Society of Plant Physiologists; 1996b:109-154.
19. Fan TW-M: Recent advances in profiling plant metabolites by multi-nuclear and
multi-dimensional NMR. In Nuclear Magnetic Resonance in Plant Physiology. Edited
by Shachar-Hill Y, Pfeffer P. Rockville, USA: American Society of Plant Physiologists; 1996:181-254.
20. Krishnan P, Kruger NJ, Ratcliffe RG: Metabolite fingerprinting and profiling in
plants using NMR. Journal of Experimental Botany 2005, 56:255-265.
21. Gout E, Bligny R, Douce R, Boisson A-M, Rivasseau C: Early response of plant cell
to carbon deprivation: in vivo 31P-NMR spectroscopy shows a quasi-instantaneous
disruption on cytosolic sugars, phosphorylated intermediates of energy
metabolism, phosphate partitioning, and intracellular pHs. New Phytologist 2011, 189:135-147.
22. Lundgren Rose T, Bonneau L, Der C, Marty-Mazars D, Marty F: Starvation-induced
expression of autophagy-related genes in Arabidopsis. Biology of the Cell 2006, 98:53-67.
23. Chen W-P, Yang X-Y, Harms GL, Gray WM, Hegeman AD, Cohen JD: An automated
growth enclosure for metabolic labeling of Arabidopsis thaliana with 13C-carbon
dioxide – an in vivo labeling system for proteomics and metabolomics research.
24. Williams TCR, Miguet L, Masakapalli SK, Kruger NJ, Sweetlove LJ, Ratcliffe RG:
Metabolic network fluxes in heterotrophic Arabidopsis cells: stability of the flux distribution under different oxygenation conditions. Plant Physiology 2008, 148:704-718.
25. Contento AL, Kim S-J, Bassham DC: Transcriptome profiling of the response of
Arabidopsis suspension culture cells to suc starvation. Plant Physiology 2004, 135:2330-2347.
26. Journet E-P, Bligny R, Douce R: Biochemical changes during sucrose deprivation in
higher plant cells. Journal of Biochemical Chemistry 1986, 261:3193-3199.
27. Genix P, Bligny R, Martin J-B, Douce R: Transient accumulation of asparagine in
sycamore cells after a long period of sucrose starvation. Plant Physiology 1990, 94:717-722.
28. Pollock CJ, ap Rees T: Effect of cold on glucose metabolism by callus and tubers of Solanum tuberosum. Phytochemistry 1975, 14:1903-1906.
29. Withers LA, King PJ: Proline: a novel cryoprotectant for the freeze preservation of
cultured cells of Zea mays L. Plant Physiology 1979, 64:675-678.
30. Dorne A-J, Bligny R: Physiological adaptation to subantarctic climate by the
Kerguelen cabbage, Pringlea antiscorbutica R. Br. Polar Biology 1993, 13:55-60.
31. Gout E, Bligny R, Pascal N, Douce R: 13C nuclear magnetic resonance studies of
malate and citrate synthesis and compartmentation in higher plant cells. Journal of
Biological Chemistry 1993, 268:3986-3992.
32. Gout E, Boisson A-M, Aubert S, Douce R, Bligny R: Origin of the cytoplasmic pH
changes during anaerobic stress in higher plant cells. Carbon-13 and phosphorus-31 nuclear magnetic resonance studies. Plant Physiology 2001, 125:912-925.
33. Jouhet J, Maréchal E, Baldan B, Bligny R, Joyard J, Block M A: Phosphate
deprivation induces transfer of DGDG galactolipid from chloroplast to mitochondria. Journal of Cell Biology 2004, 167:863-874.
34. Misson J, Raghothama KG, Jain A, Jouhet J, Block MA, Bligny R, Ortet P, Creff A, Somerville S, Rolland N, Doumas P, Nacry P, Herrerra-Estrella L, Nussaume L, Thibaud M-C: A genome-wide transcriptional analysis using Arabidopsis thaliana
Affymetrix gene chips determined plant responses to phosphate deprivation.
Proceedings of the National Academy of Sciences USA 2005, 102:11934-11939 35. Murashige T, Skoog F: A revised medium for rapid growth and bioassay with
tobacco tissue cultures. Physiologia Plantarum 1962, 15:473–497.
36. Bligny R, Leguay J-J: Techniques of cell suspension culture. Methods in Enzymology 1987, 148:3-16.
37. Truesdale GA, Downing AL: Solubility of oxygen in water. Nature 1954, 173:1236. 38. Bergmeyer HU: Methods of Enzymatic Analysis. Volume 3. New York: Academic press;
Figure legends
Figure 1 Growth of suspension-cultured sycamore cells at 22°C and 5°C. Cells were
cultivated in Lamport’s nutrient medium as described in “Material and Methods”. They originated from an exponentially growing cell suspension maintained at 22°C and repeatedly subcultured before the growth plateau. The cell concentration (FW) at time zero was 5.0 mg ml-1 culture. At 22°C (a), cells grew exponentially for 10 d (linear on semi-logarithmic plot) before reaching a plateau. At day 14, the dilution of cell suspension to their initial
concentration (subculture) restarted the exponential cell growth after a 2-d lag. At 5°C (b), cells grew exponentially for 40 d before reaching a plateau. In separate experiments (arrow in Figure 1b), the temperature was set back to 22°C after 20 d of culture at 5°C. This experiment was repeated five times. In semi-logarithmic plot, standard deviation is of the order of the symbol size.
Figure 2 Proton-decoupled 13C-NMR spectra of perchloric acid extracts of sycamore
cells grown at 22°C and 5°C. Cells were harvested 5 d after subculture at 22°C (a) and 20 d
after subculture at 5°C (b). Peak assignments are as follows: ref, reference (maleate) used for quantification; s, sucrose; g, glucose; f, fructose; cit, citrate; mal, malate; suc, succinate; Pro, proline.
Figure 3 Proton-decoupled 31P-NMR spectra of perchloric acid extracts of sycamore
cells grown at 22°C and 5°C. Cells were harvested 5 d after subculture at 22°C (a) and
20 d after subculture at 5°C (b). Peak assignments are as follows: ref, reference (methylphosphonate) used for quantification; glc-6-P, glucose 6-phosphate; fru-6-P,
fructose 6-P; Pi, inorganic phosphate; GPC, glycerophosphocholine; UDP-glc, uridine-5’-diphosphate-
α
-D-glucose.Figure 4 Temperature and phosphate effect on sucrose decrease in the nutrient medium of sycamore cell culture. Time course decrease of sucrose was measured in the nutrient
medium of sycamore cell cultures at 22°C and 5°C, in the presence or absence of inorganic phosphate (Pi). Cells were initially incubated for 5 d in Pi-supplied or Pi-free NM. The cell concentration (FW) at time zero was 20 mg ml-1 culture in Pi-supplied NM and 30 mg ml-1 culture in Pi-free NM. Sucrose was quantified as described in “Material and Methods”. Values are given as means SE (n=3).
Figure 5 Growth of sycamore cells under different culture conditions. Growth of
suspension-cultured sycamore cells was measured in a Pi-free nutrient medium at 22°C followed by cell preservation at 5°C, and recovery in a Pi-supplied medium at 22°C. Cells were cultivated as described in “Material and Methods”. They originated from an
exponentially growing cell suspension repeatedly subcultured in Pi-supplied NM before the growth plateau. At time zero, cells were incubated at 5.0 mg ml-1 in Pi-free Lamport’s NM at 22°C. After a short period of exponential growth, a growth plateau corresponding to a cell concentration of only 20 mg cell FW ml-1 culture was attained due to Pi starvation. At that stage, the temperature was set to 5°C. Six months later preserved cells were incubated under standard culture conditions and subcultured (day 190). This experiment was repeated five times. In semi-logarithmic plot, standard deviation is of the order of the symbol size.
Figure 6 In vivo proton-decoupled 31P-NMR spectra showing the recovery of
sycamore cells preserved over 6 months. Cells were preserved over 6 months at 5°C in a
Pi-free nutrient medium. They were then placed in the perfusion system dedicated to in vivo NMR analyses as described in “Material and Methods”. At time zero, 100 µM Pi was added to NM and the temperature was set to 22°C. Spectra are the result of 1500 transients with a 0.6-s repetition time (15 min). Peak assignments are as follows: ref, reference (methylenediphosphonate) used to measure chemical shifts and for quantification; glc-6-P, glucose 6-phosphate; fru-6-P, fructose 6-P; cyt-Pi, cytoplasmic-Pi; vac-Pi, vacuolar Pi; NTP, nucleoside triphosphate; UDP-glc, uridine-5’-diphosphate-
α
-D-glucose.Table 1. O2-uptake by sycamore and Arabidopsis cells incubated at different temperatures sycamore Arabidopsis Temperature + 2 µM FCCP + 2 µM FCCP + light 22°C 350 ± 25 550 ± 50 480 ± 40 780 ± 70 330 ± 30 5°C 72 ± 6 145 ± 12 105 ± 10 200 ± 15 30 ± 3 5°C→22°C 360 ± 30 560 ± 50 470 ± 40 750 ± 70 290 ± 25
The O2-uptake by Sycamore and Arabidopsis cells harvested 5 d after subculture at 22°C and
20 d after subculture at 5°C was measured in their respective culture media at 22°C or 5°C. In addition, the O2-uptake by cells cultivated for 20 d at 5°C was measured at 22°C after a
10-min recovery (5°C→22°C). O2-uptake rates were measured in the dark, except for
Arabidopsis cells when specified (+ light), as indicated in “Material and Methods”. They are expressed as nmol O2 consumed min-1 g-1 cell FW. Values are means ± SD (n = 5). FCCP,
Table 2. Sucrose-uptake by sycamore cells incubated in Pi-supplied and Pi-deprived NM at 22°C and 5°C
Pi-supplied NM Pi- starved NM
Temperature 22°C 5°C 22°C 5°C
Sucrose uptake (mg d-1 g-1) 51 ± 5 9.7 ± 0.9 17 ± 1.5 3.4 ± 0.3
Cells were initially incubated for 5 d at 22°C in either Pi-supplied or Pi-free Lamport’s NM. At day 5, incubation was pursued at 22°C or 5°C and sucrose-uptake expressed as mg d-1 g-1 cell FW was measured as indicated in “Material and Methods”. Values are means ± SD (n = 5).
Table 3. O2-uptake by sycamore and Arabidopsis cells incubated in Pi-free nutrient
media at different temperatures
sycamore Arabidopsis
Temperature + 2 µM FCCP + 2 µM FCCP
22°C 250 ± 25 510 ± 50 320 ± 30 690 ± 60
5°C 59 ± 6 135 ± 12 70 ± 7 190 ± 15
5°C→22°C 370 ± 30 530 ± 50 470 ± 40 720 ± 60
Sycamore and Arabidopsis cells were initially incubated for 5 d at 22°C in their respective NM devoid of Pi in order to stop cell growth. At day 5, incubation was pursued at 22°C and 5°C in the same nutrient media. O2-uptake by Pi-deficient cells was measured after 5 d
incubation at 22°C and 6 months incubation at 5°C. In addition, the O2-uptake by cells
incubated for 6 months at 5°C was measured at 22°C in standard Pi-supplied media after a 10-min recovery (5°C→22°C). All cells were incubated in the dark. O2-uptake rates
measured as indicated in “Material and Methods” are expressed as nmol O2 consumed min-1
g-1 cell FW. Values are means ± SD (n = 5). FCCP, cyanide p-trifluoromethoxyphenylhydrazone.
Additional material
Additional file 1: Growth of suspension-cultured lightened Arabidopsis cells at 22°C (a) and 5°C (b). Legend as in Figure 1.
Additional file 2: Proton-decoupled 13C-NMR spectra of perchloric acid extracts of
Arabidopsis cells grown in the light at 22°C (a) and 5°C (b). Legend as in Figure 2;
fum, fumarate; Asp, aspartate; Glu, glutamate; Gln, glutamine.
Additional file 3: Proton-decoupled 31P-NMR spectra of perchloric acid extracts of
Arabidopsis cells grown in the light at 22°C (a) and 5°C (b). Legend as in Figure 3;
GPG, glycerophosphoglycerol; spectra are the result of 250 transients.
Additional file 4: Growth of suspension-cultured lightened Arabidopsis cells in a Pi-free nutrient medium at 22°C followed by cell preservation at 5°C, and recovery in a Pi-supplied medium at 22°C. Legend as in Figure 5.
Additional file 5: In vivo proton-decoupled 31P-NMR spectra of Arabidopsis cells. The
recovery of preserved cell was followed in vivo after the return to standard perfusion conditions (Pi-supplied NM, 22°C) as indicated in the legend of Figure 6.
Additional file 6: Step-by-step description of the protocol for preserving plant cells without subculture over several months.
10
100
5
50
C
e
ll
F
W
,
g
l
-1c
u
lt
u
re
b
,
5°C
22°C
a
,
22°C
Figure 1ref
s
s
s s s
s
cit
mal Pro
Pro
cit
g
f
b
,
5°C
a
,
22°C
suc
(x 2)
ref
Figure 2Pi
ref
glc-6-P
a
,
22°C
b
,
5°C
-ATP
-ATP UDP-glc
-ATP
fr
u
-6
-P
-ADP
-ADP
GPC
-ATP
Figure 30
5
10
15
20
S
u
c
ro
s
e
,
g
l
-1c
u
lt
u
re
+Pi, 22°C
+Pi, 5°C
-Pi, 22°C
-Pi, 5°C
Figure 45
10
50
100
C
e
ll
F
W
,
g
l
-1c
u
lt
u
re
-Pi, 22°C
-Pi, 5°C
+Pi, 22°C
ref
glc-6-P
vac-Pi
fru-6-P
-NTP
-NTP
-NTP
cyt-Pi
UDP-glc
0 min
30 min
1 h
2 h
cyt-Pi
cyt-Pi
cyt-Pi
glc-6-P
-NTP
Figure 6Additional files provided with this submission:
Additional file 1: Additional_File_1.pdf, 6K
http://www.plantmethods.com/imedia/8587640046633332/supp1.pdf
Additional file 2: Additional_File_2.pdf, 41K
http://www.plantmethods.com/imedia/1264344258663333/supp2.pdf
Additional file 3: Additional_File_3.pdf, 39K
http://www.plantmethods.com/imedia/5780544866633347/supp3.pdf
Additional file 4: Additional_File_4.pdf, 5K
http://www.plantmethods.com/imedia/3665146366333477/supp4.pdf
Additional file 5: Additional_File_5.pdf, 108K
http://www.plantmethods.com/imedia/1002493952663335/supp5.pdf
Additional file 6: Additional_File_6.pdf, 15K