ORIGINAL ARTICLE
Risk Prediction Scores for Postoperative Mortality
After Esophagectomy: Validation of Different Models
U. Zingg&C. Langton&B. Addison&B. P. L. Wijnhoven&J. Forberger&S. K. Thompson&
A. J. Esterman&D. I. Watson
Received: 26 September 2008 / Accepted: 12 November 2008 / Published online: 3 December 2008
# 2008 The Society for Surgery of the Alimentary Tract Abstract
Background Different prediction models for operative mortality after esophagectomy have been developed. The aim of this study is to independently validate prediction models from Philadelphia, Rotterdam, Munich, and the ASA.
Methods The scores were validated using logistic regression models in two cohorts of patients undergoing esophagectomy for cancer from Switzerland (n=170) and Australia (n=176).
Results All scores except ASA were significantly higher in the Australian cohort. There was no significant difference in 30-day mortality or in-hospital death between groups. The Philadelphia and Rotterdam scores had a significant predictive value for 30-day mortality (p=0.001) and in-hospital death (p=0.003) in the pooled cohort, but only the Philadelphia score had a significant prediction value for 30-day mortality in both cohorts. Neither score showed any predictive value for in-hospital death in Australians but were highly significant in the Swiss cohort. ASA showed only a significant predictive value for 30-day mortality in the Swiss. For in-hospital death, ASA was a significant predictor in the pooled and Swiss cohorts. The Munich score did not have any significant predictive value whatsoever.
Conclusion None of the scores can be applied generally. A better overall predictive score or specific prediction scores for each country should be developed.
Keywords Risk prediction models . Esophagectomy . In-hospital death . 30-day mortality
Introduction
Surgical resection is the cornerstone of curative treatment for esophageal cancer. Despite advances in surgical, anesthetic, and intensive care techniques, hospital mortality is still substantial, with rates reported to be up to 14%.1 Different approaches to decrease the perioperative morbidity and mortality have been used, such as the introduction of minimally invasive surgical techniques, thoracic epidural analgesia, standardized perioperative pathways, and preop-erative selection of patients.2,3As esophageal cancer usually occurs in the elderly population and many of these individuals have significant comorbidities, careful preoperative assess-ment of fitness and subsequent selection of appropriate surgical candidates are important steps which can improve short-term outcomes for individuals undergoing this surgery.
No score generally applicable
U. Zingg (*)
:
C. Langton:
B. Addison:
B. P. L. Wijnhoven:
D. I. WatsonFlinders University Department of Surgery, Flinders Medical Center,
Flinders Drive, Bedford Park,
Adelaide 5042 South Australia, Australia e-mail: [email protected]
U. Zingg
:
J. ForbergerDepartment of Surgery, Triemli Hospital, Zurich, Switzerland
B. P. L. Wijnhoven
Department of Surgery, Erasmus Medical Center, Rotterdam, The Netherlands
S. K. Thompson
Discipline of Surgery, University of Adelaide, Adelaide, South Australia, Australia
A. J. Esterman
School of Nursing and Midwifery, University of South Australia, Adelaide, South Australia, Australia
A number of studies have investigated risk factors for in-hospital mortality following esophagectomy. Age, comor-bidity, and pulmonary status have been identified as independent risk factors.4,5Hospital volume has also been shown to significantly influence mortality rates, with 50% lower rates in high-volume centers.6Several risk prediction models have been developed, but only a minority of them have been validated in independent cohorts.
The Physiological and Operative Severity Score for the Enumeration of Mortality and Morbidity (POSSUM) has been adjusted to accurately predict death from gastric and esophageal surgery (O-POSSUM).7 Three subsequent studies evaluated the O-POSSUM and showed a poor goodness of fit of the model and substantial overprediction of postoperative death using independent patient cohorts worldwide.8–10
Other more simplified and practical prediction models have been proposed. Steyerberg et al.11 from Rotterdam, the Netherlands, developed a simple score which included age, comorbidity, hospital volume, and whether the patient received neoadjuvant treatment. Very similar, but without using neoadjuvant treatment a as variable, is the recently described prediction model of Ra et al.12from Philadelphia. Siewert’s group13
in Munich proposed a score based on pulmonary, hepatic, and cardiac function as well as on general status. The American Society of Anesthesiologists (ASA) score has also been shown to be a reliable predictor of mortality.14 All of these models accurately predicted postoperative hospital death in the initial validation studies. However, to our knowledge, these models have not been validated in independent cohorts of esophageal cancer patients. Hence, the aim of our study was to investigate the prognostic value of these four prediction models (Rotterdam, Philadelphia, Munich, ASA; Table1) in two geographically different cohorts, as well as in a pooled cohort of patients undergoing esophagectomy for cancer.
Patients and Methods
Two cohorts of patients undergoing esophagectomy for cancer from Switzerland and Australia were used to assess the validity of four different prediction models. The Swiss cohort of patients consisted of a consecutive series of 170 patients who underwent esophagectomy at one large teaching hospital in Zurich from 1990 to 2007. The Australian cohort consisted of a consecutive series of 176 patients operated in Adelaide, South Australia between 1999 and 2007 at two university hospitals and two private hospitals. All patients underwent surgery using a transtho-racic approach, and in all patients the stomach was used as conduit for reconstruction. The anastomosis was either
performed with a stapled technique or hand-sewn, accord-ing to the individual surgeon’s preference. In both countries, patients with advanced tumors (T3 or N+) usually received neoadjuvant treatment. This usually entailed two cycles of 5-fluorouracil and cisplatin in combination with 45 to 50 Gy of radiotherapy. Surgery was performed 4 to 8 weeks after the completion of any pretreatment.
For both cohorts, data (demographics, comorbidity, tumor stage, morbidity, mortality) were retrospectively retrieved from the case notes for patients undergoing surgery between 1990 and 1998. From 1999 onwards, data were prospectively retrieved and stored in databases in both sites. Both 30-day mortality and in-hospital mortality outcomes were determined.
For all individual patients, the Rotterdam, Philadelphia, and ASA scores were calculated, and no data were missing. The Munich score includes an aminopyrine breath test to classify hepatic function as either normal, compromised, or severely compromised. As this test was not performed in either the Swiss or the Australian cohort, hepatic status was assessed using routine clinical data such as liver function tests (alanine aminotransferase, ALT, aspartate aminotransferase, AST, gamma-glutamyl trans-ferase, GGT) in preoperative blood samples as well as radiological findings. ALT was considered to be patho-logic if serum levels exceeded 50 iU/l, AST if more than 40 iU/l, and GGT if more than 60 iU/l. Routine imaging with computed tomography was performed for all patients. Evidence of liver cirrhosis or portal hypertension was also noted. Patients were classified as having normal hepatic function when neither blood tests nor imaging showed any evidence of liver disease. If liver function tests were elevated or imaging showed evidence of mild cirrhosis without portal hypertension, hepatic function was consid-ered to be compromised. No patients with severe cirrhosis or portal hypertension underwent esophagectomy in either of these cohorts.
Additionally, the Munich score uses the Karnofsky index to assess the general status of the patient. This index was not initially part of the prospective databases, and hence for this aspect the general physical status was assessed retrospectively using the clinical notes. Theses results were then adapted to the Karnofsky score. Obesity was defined as a body mass index (BMI) above 30 kg/m2.
The study was approved by the responsible clinical research ethics committees in the two countries.
Statistical Analysis
Comparison of demographic and clinical data between the two patient cohorts (Swiss and Australia) was undertaken using Chi-squared tests for categorical data and Student’s t
tests or Mann–Whitney U tests for continuous data. Since all four prediction scores were skewed, correlation between them was assessed by Spearman rank correlation. Logistic regression was used to calculate whether each score could predict 30-day mortality, in-hospital mortality, or prolonged ventilation. The latter was used as a marker of severe morbidity. Prolonged ventilation was defined as ventilation required for more than 72 h.
Models were developed for each of the three-outcome and four-risk-score combinations, i.e., 12 models in total. For each combination, the initial model included the score, country, and score–country interaction term. If the latter was statistically significant, separate models were developed for each country collection with no attempt to pool the data across the two countries. The Hosmer and Lemeshow test was performed to evaluate
Table 1 The Four Validated Prediction Scores
Variable Definition of variable Points
Rotterdam score11 Age (years) 50 −1 65 0 80 1 Comorbidity Pulmonary 1 Cardiovascular 1 Diabetes 1 Hepatic 1 Renal 1
Neoadjuvant therapy Radiotherapy 1.5
Chemoradiotherapy 1
Hospital volume Low (≤1) 0
Intermediate (1.1-2.5) −0.5 High (≥2.6) −1.5 Very high (≥50) −2 Philadelphia score12 Age 65−69 0 70−79 1 80+ 2
Hospital volume High 0
Medium 2 Low 2 Charlson score 0 0 1 0 ≥2 2 Munich score13
Pulmonary function (weighting factor 2) Normal (vital capacity >90% and PaO2 >70 mmHg) 1 Compromised (vital capacity <90% or PaO2<70 mmHg) 2
Severely compromised (vital capacity <90% and PaO2<70 mmHg) 3
Hepatic function (weighting factor 2) Normal (aminopyrine breath test >0.4) 1
Compromised (aminopyrine breath test <0.4, no cirrhosis) 2
Severely compromised (cirrhosis) 3
Cardiac function based on cardiologists impression (weighting factor 3)
Normal (normal risk for major surgery) 1
Compromised (increased risk for major surgery) 2
Severely compromised (high risk for major surgery) 3 General status (weighting factor 4) Normal (Karnofsky index >80% and good cooperation) 1 Compromised (Karnofsky index≤80% or poor cooperation) 2 Severely impaired (Karnofsky index≤80% and poor cooperation) 3 American Society of Anesthesiologists (ASA) score14
Normal healthy patient 1
Patient with mild systemic disease 2
Patient with severe systemic disease 3
Patient with severe systemic disease that is a constant threat to life 4 Moribund patient who is not expected to survive without the operation 5 Declared brain-dead patient whose organs are removed for donor purposes 6
the goodness of fit of each logistic regression model. Nagelkerke’s R-squared test was used to determine the percentage of variability in outcome explained by the model.
Statistical significance for each model was set at p < 0.05. Statistical analyses were performed with SPSS® version 16 for Windows. For all outcomes, a logistic regression of a binary response variable (Y) on a continuous normally distributed variable (X) with a sample size of 289 observations for in-hospital death, 425 observations for 30-day mortality, and 154 observations for prolonged ventilation achieved 80% power at a 0.05 significance level. This detected a change in probability (Y= 1) from the value of 0.060 (6% mortality) at the mean of X to 0.113 when X is increased to one standard deviation above the mean. This change corresponds to an odds ratio of 2.000.
Results
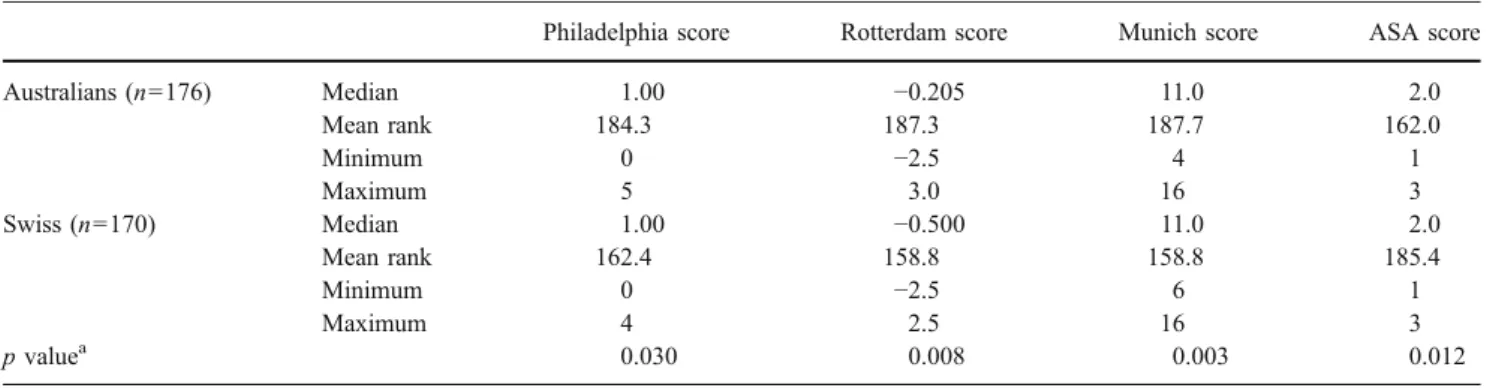
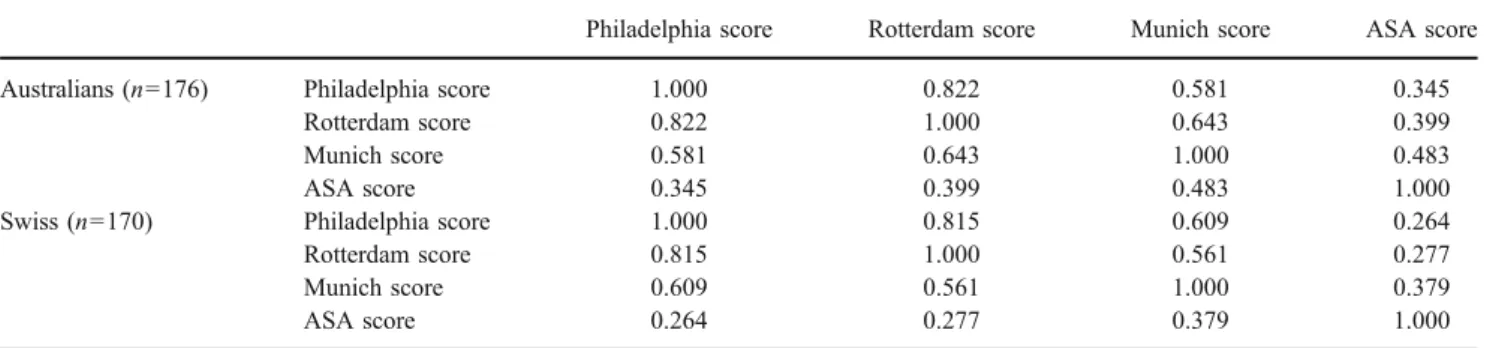
The pooled cohort included 346 patients. The two cohorts from Switzerland (n=170) and Australia (n=176) did not differ in age or the percentage of obese patients. There were, however, significant differences in some other patient or tumor characteristics, as shown in Table 2. All scores were significantly different between the cohorts, with the Australian cohort having higher scores except for ASA (Table 3). There were no significant differences in 30-day mortality, in-hospital death, or the frequency of prolonged ventilation between groups (Table 4). There was a good correlation between the Philadelphia and Rotterdam scores, whereas no correlation to or in between the other scores was detected (Table5).
Pooling was allowed in all scores and outcomes (Table6). The Philadelphia and Rotterdam scores had a significant predictive value for 30-day mortality and in-hospital death in the pooled cohort. After stratifying into the two countries, only the Philadelphia score had a significant prediction value for 30-day mortality in both cohorts. The Rotterdam score had no significant predictive value for 30-day mortality in Australians and neither score showed any predictive value for in-hospital death in Australians. Both scores were highly significant in the Swiss cohort.
The Munich score did not have any significant predictive value for operative mortality in the pooled data or in any of the cohorts. ASA showed only a significant predictive value for 30-day mortality in the Swiss but not in the pooled or Australian cohorts. For in-hospital death, ASA was a significant predictor in the pooled and Swiss cohorts. Concerning prediction of prolonged ventilation as an indicator for severe morbidity, the Munich score had a significant predictive value in the Australians but neither in the pooled or Swiss cohorts. ASA predicted prolonged hospitalization only in the pooled cohort but not in the country subgroups.
Table 2 Basic Descriptives Between the Swiss and Australian Cohorts
Australians Swiss p value
N=176 N=170 Age (SEM) 62.2 (0.7) 62.5 (0.8) 0.814a Sex Male 137 (77.8%) 147 (86.5%) 0.036b Female 39 (22.2%) 23 (13.5%) Comorbidity Yes 110 (62.5%) 76 (44.7%) 0.001b No 65 (37.5%) 94 (55.3%) Obesity Yes 30 (17.0%) 20 (11.8%) 0.163b No 146 (83.0%) 150 (88.2%) Neoadjuvant treatment Yes 96 (54.5%) 44 (25.9%) <0.001b No 80 (45.5%) 126 (74.1%) Type Adeno 134 (76.1%) 125 (73.5%) 0.010b SCC 29 (16.5%) 42 (24.7%) Other 13 (7.4%) 3 (1.8%) SEM standard error of mean
a
Students t test
b
Chi-squared test
Table 3 Results of the Four Scores in the Two Different Cohorts
Philadelphia score Rotterdam score Munich score ASA score
Australians (n=176) Median 1.00 −0.205 11.0 2.0 Mean rank 184.3 187.3 187.7 162.0 Minimum 0 −2.5 4 1 Maximum 5 3.0 16 3 Swiss (n=170) Median 1.00 −0.500 11.0 2.0 Mean rank 162.4 158.8 158.8 185.4 Minimum 0 −2.5 6 1 Maximum 4 2.5 16 3 p valuea 0.030 0.008 0.003 0.012
ASA American Society of Anesthesiologists
a
Discussion
Analysis of the pooled data in this study demonstrated that two of the risk prediction scores, Philadelphia and Rotterdam, correlated with operative mortality following esophagectomy in this group of esophageal cancer patients. The predictive value was highly significant for the Swiss population, whereas the scores were only marginally or not significant in the Australian cohort. The ASA score only predicted operative mortality for the Swiss cohort but not for the Australian cohort. The Munich score had no significant predictive value in either patient cohort.
The Rotterdam score and the Munich score were developed using logistic regression analysis in a primary cohort and then validation in other cohorts. Both scores showed good agreement between the predicted risks and the observed risks.11,13The Philadelphia and ASA scores were developed again with logistic regression, but these scores were not validated with other cohorts. Both models accurately predicted postoperative mortality in initial reports.12,14 The time period over which the patients were collected was long for three of the scores (22 years in the Rotterdam score, 14 years in the Munich score, and 15 years in the ASA score), whereas the data for the validation of the Philadelphia score were collected over a 6-year period.
There were some significant differences between the two cohorts of patients we analyzed in our study and this might explain some of our findings. The Australian cohort had higher Philadelphia, Rotterdam, and Munich scores but a lower ASA score. The Rotterdam score includes comor-bidity and neoadjuvant treatment, both of which were more prevalent in the Australian cohort, thus explaining the higher scores. The higher Munich score can be again explained by the more frequent comorbidity seen in the Australian cohort. The significant difference in ASA scores is related to the number of patients with ASA score of 1 (Australia 38 vs. Switzerland 11). The reason for this difference is unclear. A possible explanation is that the ASA score is defined by the individual anesthetist, and this might be influenced by differences in clinical assessment.
The Munich score in this study was not done with an aminopyrine breath test. However, we did assess the hepatic function by other means, and it was not difficult to classify patients as having either a normal or compromised liver function. Furthermore, no patients with significant liver disease underwent surgery in either country. It is therefore likely that all patients were adequately assessed for this criterion.
Concerning prolonged ventilation as a marker of severe morbidity, the ASA score was a significant predictor in the pooled cohort, and the Munich score was also predictive in the Australian cohort. However, cautious interpretation of these results is necessary as all scores were primarily developed to predict hospital mortality. The prediction of morbidity with the ASA score as demonstrated by Sauvanet et al.14is only reproduced in our pooled cohort not in the subcohorts. This might indicate that a large number of patients are necessary to reach statistical significance, and for this reason the true prediction value was not established in the individual cohorts. Sauvanet et al. evaluated the ASA score in a group of over 1,000 patients. There were sufficient patients in our pooled cohort of patients to ensure sufficient statistical power of the study for valid assessment of all other risk assessment tools.
Table 5 Spearman Rank Correlation Between Scores Stratified According to Country
Philadelphia score Rotterdam score Munich score ASA score
Australians (n=176) Philadelphia score 1.000 0.822 0.581 0.345
Rotterdam score 0.822 1.000 0.643 0.399
Munich score 0.581 0.643 1.000 0.483
ASA score 0.345 0.399 0.483 1.000
Swiss (n=170) Philadelphia score 1.000 0.815 0.609 0.264
Rotterdam score 0.815 1.000 0.561 0.277
Munich score 0.609 0.561 1.000 0.379
ASA score 0.264 0.277 0.379 1.000
ASA American Society of Anesthesiologists
Table 4 30-day Mortality, In-Hospital Death, and Incidence of Prolonged Ventilation in the Two Cohorts
Australians (n=176) Swiss (n=170) p valuea 30-day mortality Yes 8 (4.5%) 7 (4.1%) 1.000
No 168 (95.5%) 163 (95.9%) In-hospital mortality Yes 14 (8.0%) 8 (4.7%) 0.272 No 162 (92.0%) 162 (95.3%) Prolonged ventilation Yes 20 (11.4%) 26 (15.3%) 0.344 No 156 (88.6%) 144 (84.7%) a Chi-squared test
The female-to-male ratio was different in our two cohorts. To our knowledge, only one study has identified sex as an independent predictor of death, with women having an odds ratio of 1.5 for inpatient death.15 The majority of studies have not shown any influence of sex on hospital mortality.1,4,12,16–18 However, a difference in outcome between histological subtypes has been sug-gested. The percentage of adenocarcinomas was very similar in both of our groups. One previous study has shown a higher operative mortality for patients with
squamous cell cancer, but this has not been supported by other studies.18,19 Many studies, however, do report long-term survival differences for different histological subtypes.18–22
Operative mortality and the frequency of prolonged ventilation were similar in both cohorts and comparable to other published series.17,18,23,24A trend towards higher in-hospital mortality in the Australian cohort was seen, whereas 30-day mortality rates were similar. In-hospital mortality may better reflect general comorbidities, as
Table 6 Results of the Logistic Regression Analyses
Australians (n=176) Swiss (n=170) Pooled (n=346) 30-day mortality
Philadelphia score p value 0.045 0.012 0.001
Hosmer and Lemeshow test 0.825 0.248 0.735
Nagelkerke R-squared 0.068 0.125 0.092
Rotterdam score p value 0.269 0.003 0.003
Hosmer and Lemeshow test 0.608 0.465 0.266
Nagelkerke R-squared 0.022 0.207 0.085
Munich score p value 0.959 0.188 0.431
Hosmer and Lemeshow test 0.345 0.989 0.634
Nagelkerke R-squared <0.001 0.033 0.006
ASA score p value 0.661 0.019 0.065
Hosmer and Lemeshow test 0.601 0.867 0.747
Nagelkerke R-squared 0.004 0.135 0.034
In-hospital death
Philadelphia score p value 0.068 0.004 0.001
Hosmer and Lemeshow test 0.924 0.232 0.784
Nagelkerke R-squared 0.042 0.158 0.082
Rotterdam score p value 0.088 0.002 <0.001
Hosmer and Lemeshow test 0.681 0.688 0.064
Nagelkerke R-squared 0.039 0.224 0.098
Munich score p value 0.611 0.090 0.490
Hosmer and Lemeshow test 0.415 0.958 0.035
Nagelkerke R-squared 0.003 0.050 0.004
ASA score p value 0.271 0.008 0.021
Hosmer and Lemeshow test 0.869 0.880 0.270
Nagelkerke R-squared 0.016 0.163 0.043
Prolonged ventilation
Philadelphia score p value 0.500 0.070 0.095
Hosmer and Lemeshow test 0.304 0.771 0.286
Nagelkerke R-squared 0.005 0.032 0.014
Rotterdam score p value 0.535 0.067 0.105
Hosmer and Lemeshow test 0.965 0.016 0.174
Nagelkerke R-squared 0.004 0.034 0.014
Munich score p value 0.029 0.476 0.060
Hosmer and Lemeshow test 0.083 <0.001 <0.001
Nagelkerke R-squared 0.055 0.005 0.019
ASA score p value 0.060 0.060 0.006
Hosmer and Lemeshow test 0.530 0.323 0.024
Nagelkerke R-squared 0.042 0.037 0.041
p value, goodness-of-fit measure, and percentage of variability in outcome explained by the model for 30-day mortality, in-hospital death, and prolonged ventilation in the two collections and in the pooled data (where pooling was allowed after testing for country interaction). The first column shows the score used for prediction. The p value refers to the statistical significance of the regression coefficient. A Hosmer and Lemeshow statistic of p>0.05 demonstrates a good fit
patients with surgical complications may die earlier, whereas pulmonary, cardiac, and renal impairment may lead to a prolonged postoperative course with slow deterioration and ultimately death after more than 30 days of hospitalization.
There was a good correlation between the Philadelphia and Rotterdam risk scores with a correlation coefficient of over 0.8. This is not surprising as these models used similar variables. Interestingly, the Philadelphia score does not include neoadjuvant treatment, yet this variable was not even evaluated in the primary regression analysis. Whether neoadjuvant treatment has an influence on perioperative mortality and morbidity is unclear. A number of studies did not detect higher operative mortality.25–27A meta-analysis of randomized controlled trials showed a trend toward higher operative mortality in pretreated patients (odds ratio of 1.72; 0.96, 3.07 95% confidence interval, p=0.07).28 The Rotterdam study demonstrated a significant influence for neoadjuvant treatment, chemotherapy alone, or radio-chemotherapy. The Munich score includes only comorbid-ity and performance status of the patient. As this score was developed 1998, before the era of wide application of neoadjuvant treatment, it may be outdated by now. This is reflected by the poor predictive value in all cohorts, including the pooled data. ASA score, the simplest and oldest of the four validated scores, had no correlation to the other scores at all.
The most surprising finding of this validation study is that the two most recently developed scores, Philadelphia and Rotterdam, had different predictive values for operative mortality in the two country cohorts. Both scores were excellent outcome predictors for the Swiss cohort but not for the Australian cohort. This suggests that these scores cannot be reliably applied to all centers undertaking esophageal cancer surgery.
The difference in predictive value might be explained by differences in perioperative management, differences in the medical systems, and the fact that all Swiss patients were operated in a single institution whereas the Australian patients were operated in two university hospitals and two private hospitals, albeit by members of the same surgical group. The basic surgical approaches and postoperative management guidelines in these two cohorts were similar. In contrast to the Australian medical system, where a number of consultant surgeons work in different public and private institutions, the Swiss system has full-time consul-tant surgeons in one institution only. This might result in more tightly supervised postoperative management. Hospi-tal and surgeon volume has been shown to influence outcome.15,29–31 In our study, all hospitals met previous definitions of high-volume centers.
The patients in the Swiss cohort were collected over a time period of 17 years compared to 8 years in the Australian
cohort. This might have influenced the results. However, the number of surgeons performing esophagectomies in the Swiss cohort was stable during that period and all procedures were supervised by the same head of department.
The Munich score had no significant predictive value and poor goodness of fit for operative mortality in both cohorts as well as in the pooled data. The main difference between the Philadelphia and Rotterdam scores and the one from Munich is the variety of variables used. The Munich score concentrates on comorbidity and general performance status whereas the two other scores include variables such as age, neoadjuvant treatment, and hospital volume. The range of variables having an impact on hospital mortality discussed in the literature is very wide and to some extent controversial. Age, sex, race, hospital volume, neoadjuvant treatment, comorbidity, cancer stage, smoking, pulmonary function (FEV 1, FVC), blood loss, and localization of the tumor have all been shown to significantly influence hospital death.1,4,11–15,17,18This diversity of possible factors might render it difficult to develop a uniformly applicable score.
The development of risk prediction models in esopha-geal surgery is important for two reasons: it allows improvement of outcome by appropriate selection of patients for surgery and it enables auditing results in comparison to other institutions, countries, and published series. The ideal prediction score should be simple to apply, and it should reproducible across different institutions and patient cohorts. This generalization has not yet been achieved with these four scores
Conclusion
The results of this study show that none of the scores can be applied generally to all institutions undertaking esophagec-tomy and that a better overall predictive score or specific prediction scores for each country might need to be developed.
Acknowledgements The authors thank Carolyn Lally, Lorelle Smith, and Janet Pinno, Discipline of Surgery, Royal Adelaide Hospital, and Tanya Ellis, Department of Surgery, Flinders Medical Center, for help in gathering the data and support with the database.
References
1. McCulloch P, Ward J, Tekkis PP for the ASCOT group of surgeons. Mortality and morbidity in gastro-oesophageal cancer surgery: initial results of ASCOT multicentre prospective cohort study. BJM 2003;327:1192–7. doi:10.1136/bmj.327.7425.1192. 2. Low DE, Kunz S, Schembre D, Otero H, Malpass T, His A et al.
standardized perioperative clinical pathways improve outcomes in patients with esophageal cancer. J Gastrointest Surg 2007;11:1395–402. doi:10.1007/s11605-007-0265-1.
3. Luketich JD, Alvelo-Rivera M, Buenaventura PO, Christie NA, McCaughan JS, Litle VR et al. Minimally invasive esophagec-tomy. Outcomes in 222 patients. Ann Surg 2003;238:486–95. 4. Liu JF, Watson DI, Devitt PG, Mathew G, Myburgh J, Jamieson
GG. Risk factor analysis of postoperative mortality in oesopha-gectomy. Dis Esophagus 2000;13:130–135. doi: 10.1046/j.1442-2050.2000.00099.x.
5. Schroeder W, Bollschweiler E, Kossow C, Hoelscher AH. Preoperative risk analysis—a reliable predictor of postoperative outcome after transthoracic esophagectomy. Langenbecks Arch Surg 2006;391:455–460. doi:10.1007/s00423-006-0067-z. 6. Dimick JB, Wainess RM, Upchurch GR Jr, Iannettoni MD,
Orringer MB. National trends in outcomes for esophageal resection. Ann Thorac Surg 2005;79:212–216. doi:10.1016/j. athoracsur.2004.06.044.
7. Tekkis PP, McCulloch P, Poloniecki JD, Prytherch DR, Kessaris N, Steger AC. Risk-adjusted prediction of operative mortality in oesophagogastric surgery with O-POSSUM. Br J Surg 2004;91:288–295. doi:10.1002/bjs.4414.
8. Lai F, Kwan TL, Yuen WC, Wai A, Siu YC, Shung E. Evaluation of various POSSUM models for predicting mortality in patients undergoing elective oesophagectomy for carcinoma. Br J Surg 2007;94:1171–1178. doi:10.1002/bjs.5793.
9. Lagarde SM, Maris AK, de Castro SM, Busch OR, Obertop H, van Lanschot JJ. Evaluation of O-POSSUM in predicting in-hospital mortality after resection for oesophageal cancer. Br J Surg 2007;94:1521–1526. doi:10.1002/bjs.5850.
10. Nagabhushan JS, Srinath S, Weir F, Angerson WJ, Sugden BA, Morran CG. Comparison of P-POSSUM and O-POSSUM in predicting mortality after oesophagogastric resections. Postgrad Med J 2007;83:355–358. doi:10.1136/pgmj.2006.053223. 11. Steyerberg EW, Neville BA, Koppert LB, Lemmens VE, Tilanus
HW, Coeberg JW et al. Surgical mortality in patients with esophageal cancer: development and validation of a simple risk score. J Clin Oncol 2006;24:4277–4284. doi:10.1200/JCO.2005.05.0658. 12. Ra J, Paulson EC, Kucharczuk J, Armstrong K, Wirtalla C,
Rapaport-Kelz R et al. Postoperative mortality after esophagec-tomy for cancer: development of a preoperative risk prediction model. Ann Surg Oncol 2008;15:1577–1584. doi:10.1245/ s10434-008-9867-4.
13. Bartels H, Stein HJ, Siewert JR. Preoperative risk analysis and postoperative mortality of oesophagectomy for resectable oeso-phageal cancer. Br J Surg 1998;85:840–844. doi: 10.1046/j.1365-2168.1998.00663.x.
14. Sauvanet A, Mariette C, Thomas P, Lozac’h P, Segol P, Tiret E et al. Mortality and morbidity after resection for adenocarcinoma of the gastrointestinal junction: predictive factors. J Am Coll Surg 2005;201:253–262. doi:10.1016/j.jamcollsurg.2005.02.002. 15. Rodgers M, Jobe BA, O’Rourke RW, Sheppard B, Diggs B,
Hunter JG. Case volume as a predictor of inpatient mortality after esophagectomy. Arch Surg 2007;142:829–837. doi:10.1001/ archsurg.142.9.829.
16. Karl RC, Schreiber R, Boulware D, Baker S, Coppola D. Factors affecting morbidity, mortality and survival in patients undergoing Ivor Lewis esophagogastrectomy. Ann Surg 2000;231:635–643. doi:10.1097/00000658-200005000-00003.
17. Law S, Wong KH, Kwok KF, Chu KM, Wong J. Predictive factors for postoperative pulmonary complications and mortality after
esophagectomy for cancer. Ann Surg 2004;240:791–800. doi:10.1097/01.sla.0000143123.24556.1c.
18. Abunasra H, Lewis S, Beggs L, Duffy J, Beggs D, Morgan E. Predictors of operative death after oesophagectomy for carcinoma. Br J Surg 2005;92:1029–1033. doi:10.1002/bjs.5049.
19. Alexiou C, Khan OA, Black E, Field ML, Onyeaka P, Beggs L et al. Survival after esophageal resection for carcinoma: the importance of the histologic cell type. Ann Thorac Surg 2006;82:1073–1077. doi:10.1016/j.athoracsur.2006.03.012. 20. Siewert RJ, Stein HJ, Feith M, Bruecher BLDM, Bartels H, Fink
U. Histologic tumor type is an independent prognostic parameter in esophageal cancer: lessons from more than 1000 consecutive resections at a single center in the western world. Ann Surg 2001;234:360–369. doi:10.1097/00000658-200109000-00010. 21. Orringer MB, Marshall B, Iannettoni MD. Transhiatal
esophagec-tomy: clinical experience and refinements. Ann Surg 1999;230:392–403. doi:10.1097/00000658-199909000-00012. 22. Khan OA, Alexiou C, Soomro I, Duffy JP, Morgan WE, Beggs
FD. Pathological determinants of survival in node-negative oesophageal cancer. Br J Surg 2004;91:1586–1591. doi:10.1002/ bjs.4778.
23. Hulscher JB, van Sandick JW, de Boer AG, Wijnhoven BP, Tijssen JG, Fockens P et al. Extended transthoracic resection compared with limited transhiatal resection for adenocarcinoma of the esophagus. N Engl J Med 2002;347:1662–1669. doi:10.1056/ NEJMoa022343.
24. Wijnhoven BP, Tran KT, Esterman A, Watson DI, Tilanus HW. An evaluation of prognostic factors and tumor staging of resected carcinoma of the esophagus. Ann Surg 2007;245:717–725. doi:10.1097/01.sla.0000251703.35919.02.
25. Urba SG, Orringer MB, Turrisi A, Iannettoni M, Forastiere A, Strawderman M. Randomized trial of preoperative chemoradiation versus surgery alone in patients with locoregional esophageal carcinoma. J Clin Oncol 2001;19:305–13.
26. Mariette C, Piessen G, Lamblin A, Mirabel X, Adenis A, Triboulet JP. Impact of preoperative radiochemotherapy on postoperative course and survival in patients with locally advanced squamous cell oesophageal carcinoma. Br J Surg 2006;93:1077–1083. doi:10.1002/bjs.5358.
27. Rice DC, Correa AM, Vaporciyan AA, Sodhi N, Smythe WR, Swisher SG et al. Preoperative chemoradiotherapy prior to esophagectomy in elderly patients is not associated with increased morbidity. Ann Thorac Surg 2005;79:391–397. doi:10.1016/j. athoracsur.2004.08.045.
28. Urschel JD, Vasan H. A meta-analysis of randomized controlled trials that compared neoadjuvant chemoradiation and surgery to surgery alone for resectable esophageal cancer. Am J Surg 2003;185:538–543. doi:10.1016/S0002-9610(03)00066-7. 29. Kuo EY, Chang Y, Wright CD. Impact of hospital volume on
clinical and economic outcomes for esophagectomy. Ann Thorac Surg 2001;72:1118–1124. doi:10.1016/S0003-4975(01)02962-9. 30. Swisher SG, Deford L, Merriman KW, Walsh GL, Smythe R,
Vaporicyan A et al. Effect of operative volume on morbidity, mortality and hospital use after esophagectomy for cancer. J Thorac Cardiovasc Surg 2000;119:1126–1132. doi:10.1067/ mtc.2000.105644.
31. Santin B, Kulwicki A, Price P. Mortality rate associated with 56 consecutive esophagectomies performed at a low-volume hospital: is procedure volume as important as we are trying to make it. J Gastrointest Surg 2008;12:1346–1350. doi: 10.1007/s11605-008-0550-7.