Bulletin of Entomological Research (1991) 81, 201-208
Sampling Mononychellus tanajoa (Acari:
Tetranychidae) on cassava in Africa
J.S. Yaninek
IITA Biological Control Program, Cotonou, Republic of Benin
J. Baumgaertner
Division of Phytomedicine ETH/Z, Zurich, Switzerland
A.P. Gutierrez
Division of Biological Control, University of California, Berkeley,
California 94720, USA
Abstract
Density-specific sampling plans were developed under African conditions for the exotic spider mite, Mononychellus tanajoa (Bondar), a serious pest of cassava, Manihot esculenta. The within-plant distribution of Mononychellus
tanajoa was found to favour new foliage, regardless of time of planting or
plant age. Consequently, the first developed leaf near the top of the foliage was selected as the sampling unit and related to whole plant populations of
M. tanajoa. The relationship between the mite population's variance and mean
as measured by Taylor's Power Law proved to be stable over a range of plant-ing dates, seasons and locations. Two binomial samplplant-ing plans, one based on Taylor's dispersion parameters and another based on direct field observations, were developed and compared. Binomial sampling, appropriate only for den-sities below 30 mites per leaf, was replaced by an enumerative procedure based on a 'quick count' protocol at higher mite densities.
Introduction
Procedures for quickly and accurately estimating mite densities are needed to facilitate studies on the pop-ulation dynamics and pest status of the cassava green mite, Mononychellus tanajoa (Bondar), in Africa (Yaninek
et al., 1989c). This pest was accidentally introduced from
the Neotropical Region in the early 1970s (Nyiira, 1972), and has since become a serious pest of cassava, Manihot
esculenta, causing estimated yield losses of 13-80%
annu-ally (Yaninek & Herren, 1988; Yaninek et al, 1990). The use of sampling plans for monitoring population trends and assessing damage is well developed for tetra-nychid mites in temperate agricultural systems (Jones & Parrella, 1984; Margolies et al. 1984; Wilson et al., 1983; Zahner & Baumgaertner, 1984; Zalom et al., 1984). Similar procedures remain largely undeveloped for trop-ical agricultural systems, especially in Africa.
Braun et al. (1989b) recently examined the
within-Correspondence: Dr J.S. Yaninek, IITA Benin, c/o, L. W. Lam-bourn & Co Ltd, 26 Dingwall Road, Croydon, CR9 3EE, UK
plant distribution of Mononychellus tanajoa as affected by cassava clones and predation in Colombia, and proposed a binomial sampling plan based on their findings. The ecological and agronomic conditions present during this study differ considerably from those normally associated with cassava in Africa. Braun et al. (1989b) planted just prior to the dry season and sampled seven times during the first nine months of cassava growth and develop-ment. Likewise in the Neotropical Region, a complex of phytophages often occur together on the same plant (Bel-lotti & van Schoonhoven, 1978) along with locally-adapted natural enemies (Bellotti et al., 1985b) which may confound the effect of individual species in the system.
African farmers plant most of their cassava at the be-ginning of the wet season, rely on rainfed irrigation, and may leave their crop in the ground for up to two years before harvest (Silvestre & Arraudeau 1983). Since the successful biological control of the exotic cassava mealy-bug, Phenacoccus manihoti Matile-Ferrero (Hemiptera: Pseudococcidae), in most areas where it occurs (Neu-enschwander & Herren, 1988), and except for sporadic
202 J.S Yaninek, J. Baumgaertner and A.P Gutierrez
outbreaks of the grasshopper Zonocerus variegatus Lin-naeus (Orthoptera: Acrididae), M. tanajoa is often the only significant phytophage found on cassava in Africa. This mite occurs without the co-evolved natural enemies providing good biological control in its area of origin (Braun et al., 1989a; Yaninek et al., 1987). In addition, cassava in Africa has not traditionally been selected because of its response to this pest, whereas most tradi-tional cultivars found in the pests' area of origin confer some degree of host plant resistance (Bellotti et al., 1985a).
In this paper, procedures for sampling M. tanajoa are developed given a range of ecological conditions normal-ly associated with cassava growth in Africa.
Materials and methods
Ten naturally infested cassava fields planted in 1983 and 1984 at two locations in Nigeria were regularly sampled for M. tanajoa densities. In 1983, experimental fields were planted during May, June and November at the International Institute of Tropical Agriculture (IITA) near Ibadan, and during May, August and November at the Texagri Farm near Abeokuta located 150 km south-west of Ibadan. In 1984, experimental fields were planted during April, May, July and October at IITA.
Agronomic practices typical of the region were fol-lowed. Cassava cuttings were planted during the wet season on ridges at a density of 1 per m2. Although the size of these fields ranged from 40 to 20,000 m2, most were in excess of 1000 m2. The IITA variety TMS 30572 was planted in all fields. All plots were weeded at least once during the first three months of plant growth and were irrigated by rainfall.
Selecting a sampling unit
Counting mite samples is time and labour intensive, hence whole plant samples which are feasible for young cassava become impractical as the plant increases in size.
M. tanajoa in Africa occurs exclusively on the foliage
(Yaninek et al., 1989c), hence an appropriate leaf unit for sampling these populations was sought.
The foliage on a typical cassava plant may be divided into 1) terminal shoots, 2) developing leaves which emerge at the growing tips of each branch, i.e., newly de-veloped leaves just below the terminal shoots, and 3) mature leaves, i.e., older leaves found at or near the bottom of the canopy. M. tanajoa individuals spend most of their lives confined to the same leaf; usually in the upper strata of the canopy (Nyiira, 1972). Nymphs and adult females often migrate if the host plant deteriorates, but the number of mites that move within a plant is small (Yaninek, 1988).
The first developed leaf (FDD found near the top of the plant was chosen as the index sampling unit because it is easily distinguished from the surrounding immature foliage by its mature green colour and by its petiole which intersects the main stem at an angle of less than 90° (Yaninek, 1985).
Mites eggs and active stages (nymphs and adults) may be found on all leaves within a plant, hence all mites found on alternate leaves along a single branching path (any unique series of inter-connected branches between the main stem at the bottom of the plant and a
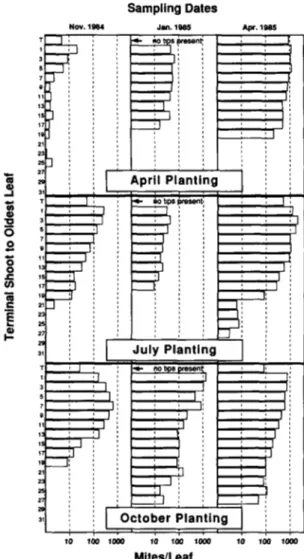
terminal shoot at the top of the same plant) were counted from top to bottom on five plants to assess their within-plant distribution. These results were used to evaluate the suitability of the FDL as a sampling unit, and for de-veloping relationships for estimating whole plant mite populations. This was carried out for cassava planted during April, July and October 1984 at IITA at the begin-ning (November, 1984), middle (January, 1985) and end (April, 1985) of the dry season. An average density was computed for each leaf position along the branching path (i.e., level) on every sampling date in each planting treat-ment.
Between stages (eggs and active life stages) and between levels comparisons were made for each location and planting time in a fully crossed factorial analysis of variance nested within sampling date for each planting time. All means (x) used in this analysis were trans-formed using log (x + 1).
Sampling first developed leaves (FDL)
M. tanajoa densities on the FDL were estimated using
two methods. In the first method, counts of all life stages found on the FDL of three branches from each of 25 plants were made in the laboratory. Samples were taken biweekly in three fields in Abeokuta during 1984. The field planted in April at IITA was similarly sampled during the wet season (April to November, 1984; May and June, 1985), but sampled weekly during the dry season (December to April, 1984-85). The collected leaves were placed in a coolbox and transported to the laboratory where the mites were counted as either eggs or active stages (larvae, nymphs and adults). All counts were pooled per plant and averaged on a per leaf basis. These data were used to develop both binomial and enu-merative sampling plans for active stages.
In the second method, mite numbers from the 10 IITA plots described above were estimated in the field using the 'quick count' procedure described by Yaninek (1985). This method was developed because of the need to obtain a mean mite density in the field using a direct and rapid method. It proved easy to categorize the M.
tanajoa active stages observed per leaf in one of the
fol-lowing four density classes: (1) 0, (2) 0 < 25, (3) 25 < 200, or (4) > 200. The mean number of mites per leaf was then calculated according to equation 1 with direct applicabil-ity in the field:
mites per leaf = (ION, + 11 ON, + 350NJ/N* (1) where N, for i = 1, 2, 3 are the number of leaves infested in each of three mite density classes, the coefficients 10 and 110 are the median values expected in two density classes rounded to the nearest ten, and 350 is the empiri-cal mean of 300 field samples with > 200 mites per leaf, N* is the sum of the leaves sampled, and the ratio (N*-No)/N,* where No is the number of leaves
uninfest-ed, is the proportion of leaves infested. This procedure compares favourably with actual counts obtained as de-scribed above (Yaninek, 1985). These estimates were made biweekly on twenty to thirty plants per plot during the 1984 and 1985 wet seasons and weekly during the 1984-85 dry season.
203
Analysis of dispersion
Dispersion of M. tanajoa was evaluated by analysing the variance to mean relationship of the field density counts. Taylor (1961) showed that this relationship for a wide range of species may be described by the function:
s2 = axb (2)
where s: = sample variance, x = sample mean, and a, b are fitted coefficients. According to Taylor (1961), the parameter b is a measure of dispersion of the sample mean, whereby b > 1, b = 1 and b < 1 indicate aggregat-ed, random and regular distributions, respectively. The parameters a and b were estimated by regressing log s2
against the log x (Southwood, 1978).
Developing a sampling plan
Wilson & Room (1982) incorporated Taylor's Power Law into Karandinos' (1976) model for estimating the number of samples (n) needed to achieve a specified level of reliability (Do) as follows:
n = (t/D0)2axb2 (3)
where t is the standard normal deviate (1.96 for n > 30) and Do is defined as a fixed proportion of the mean (x) to
one half the confidence interval at 95% probability. The other parameters are as defined in equation 2.
Spider mites such as M. tanajoa are often too numer-ous or too difficult to count efficiently when large numbers of samples are involved. Simplified procedures such as binomial sampling save considerable time and effort. Wilson & Room (1983) proposed a presence-absence sampling procedure that predicts average densi-ties (x) from the proportion of sampling units (p) infested based on a negative binomial model modified to include Taylor's a and b parameters:
p = l_e-x(In(axb-i-l)) (4)
where the parameters are as defined in equation 2. This approach indirectly establishes the relationship between the proportion of sampling units infested and the mite population density via the dispersion parameters.
Another presence-absence procedure was proposed by Nachman (1984):
p = 1-e" (5)
In this model the population parameters a and P are esti-mated by linearizing equation 5 with a natural log trans-formation. The sample constants a' and b' are then derived from the proportion of leaves uninfested (pn=
1-p) and the sample mean (x) as shown by Nachman (1984). This approach establishes the relationship between the proportion of sampling units infested and the mite population density directly from field observa-tions.
In the case of M. tanajoa, the proportion of leaves in-fested saturates to unity at relatively low densities. For this reason, an enumerative sampling plan based on se-quential sampling methods and Taylor's a and b param-eters (Green, 1970), was developed for higher mite densities. For this procedure, sampling is continued until the cumulative total mites encountered (TJ found
on n leaf samples satisfies equation 6 for level of preci-sion Do:
= ln(D0 2
/a)/(b-2) + ( ( b - (6)
Here the average mite density per leaf (x) is estimated in-directly by dividing the cumulative total number of mites encountered (Tn) by the number of leaves sampled
(n). As this method requires prompt estimates of cumula-tive mites densities (Tn) in the field and direct counts are
not practical, 'quick counts' as outlined above are uti-lized.
Results
Within-plant distribution
The within-plant distribution data confirm that M. tanajoa in Africa is most abundant on young leaves re-gardless of plant age (fig. 1). Mite densities were signifi-cantly greater on young compared to old leaves, and
Sampling Dates Jan.1985 Apr. 1985 « • - 2 7 2 O O o o present; April Planting
«i- nobps present
July Planting
_•
October Planting 10 100 1000 10 100 1000 Mites/Leaf 10 100 1000Fig. 1. Within-plant distribution of total mites (eggs + actives) per leaf on cassava planted in April, July and October 1984 sampled at the beginning (November), middle (January), and end (April) of the 1984-85 dry season.
204 J.S Yaninek, J. Baumgaertner and A.P Gutierrez
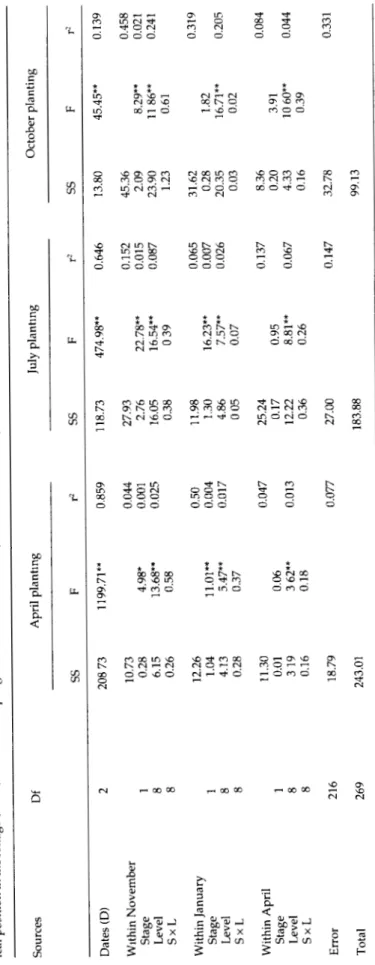
densities steadily declined with leaf age under all condi-tions (Newman-Keuls a posteriori comparison, q-05,2i6,p = <>) (table 1). Peak densities occurred on either the first or third fully developed leaf in all samples, except the No-vember sample from the October planting where a peak density was found on the seventh leaf (fig. 1).
Mite densities on the first developed leaf (FDL) aver-aged 10 + 2% of the total population per branching path based on all samples. This proportion was stable regard-less of time of planting or plant age, and suggests that the FDL is a reasonable choice as a sampling unit for monitoring M. tanajoa on cassava. Whole plant densities can be estimated as the product of 10 times the number of mites on the FDL times the number of branching paths with leaves.
A significantly greater proportion of eggs compared to active stages was found at the end of the wet season (all planting dates; table 1). This trend was reversed at the height of the dry season in January samples from April and July plantings when the suitability of the re-maining leaves and M. tanajoa reproduction generally de-clined (Yaninek et ah, 1989a). No significant interactions were found between mite stage and leaf position. Thus, most of the explained variation in mite densities was due to planting date, leaf level and mite stage effects.
Dispersion
The parameters of Taylor's (1961) power law (eqn. 2) for the data shown in fig. 2 are; a = 2.604 and b = 1.689 (r2 = 0.964, df = 71, p< 0.001), indicating an aggregated distribution. These values are similar to values reported in the literature for other species of spider mites (Margo-lies et al, 1984; Zahner & Baumgaertner, 1984). Braun et
al. (1989b) reported b values that were similar, but a
values that were considerably higher for M. tanajoa in Colombia.
Sampling plan for M. tanajoa
The number of leaf samples needed for a given level of precision across all observed densities may be
com-1 5 0 o o o U °0D Log(Mltes/Leal)
Fig. 2. Log(variance) to logfmites per leaf) relationship of observed M. tanajoa densities; described by Taylor's power law as: variance = 2.604X1689; N = 73 samples from five fields (each indicated separately), representing a range of sampling periods, planting times, seasons and locations.
30 100 200 300 400
Mites/Leaf
500 600
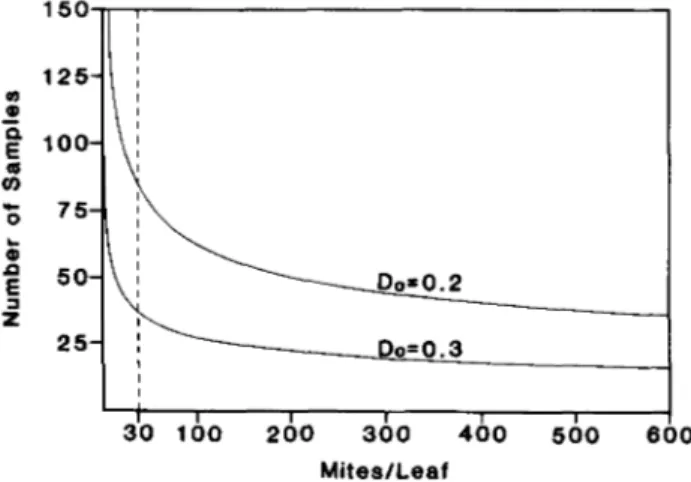
Fig. 3. Number of samples required to estimate mites per leaf using an enumerative sampling procedure at high M. tanajoa densities for a given level of precision, Do. The dashed line
indicates the density above which enumerative sampling is used
puted using Wilson & Room's (1982) enumerative sam-pling rule (eqn. 3) shown in fig. 3. This method requires an accurate estimate of mean density which is often im-practical for field populations of spider mites. The 'quick count' method provides one alternative, but binomial methods are usually more efficient when applicable. A plot of the proportion of infested leaves versus observed mites per leaf indicates that binomial sampling is reason-able only for mite densities below 30 per leaf (fig. 4). At higher densities, the proportion of infested leaves satu-rates, yielding little information. For this reason, the ana-lysis separates into densities above and below 30 mites per leaf.
For field densities below 30 mites per leaf, Wilson & Room's (1983) presence-absence model (eqn. 4) predicted densities which are much lower than those observed (dotted lines, fig. 5). The binomial sampling model pro-posed by Nachman (1984) was a better predictor of mite densities when leaves were not saturated. The fitted
con-0 n D E D eg ct> _ l •cen t o 100- 80- 60- 40- 2 0-+ 0-+ J!+ + + * + i + ^. * • * !
: i
B 1 • 1 1 + Estimates • Counts 100 200 300 Mites/LeafFig. 4 Percentage of leaves infested versus observed mites per leaf for laboratory mite counts (N = 23 field samples) and 'quick count' estimates (N = 159 field samples). The dashed line separates low and high mite densities.
Tabl e 1 . Sources , degree s o f freedo m (Df) , su m o f square s (SS) . F value s (F ) an d th e percentag e explaine d variatio n (r 2) i n a thre e facto r full y crosse d ANOV A o f mit e lif e stages , an d lea f positio n i n th e foliag e (Level ) neste d i n samplin g date s (Dates ) fo r M tanajoa foun d o n cassav a plante d i n April , Jul y an d Octobe r durin g 1984 . Source s D f Apri l plantin g Jul y plantin g Octobe r plantin g S S S S S S Date s (D ) Withi n Novembe r Stag e Leve l Sx L Withi n Januar y Stag e Leve l Sx L Withi n Apri l Stag e Leve l Sx L Erro r Tota l 2 1 8 8 —' 00 00 1 8 8 21 6 26 9 0 8 7 3 10.7 3 0.2 8 6.1 5 0.2 6 12.2 6 1.0 4 4.1 3 0.2 8 11.3 0 0.0 1 31 9 0.1 6 1199.7 1 * * 4.98 * 13.68* * 0.5 8 11.01* * 5.47* * 0.3 7 0.0 6 3 62* * 0.1 8 18.7 9 243.0 1 0.85 9 0.04 4 0.00 1 0.02 5 0.5 0 0.00 4 0.01 7 0.04 7 0.01 3 0.07 7 118.7 3 474.98 * 0.64 6 13.8 0 45.45 * 0.13 9 27.9 3 2.7 6 16.0 5 0.3 8 11.9 8 1.3 0 4.8 6 0 0 5 25.2 4 0.1 7 12.2 2 0.3 6 27.0 0 83.8 8 22.78* * 16.54* * 0 3 9 16.23* * 7.57* * 0.0 7 0.9 5 8.81* * 0.2 6 0.15 2 0.01 5 0.08 7 0.06 5 0.00 7 0.02 6 0.13 7 0.06 7 0.14 7 45.3 6 2.0 9 23.9 0 1.2 3 31.6 2 0.2 8 20.3 5 0.0 3 8.3 6 0.2 0 4.3 3 0.1 6 32.7 8 99.1 3 8.29* * 11 86* * 0.6 1 1.8 2 16.71* * 0.0 2 3.9 1 10 60* * 0.3 9 0.45 8 0.02 1 0.24 1 0.31 9 0.20 5 0.08 4 0.04 4 g 5 |
1
as
§ 0 3 n 0.33 1 O206 J S Yaninek, J. Baumgaertner and A.P Gutierrez o a. o 1 0 0.8 - 0.6- 0.40.2 - nn-O O O^""""^ o O ego o o o . / #o/S ° ! 9 - A ^ ^ ~ ^ < > o 0 ° ..Q_Tf_.Q-o o 0 10 20 30 Mites/Leaf 40 50
Fig 5 Proportion of leaves infested versus observed mites per leaf showing predicted densities based on Wilson & Room's (1983) model (eqn. 4) (dotted line) and Nachman's model (eqn. 5) (solid line)
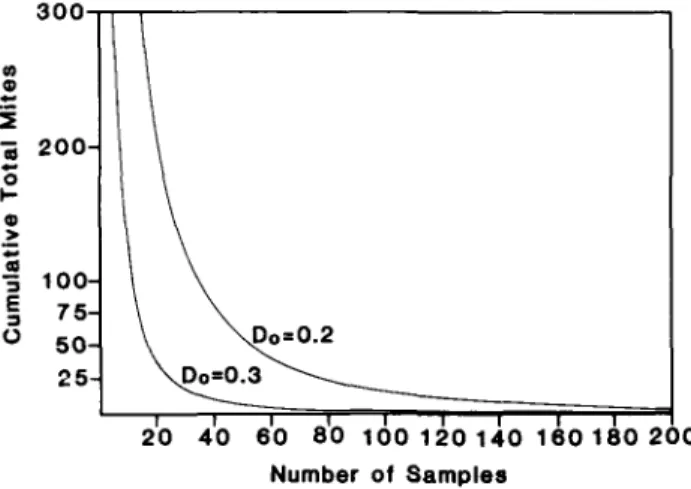
stants of the model are a' = 2.5054362 and b' = 1.133111 (r2 = 0.81, df = 86,p< 0.001). The fit of this model and the Wilson & Room (1983) model (eqn. 4) to the observed data are compared in fig. 5 for densities below 30 per leaf. For mite densities above 30 per leaf, Green's (1970) sequential sampling method estimates the mean density in an indirect manner. The method requires that the cu-mulative number of mites encountered be tallied while sampling until the sampling rule is satisfied (fig. 6). 'Quick counts' may be used to estimate these cumulative densities.
Discussion
The goals of a research project are important consid-erations when developing sampling plans. Research ob-jectives usually require that the data meet a specified level of accuracy, while pest management decisions are often based on problematic considerations such as the likelihood that a pest population will meet or exceed an economic level (Ruesink, 1980).
In Africa, cassava is an exotic subsistence crop grown virtually without agronomic inputs (Silvestre & Arrau-deau, 1983), and few if any pest management decisions
m o i "5 o i— iv e ula t E o 200- 1007 5 5 0 2 5
-I \
\\
\
\
\ \
\
\
\ \
\ \Do=0.2 \ D o = 0 . 3 ^ 20 40 60 80 100 120 140 160 180 200 Number of SamplesFig. 6. Stop lines for constant-precision sequential sampling based on an enumerative procedure for a given level of precision, D,,.
are made for pests such as M. tanajoa. Co-evolved natural enemies of M. tanajoa are absent and cultivar selection for mite resistance is in its infancy in Africa (Yaninek et
al, 1989c). This situation contrasts with conditions in the
Neotropical Region. Most of the research on M. tanajoa has been ecological in nature (Yaninek & Herren, 1988; Yaninek et a\., 1989c) with only secondary pest manage-ment objectives, hence a high degree of data reliability has been sought.
Although the procedures presented here were from a single institutional cassava variety, the phenology and dynamics of M. tanajoa populations were similar on dif-ferent varieties (Yaninek et a\., 1989b) suggesting a wider application of the relationships and methods developed here. The dispersion of M. tanajoa as described by Taylor's (1961) a and b parameters proved to be stable over a range of mite densities, planting times, plant ages, seasons and locations (fig. 2). Dispersion patterns re-mained the same, apparently because the mites track the availability of young leaves (Yaninek et a\., 1989a, 1989b). This suggests that M. tanajoa dispersion characteristics are likely to be similar on cassava varieties with similar agronomic characteristics and grown under similar eco-logical conditions. Accurate estimates of mite popula-tions found on different cassava varieties will require separate procedures. In the meantime, the procedures presented here can be used as a model while new sam-pling plans are developed and verified. New samsam-pling plans are likely to be needed anyway in the future. The density and dispersion characteristics of this mite should change in Africa if effective predators are introduced into the continent and become established (Braun et a\., 1989a; Wilson, 1985; Wilson et al., 1984), or if significant host plant resistance becomes widespread.
Accurate counts of mite densities are largely imprac-tical, hence a simplified 'quick count' census method was developed. In this study, the first developed leaf (FDD was selected as an index of the whole plant mite popula-tion. Binomial methods based on the relationship between the proportion leaves infested and the density of the pest, i.e., presence-absence observations, have been developed and in some cases greatly reduce sam-pling effort.
Wilson & Room's (1983) model (eqn. 4) was initially selected for developing the binomial sampling because much of the mite sampling literature is based on this pro-cedure (Braun et al., 1989b; Wilson et al., 1983; Wilson et
al., 1984; Zalom et al., 1984). However, Nachman's (1984)
model (eqn. 5) was later included because of the poor fit between the estimates provided by Wilson and Room's model and the observed data. Nachman's model proved more accurate for predicting mite densities and is simpler than the model by Wilson and Room. This is not surprising since the model by Wilson and Room is based on parameters estimated from data on numbers of mites, whereas the parameters in Nachman's model come di-rectly from field values. In addition, Nachman's model is more generally applicable since the parameters in his model are independent of a specific distribution, while Wilson and Room's model was derived from a negative binomial distribution.
Unfortunately, the proportion of leaves infested with
M. tanajoa quickly saturates to unity at low mite
den-sities below 30 mites per leaf. The number of samples re-quired to estimate accurately mite densities as the pro-portion of infested leaves approaches zero quickly becomes excessive. Since most practical work on M.
tanajoa focuses on the high densities which occur during
the dry season (Yaninek et a\., 1989b), indicative scores (e.g., <10, > 10 but <20, >20 but < 30 mites per leaf) provide adequate estimates for densities below 30 mites per leaf in most instances. Any artefacts inherent in esti-mated densities near 30 mites per leaf can be minimized by increasing the sampling frequency until the popula-tion moves clearly above or below this level.
For higher densities, the sequential sampling plan developed for use in the field minimizes the number of samples required to achieve a predetermined level of ac-curacy (Green, 1970). The 'quick count' method elimin-ates the need for total counts of mite densities. Using the sequential sampling rule based on 'quick counts' (fig. 6), the number of samples needed to meet a given level of precision can be easily determined.
Field application
In practice, an initial sample of 30 leaves should be taken and the proportion of leaves infested should be de-termined to estimate whether the observed density is above or below 30 mites per leaf. If the density is less than 30 mites per leaf, the sampling plan shown in fig. 5 may be used to determine mite densities based on the propor-tion of infested leaves. If the estimated density of the initial 30 leaf samples is above 30 mites per leaf, the sam-pling rule shown in fig. 6 may be used.
Simplified sampling procedures if properly devel-oped can save time and money without compromising accuracy. However, the same sampling rule may not apply for all conditions under which a population occurs. This was the case for M. tanajoa in this study. An analysis of the mite's dispersion under African condi-tions revealed these needs, and led to the development of density-specific sampling procedures which are simple, yet practical, methods for accurately estimating mite populations.
Acknowledgements
We thank F. Schulthess and A. Braun for reviewing early versions of this paper and an anonymous reviewer for additional helpful comments. The Biological Control Program of the International Institute of Tropical Agri-culture (IITA) is funded by a consortium of donors in-cluding: The International Fund for Agricultural Development (IFAD), the International Development Re-search Center (IDRC), Canada; the Deutsche Gesellschaft fur Technische Zusammenarbeit (GTZ), Germany; the Directorate for Cooperative Development and Humani-tarian Aid (DCA), Switzerland; the Bundeskanzleramt fur Wirtschaftliche Koordination (BWAWIKORD), Austria; the Directorate General for International Coop-eration (DGIS), the Netherlands; the Department for De-velopment Cooperation (DDC), Italy; the Danish International Development Agency (DANIDA), Denmark; the Royal Norwegian Ministry of Develop-ment Cooperation (NORAD), Norway; and Food and Agriculture Organization (FAO).
References
Bellotti, A.C. & van Schoonhoven, A. (1978) Mite and insect
pests of cassava Annual Review of Entomology 23, 39-67
Bellotti, A.C., Byrne, D.H., Hershey, C.H., Vargas, O.H. & Varela, A.M. (1985a) The potential of host plant resistance
in cassava for control of mites and mealybugs, pp. 417-439
m Cock, J.H. & Reyes, J.A. (Eds) Cassava: research production and utilization, cassava program. Call, Colombia, Centro
In-ternational de Agricultura Tropical.
Bellotti, A . C , Reyes, J.A., Guerrero, J.M. & Varela, A.M.
(1985b) The mealybug and cassava green spider mite complex in the Americas: problems of and potential for biological control, pp. 393^416 in Cock, J.H. & Reyes, J.A
(Eds) Cassava: research production and utilization, cassava program. Cali, Colombia, Centro International de
Agricultu-ra Tropical.
Braun, A.R., Bellotti, A . C , Guerrero, J.M. & Wilson, L.T.
(1989a) Effect of predator exclusion on cassava infested with tetranychid mites (Acari: Tetranychidae)
Environmen-tal Entomology 18, 711-714.
Braun, A.R., Guerrero, J.M., Bellotti, A.C. & Wilson, L.T.
(1989b) Within plant distribution of Mononychellus tanajoa (Bondar) (Acari: Tetranychidae) on cassava: effect of clone and predation on aggregation. Bulletin of Entomological
Re-search 79, 235-249.
Green, R.H. (1970) On fixed precision level sequential sampling
Researches on Population Ecology 12, 249-251.
Jones, V.P. & Parella, M.P. (1984) Dispersion indices and
se-quential sampling plans for the citrus red mite (Acari. Tet-ranychidae). Journal of Economic Entomology 77, 75-79.
Karandinos, M.G. (1976) Optimum sample size and comments
on some published formulae. Bulletin of the Entomological
Society of America 22, 417-421.
Margolies, D . C , Lampert, E.P. & Kennedy, G.G. (1984)
Sam-pling program for the twospotted spider mite (Acari. Tetra-nychidae) in peanut, journal of Economic Entomology 77, 1024-1026.
Nachman, G. (1984) Estimates of mean population density and
spatial distribution of Tetranychus urticae (Acanna: Tetrany-chidae) and Phytoseiulus persimihs (Acanna. Phytosendae) based upon the proportion of empty sampling units
Journal of Applied Ecology 21, 903-913
Neuenschwander, P. & Herren, H.R. (1988) Biological control
of the cassava mealybug, Phenacoccus mamhoti, by the exotic parasitoid Epidinocarsts lopezi in Africa Philosophical
Transactions of the Royal Society of London B 318, 319-333.
Nyiira, Z.M. (1972) Report of investigation of cassava mite,
Mononychus tanajoa Bondar 14 p p Unpublished report
Kawanda Research Station, Kampala, Uganda.
Ruesink, W.G. (1980) Introduction to sampling theory, p p 6 1
-78 in Kogan, M. & Herzog, D.C (Eds) Sampling methods m
soybean entomology. New York, Springer-Verlag.
Silvestre, P. & Arraudeau, M. (1983) Le manioc. 262 p p Pans,
Maisonneuve et Larose (Techniques agricoles et produc-tions tropicales, 32).
Southwood, T.R.E. (1978) Ecological methods 524 pp. London,
Chapman and Hall.
Taylor, L.R. (1961) Aggregation, variance and the mean. Nature
(London) 189, 732-735.
Wilson, L.T. (1985) Estimating the abundance and impact of
ar-thropod natural enemies in IPM systems p p 303-322 in Hoy, M A. & Herzog, D C (Eds) Biological control m
208 J.S Yaninek, J. Baumgaertner and A.P Gutierrez
Wilson, L.T. & Room, P.M. (1982) The relative efficiency and
re-liability of three methods for sampling arthropods in Aus-tralian cotton fields. Journal of the AusAus-tralian Entomological Society 21,175-181.
Wilson, L.T. & Room, P.M. (1983) Clumping patterns of fruit
and arthropods in cotton, with implications for binomial sampling. Environmental Entomology 12, 50-54.
Wilson, L.T., Gonzalez, D., Leigh, T.F., Maggi, V., Foristiere, C. & Goodell, P. (1983) Within-plant distribution of spider
mites (Acan: Tetranychidae) on cotton: a developing im-plementable monitoring program. Environmental Entomolo-gy 12,128-134.
Wilson, L.T., Hoy, M.A., Zalom, F.G. & Smilanick, J.M. (1984)
Sampling mites in almonds: I. within-tree distribution and clumping pattern of mites with comments on predator-prey interactions. Hilgardia 52,1-13.
Yaninek, J.S. (1985) Field monitoring of M. tanajoa populations,
pp. 136-138 in Annual Report -1984. International Institute of Tropical Agriculture, Ibadan, Nigeria.
Yaninek, J.S. (1988) Continental dispersal of the cassava green
mite, an exotic pest in Africa, and implications for biologi-cal control. Experimental and Applied Acarology 4,211-224.
Yaninek, J. S., Gutierrez, A.P. & Herren, H.R. (1989a) Dynamics
of Mononychellus tanajoa (Acan: Tetranychidae) in Africa-experimental evidence of temperature and host plant effects on population growth rates. Environmental Ento-mology 18,633-640.
Yaninek, J.S. & Herren, H.R. (1988) Introduction and spread of
the cassava green mite, Mononychellus tanajoa (Bondar) (Acari: Tetranychidae), an exotic pest in Africa and the
search for appropriate control methods' a review. Bulletin
of Entomological Research 78, 1-13.
Yaninek, J.S., Herren, H.R. & Gutierrez, A.P. (1987) The
bio-logical basis of cassava green mite outbreaks in Africa Insect Science and its Application 8,861-865.
Yaninek, J.S., Herren, H.R. & Gutierrez, A.P. (1989b) Dynamics
of Mononychellus tanajoa (Acari. Tetranychidae) in Africa, seasonal factors affecting phenology and abundance. Envi-ronmental Entomology 18, 625-632.
Yaninek, J.S., Moraes, G.J. de & Markham, R.H. (1989c)
Hand-book on the cassava green mite (Mononychellus tanajoa) in Africa: a guide to their biology and procedures for implementing classical biological control. 140 pp. International Institute of Tropical Agriculture, Ibadan, Nigeria.
Yaninek, J.S., Gutierrez, A.P. & Herren, H.R. (1990) Dynamics
of Mononychellus tanajoa (Acari: Tetranychidae) in Africa, impact on dry matter production and allocation in cassava, Manihot esculenta Crantz. Environmental Entomology 19, 1767-1772
Zahner, P. & Baumgaertner, J. (1984) Sampling statistics for
Panonychus ulmi (Koch) (Acanna, Tetranychidae) and Tetra-nychus urticae Koch (Acarina, Tetranychidae) feeding on apple trees. Researches on Population Ecology 26,97-112.
Zalom, F.G., Hoy, M.A., Wilson, L.T. & Barnett, W.W. (1984)
Sampling mites in almonds: II. presence-absence sequential sampling for Tetranychus mite species. Hilgardia 52,14-24.
(Accepted 20 October 1990) © C.A.B. International 1991