Magn Reson Mater Phy (2009) 22:1–4 DOI 10.1007/s10334-008-0152-0
S H O RT C O M M U N I C AT I O N
In vivo measurement of glycine with short echo-time
1
H MRS
in human brain at 7 T
Giulio Gambarota · Ralf Mekle · Lijing Xin · Martin Hergt· Wietske van der Zwaag · Gunnar Krueger · Rolf Gruetter
Received: 17 August 2008 / Revised: 30 September 2008 / Accepted: 3 October 2008 / Published online: 24 October 2008 © ESMRMB 2008
Abstract
Object To determine whether glycine can be measured at 7 T in human brain with1H magnetic resonance spectroscopy (MRS).
Materials and methods The glycine singlet is overlapped by the larger signal of myo-inositol. Density matrix simu-lations were performed to determine the TE at which the myo-inositol signal was reduced the most, following a single spin-echo excitation.1H MRS was performed on an actively shielded 7 T scanner, in five healthy volunteers.
Results At the TE of 30 ms, the myo-inositol signal intensity was substantially reduced. Quantification using LCModel yielded a glycine-to-creatine ratio of 0.14 ± 0.01, with a Cramér–Rao lower bound (CRLB) of 7± 1%. Furthermore, quantification of metabolites other than glycine was possible as well, with a CRLB mostly below 10%.
Conclusion It is possible to detect glycine at 7 T in human brain, at the short TE of 30 ms with a single spin-echo exci-tation scheme.
G. Gambarota (
B
)· R. Mekle · L. Xin · W. van der Zwaag · R. GruetterLaboratory of Functional and Metabolic Imaging, Ecole Polytechnique Fédérale de Lausanne (EPFL), CH-F0-626, Station 6, 1015 Lausanne, Switzerland e-mail: [email protected]; [email protected] R. Mekle· R. Gruetter
Department of Radiology, University of Lausanne, Lausanne, Switzerland
M. Hergt· G. Krueger
Advanced Clinical Imaging Technology,
Siemens Medical Solutions, Lausanne, Switzerland R. Gruetter
Department of Radiology, University of Geneva, Geneva, Switzerland
Keywords Glycine· Magnetic resonance spectroscopy · 7 T· Human brain
Introduction
Glycine is an inhibitory neurotransmitter at glycinergic synapses and an excitatory neurotransmitter at glutamater-gic synapses in the adult mammalian central nervous system [1]. It has been shown that glycine administration to schizo-phrenia patients improves the NMDA receptor function [2]. Furthermore, elevated levels of glycine have been observed in brain tumors and glycine possibly represents a marker for tumor malignancy [3,4]. Thus, it is of great interest to explore non-invasive methods to measure brain glycine.
In general, glycine detection requires specific1H magnetic resonance spectroscopy (MRS) editing approaches to over-come the problem of overlap with the much larger resonances of myo-inositol. A number of methods have been propo-sed to this aim: at 3 T, the 2D J-PRESS sequence [5] and another method, which uses multiple refocusing pulses at a very long echo time (TE) [6], and at 4 T, the TE-averaged PRESS sequence [7]. These approaches, however, involve data acquisition at long TEs. With increasing field strength, the Hahn T2 of metabolites decreases due to an increased dynamic dephasing contribution. The T2 of NAA, for ins-tance, decreases from∼240ms at 4T to ∼160ms at 7T [8]. Thus, at high fields, these approaches might suffer from a substantial signal loss, due to data acquisition at long TE.
As the number of MR scanners operating at 7 T is steadily increasing, it is of interest to investigate the potential of MRS at 7 T for in vivo detection of less well represented metabo-lites, such as glycine, which can have a considerable impact in clinically relevant topics. At 7 T, the high signal-to-noise ratio (SNR) and increased spectral dispersion are expected
2 Magn Reson Mater Phy (2009) 22:1–4 to result in a higher precision of metabolite quantitation and
this could allow for investigations of smaller voxel sizes, which better match a specific brain anatomy. However, spec-tral overlap with the larger resonances of the myo-inositol still hampers the detection of glycine and previous MRS studies performed at 7 T reported no detection of glycine [9,10].
The aim of the present study was to determine whether glycine can be measured at 7 T with a short-TE approach, so as to also allow for quantitation of metabolites other than glycine.
Materials and methods Theory
The MR detectable protons of glycine generate a singlet at 3.55 ppm, which overlaps with the strongly coupled reso-nances of myo-inositol at 3.52 ppm. As the TE increases, the signal intensity of the glycine singlet decreases due to T2 relaxation. In contrast, the evolution of the coupled reso-nances of myo-inositol is more complex. In addition to the T2 relaxation signal loss, myo-inositol displays a J-induced signal dephasing already at a relatively short TE, because of its large J-coupling constants. Consequently, a possible approach for measuring glycine is to identify a TE at which the myo-inositol signal intensity is reduced relative to that of glycine. Myo-inositol can be modelled as an AM2N2P spin system, where the relevant resonances for glycine detec-tion are the M2protons at 3.52 ppm and the N2protons at 3.61 ppm [11]. In the present study, the spectrum of myo-inositol was simulated as a function of TE, for a single spin-echo coherence generation, using the density matrix for-malism [12,13]. Radio-frequency (RF) pulses were modeled as infinitely short, non-selective pulses [12,13].
MR experiments
All experiments were conducted according to the procedure approved by the institutional review board. Experiments were performed on an actively shielded 7T/68 cm MR scanner (Siemens Medical Solutions, Erlangen, Germany) with a head gradient insert (41 cm, 80 mT/m maximum gradient strength). A home-built quadrature surface coil with two 13 cm-diameter loops was used as a transmitter/receiver. Gradient-echo multislice images were acquired for anato-mical localization, to position a 2× 2 × 2 cm3voxel of inter-est (VOI) in the occipital lobe. After first- and second-order shimming with an EPI version of FASTMAP [14], a typical water linewidth in the VOI of interest was 11–12 Hz. Spec-tra were acquired using the spin echo full i ntensity acquired localization (SPECIAL) scheme, as described more in detail
elsewhere [15]. Briefly, SPECIAL consisted of a spin-echo sequence with a slice-selective 90◦asymmetric pulse [16] of 1.28 ms duration and 5.3 kHz bandwidth and a slice-selective 180◦pulse [17] of 3.2 ms duration and 1.8 kHz bandwidth. Signal localization in the third dimension was achieved by a 1D ISIS approach, with an adiabatic hyperbolic-secant inversion pulse of 5 ms duration. Prior to signal excitation, VAPOR water signal suppression and outer volume satu-ration (OVS) were performed [16]. The volume selection performed with a 1D ISIS approach can be more suscep-tible to subject motion, compared to standard single-shot acquisition approaches such as PRESS and STEAM. On the other hand, the OVS bands applied prior to excitation highly reduce the sensitivity to motion by nulling the signal from tissues surrounding the VOI. As a result, no data degrada-tion due to modegrada-tion was observed in this study. Spectra at the TE of 30 ms (TR= 4s, number of averages = 64, spec-tral width= 4kHz, 512ms acquisition time) were acquired in five healthy volunteers. Metabolite concentrations and Cramér–Rao lower bounds (CRLB) were determined by LCModel [18], using a basis set of 21 metabolites.
Results
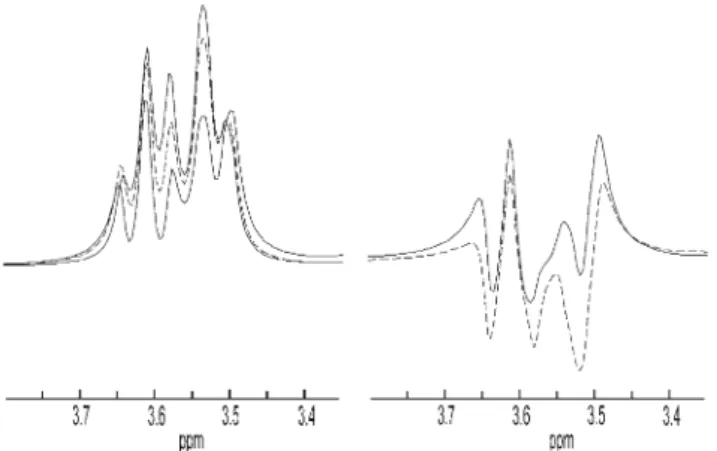
Density matrix simulations showed that at a very short TE, myo-inositol resonances displayed only a small dephasing induced by J-modulation. For TEs up to∼10ms, the effect of the J-modulation on myo-inositol spectral shape was negli-gible, under single spin-echo excitation (Fig.1, left). As TE increased, the signal dephasing became more pronounced, in particular for TE in the 30–40 ms range (Fig.1, right). At the TE of 30 ms, the spectral lineshape of myo-inositol
reso-Fig. 1 Density matrix simulations of the M2 and N2 myo-inositol
resonances under single spin-echo excitation at 7 T. Left From top to bottom: simulated spectral lineshape at the TE of 2 ms (solid line), 10 ms (dashed line) and 20 ms (solid line). Right Simulated spectral lineshape at the TE of 30 ms (solid line) and 40 ms (dashed line)
Magn Reson Mater Phy (2009) 22:1–4 3 nances was largely reduced at the resonance frequency of the
glycine singlet. Thus, this TE was chosen for in vivo mea-surements. In vivo1H MR spectra at TE= 30ms showed a substantial signal modulation in myo-inositol, as well as in other strongly coupled spin systems, such as the AB spin system of the NAA aspartate moiety at 2.48 and 2.67 ppm, for instance (Fig.2). When in vivo spectra were fitted to a basis set, which did not include the glycine peak, a large fit residual with positive amplitude was observed at 3.55 ppm (Fig.3, left). This residual was minimized to the noise level when including glycine in the basis set (Fig.3, right). Quan-tification using LCModel yielded a glycine-to-creatine ratio of 0.14 ± 0.01, with an average CRLB of 7 ± 1%. Further-more, quantitation of metabolites other than glycine was pos-sible as well, with CRLB mostly below 10% (Table1). The detection of less well represented metabolites suffered from the signal loss due to the J-evolution of coupled resonances. It should be noted that, despite its lower concentration, the CRLB of glutathione was much lower than that of gluta-mine (Table1). This can be ascribed to the fact that the spin system of glutathione includes a singlet at 3.77 ppm, the ‘glycine moiety’ [11], which does not experience signal loss due to J-modulation.
Discussion
In the current study, we show that it is possible to reliably measure glycine at 7 T, at the short TE of 30 ms. Furthermore, at this TE a large number of metabolites can be detected with a CRLB mostly below 10%. The current approach has the advantage of experimental simplicity, since no editing RF pulses or gradient schemes are required to resolve the gly-cine resonance. In view of the potential application to tumor grading, where multivoxel approaches are necessary, the low CRLB of glycine (<10%) achieved in this study would possi-bly ensure reliable detection also for voxel sizes smaller than the one used in the current study.
SPECIAL is a novel localization method for in vivo MRS. SPECIAL, like PRESS, is based on a spin-echo acquisition scheme and thus provides full signal intensity from the selec-ted VOI. SPECIAL generates a single spin-echo coherence selection which results in a faster signal dephasing indu-ced by the J-modulation when compared to the double spin-echo coherence selection of PRESS. This is due to the lack of the second refocusing 180◦ pulse, which in the PRESS sequence partially quenches the signal dephasing induced by the J-modulation. Thus, the advantage of SPECIAL is that a short TE (i.e. 30 ms) can be used, while for PRESS a longer TE would be required to detect glycine. However, at longer TEs, a decrease in SNR is to be expected because of increased T2 signal losses, which are increasingly important at 7 T.
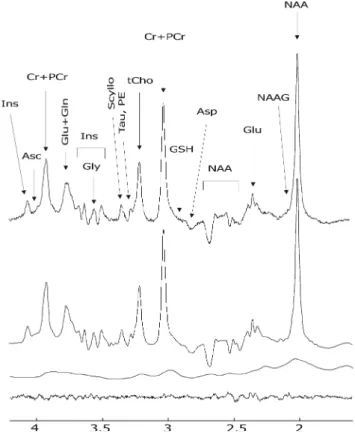
Fig. 2 In vivo1H MR spectrum at 7 T, LCModel fit, LCModel fit of the macromolecule spectrum and residuals (from top to bottom), at TE = 30ms. The spectrum was acquired in a 2×2×2 cm3voxel of interest
(VOI) in the occipital lobe, with the SPECIAL sequence (Asc ascor-bate, Asp aspartate, tCho total choline= GPC (glycerophosphocho-line)+ PCho (phosphocholine), Cr + PCr creatine + phosphocreatine,
Gln glutamine, Glu glutamate, Gly glycine, GSH glutathione, Ins
myo-inositol, NAAG N-Acetylaspartylglutamate, NAA N-acetylaspartate, PE Phosphoethanolamine, Scyllo scyllo-inositol, Tau taurine)
Fig. 3 Residuals obtained from the LCModel fit using a basis set
without (left) and with (right) glycine. The box highlights the reso-nance frequency of the glycine singlet. A large residual with positive amplitude was consistently observed at the glycine resonance frequency in all subjects, when using a basis set without the glycine peak
4 Magn Reson Mater Phy (2009) 22:1–4
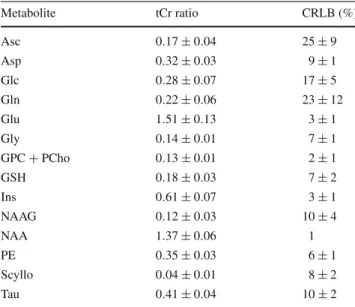
Table 1 Quantification of metabolite concentration (expressed as a
ratio to total creatine, tCr) and Cramér–Rao lower bound (CRLB) at TE = 30 ms Metabolite tCr ratio CRLB (%) Asc 0.17 ± 0.04 25± 9 Asp 0.32 ± 0.03 9± 1 Glc 0.28 ± 0.07 17± 5 Gln 0.22 ± 0.06 23± 12 Glu 1.51 ± 0.13 3± 1 Gly 0.14 ± 0.01 7± 1 GPC+ PCho 0.13 ± 0.01 2± 1 GSH 0.18 ± 0.03 7± 2 Ins 0.61 ± 0.07 3± 1 NAAG 0.12 ± 0.03 10± 4 NAA 1.37 ± 0.06 1 PE 0.35 ± 0.03 6± 1 Scyllo 0.04 ± 0.01 8± 2 Tau 0.41 ± 0.04 10± 2
Glc glucose; for the other abbreviations, see Fig.2legend
Previously reported values of glycine-to-creatine ratio were in the range of 0.03–1.23, with average values of CRLB in the range of 12–16% [5–7]. The glycine concentration observed in the current study is at the upper limit of the reported values, while the CRLB is substantially smaller. It should be noted that at 7 T the sensitivity of editing methods previously used for glycine detection might suffer from the shortened T2. With data acquisition at short TE, the quanti-tation benefits from reduced T2 losses. Thus, the SNR of the current method is large compared to that of long TE approaches.
Conclusion
In conclusion, glycine can be measured at 7 T in human brain in vivo, at the short TE of 30 ms. In the current approach, no additional RF pulses—other than those needed for signal localization—were required to detect the glycine resonance.
Acknowledgments Supported by Centre d’Imagerie BioMédicale (CIBM) of the UNIL, UNIGE, HUG, CHUV, EPFL and the Leenaards and Jeantet Foundations, as well as Swiss National Science Foundation grant 3100A0-116220.
References
1. Betz H, Laube B (2006) Glycine receptors: recent insights into their structural organization and functional diversity. J Neurochem 97:1600–1610
2. Heresco-Levy U, Ermilov M, Lichtenberg P, Bar G, Javitt DC (2004) High-dose glycine added to olanzapine and risperidone for the treatment of schizophrenia. Biol Psychiatry 55:165–171 3. Kinoshita Y, Kajiwara H, Yokota A, Koga Y (1994) Proton
magnetic resonance spectroscopy of brain tumors: an in vitro study. Neurosurgery 35:606–613; discussion 613–604
4. Lehnhardt FG, Bock C, Rohn G, Ernestus RI, Hoehn M (2005) Metabolic differences between primary and recurrent human brain tumors: a 1H NMR spectroscopic investigation. NMR Biomed 18:371–382
5. Schulte RF, Boesiger P (2006) ProFit: two-dimensional prior-knowledge fitting of J-resolved spectra. NMR Biomed 19:255–263 6. Choi C, Bhardwaj PP, Seres P, Kalra S, Tibbo PG, Coupland NJ (2008) Measurement of glycine in human brain by triple refocusing 1H-MRS in vivo at 3.0T. Magn Reson Med 59:59–64
7. Prescot AP, de Frederick BB, Wang L, Brown J, Jensen JE, Kauf-man MJ, Renshaw PF (2006) In vivo detection of brain glycine with echo-time-averaged (1)H magnetic resonance spectroscopy at 4.0 T. Magn Reson Med 55:681–686
8. Michaeli S, Garwood M, Zhu XH, DelaBarre L, Andersen P, Adriany G, Merkle H, Ugurbil K, Chen W (2002) Proton T2 relaxa-tion study of water, N-acetylaspartate, and creatine in human brain using Hahn and Carr-Purcell spin echoes at 4T and 7T. Magn Reson Med 47:629–633
9. Mangia S, Tkac I, Gruetter R, Van De Moortele PF, Giove F, Maraviglia B, Ugurbil K (2006) Sensitivity of single-voxel 1H-MRS in investigating the metabolism of the activated human visual cortex at 7 T. Magn Reson Imaging 24:343–348
10. Tkac I, Andersen P, Adriany G, Merkle H, Ugurbil K, Gruetter R (2001) In vivo 1H NMR spectroscopy of the human brain at 7 T. Magn Reson Med 46:451–456
11. Govindaraju V, Young K, Maudsley AA (2000) Proton NMR che-mical shifts and coupling constants for brain metabolites. NMR Biomed 13:129–153
12. Gambarota G, van der Graaf M, Klomp D, Mulkern RV, Heerschap A (2005) Echo-time independent signal modulations using PRESS sequences: a new approach to spectral editing of strongly coupled AB spin systems. J Magn Reson 177:299–306 13. Mulkern RV, Bowers J (1994) Density matrix calculations of AB
spectra from multiple sequences: quantum mechanics meets in vivo spectroscopy. Concepts Magn Reson 6:1–23
14. Gruetter R, Tkac I (2000) Field mapping without reference scan using asymmetric echo-planar techniques. Magn Reson Med 43:319–323
15. Mlynarik V, Gambarota G, Frenkel H, Gruetter R (2006) Localized short-echo-time proton MR spectroscopy with full signal-intensity acquisition. Magn Reson Med 56:965–970
16. Tkac I, Starcuk Z, Choi IY, Gruetter R (1999) In vivo 1H NMR spectroscopy of rat brain at 1 ms echo time. Magn Reson Med 41:649–656
17. Mao JT, Yan H, Fitzsimmons JR (1990) Slice profile improvement for a clinical MRI system. Magn Reson Imaging 8:767–770 18. Provencher SW (1993) Estimation of metabolite concentrations
from localized in vivo proton NMR spectra. Magn Reson Med 30:672–679