HAL Id: hal-03195799
https://hal.inria.fr/hal-03195799
Submitted on 12 Apr 2021
HAL is a multi-disciplinary open access
archive for the deposit and dissemination of
sci-entific research documents, whether they are
pub-lished or not. The documents may come from
teaching and research institutions in France or
abroad, or from public or private research centers.
L’archive ouverte pluridisciplinaire HAL, est
destinée au dépôt et à la diffusion de documents
scientifiques de niveau recherche, publiés ou non,
émanant des établissements d’enseignement et de
recherche français ou étrangers, des laboratoires
publics ou privés.
Understanding microarchitectural effects on the
performance of parallel applications
Carsten Bruns, Sid Touati
To cite this version:
Carsten Bruns, Sid Touati. Understanding microarchitectural effects on the performance of parallel
applications. The 2020 International Conference on High Performance Computing & Simulation, Mar
2021, Virtual, Spain. �hal-03195799�
Understanding microarchitectural effects on the
performance of parallel applications
*
Carsten Bruns
Universit´
e Cˆ
ote d’Azur,
I3S / Inria Kairos
Sophia Antipolis, France
[email protected]
Sid Touati
Universit´
e Cˆ
ote d’Azur,
I3S / Inria Kairos
Sophia Antipolis, France
[email protected]
April 8, 2021
Abstract
Since several years, classical multiprocessor systems have evolved to multicores, which tightly integrate multiple CPU cores on a single die or package. This technological shift leads to sharing of microarchitectural resources between the individual cores, which has direct im-plications on the performance of parallel apim-plications. It consequently makes understanding and tuning these significantly harder, besides the already complex issues of parallel pro-gramming. In this work, we empirically analyze various microarchitectural effects on the performance of parallel applications, through repeatable experiments. We show their impor-tance, besides the effects described by Amdahl’s law and synchronization or communication considerations. In addition to the classification of shared resources into storage and band-width resources of Abel et al. [1], we view the physical temperature and power budget also as a shared resource. Dynamic Voltage and Frequency Scaling (DVFS) over a wide range is needed to meet these constraints in multicores, thus it is a very important factor for per-formance nowadays. Our work aims to gain a better understanding of perper-formance-limiting factors in high performance multicores, it shall serve as a basis to avoid them and to find solutions to tune parallel applications.
Keywords— Scalability of parallel applications, Multicore processors, Shared resources, OpenMP
1
Introduction
The performance demands for computing systems are continuously increasing. On the other hand, in-dividual CPU cores cannot be improved a lot anymore since fundamental limits are already closely approached: clock frequencies cannot be increased further due to power constraints, the amount of Instruction-Level Parallelism (ILP) present in programs is well exploited and memory systems, com-posed of main memory and caches, barely improve. The only available solution is to use multiple cores in parallel, to benefit from coarse-grained parallelism provided by multithreaded applications or by a workload composed of a set of applications. Historically, such multiprocessor systems use a separate die and package for each computation core. Nowadays, manufacturers are able to build multicore pro-cessors, also called Chip Multiprocessors (CMPs). Those integrate multiple cores closely together on a single die, or at least in the same package, thus they simplify the system design, reduce the cost and most important allow for more cores in a system. Multicore processors have become the state of the art in High-Performance Computing (HPC), servers, desktops, mobile phones and even start to be used in embedded systems. The current flagship processor of Intel for example includes 56 cores (Xeon Platinum 9282) and AMD released the Epyc Rome with up to 64 cores (Epyc 7742).
This tight integration directly results in a way closer coupling between the individual cores. Some resources are usually shared between the cores for numerous reasons:
to save chip area: e.g. shared interconnect/Network-on-Chip (NoC), which also impacts accesses to the memory controller, L3 cache, etc.;
*This work has been supported by the French government, through the UCAJEDIand EUR DS4H Investments
in the Future projects managed by the National Research Agency (ANR) with the reference number ANR-15-IDEX-01 and ANR-17-EURE-004.
to dynamically use resources where they are needed, to redistribute them to cores that need them at the moment: e.g. shared caches;
but also just due to the physical integration on a common die/package: e.g. power budget, common cooling system.
Even though some of those can be avoided, they might be wanted. Chip designers would make a resource shared to save area only if they assume it does not degrade performance in most usage scenarios and using the freed area for other functionality improves the overall system performance in the end. Allowing to redistribute resources among cores, e.g. cache capacity, can likewise be beneficial when co-running applications have different demands. Nonetheless, shared resources might still degrade performance in cases where a resource gets saturated, i.e. is not able to serve all incoming accesses at the same time such that CPU cores have to stall. Note that those stalls happen invisibly in the underlying hardware, i.e. the OS does not see them and reports a high CPU usage with low idle times to the user. Shared resources thus allow for interference between the cores, having strong implications for the performance of the system. We consequently need to take microarchitectural features into account when trying to understand the performance of parallel applications.
We can view the application’s parallel performance in relation to a purely sequential version of it. This allows us to analyze the scalability, i.e. the relative runtime, or speedup, of parallel executions compared to the sequential base version, when increasing the number of used threads. Each thread is thereby executed by an independent CPU core. As a result, we only take into account effects due to the parallel execution and omit everything that also happens in sequential executions.
In this work, we show why and how shared resources in multicore processors can be dominant factors for parallel scaling and thus limit the maximum performance. First, in Section 2, we review the current state of the art for parallel scalability and resource sharing. Section 3 then describes our experiments and hardware setup in detail. Based on the gained data, we analyze different classes of microarchitectural effects in CMPs in Section 4, including their characteristic behavior. Finally, Section 5 concludes. With the knowledge we gain throughout this paper, the effects can be identified easier and possibly avoided by programmers and system designers.
2
Related work
The most famous work on parallel scalability is without doubt Amdahl’s law [2], stating that the per-formance of a parallel application is fundamentally limited by the sequential code fraction which cannot be parallelized. Several papers try to adapt this observation for other challenges. Hill and Marty extend it for multicore chip design [3]. They are interested in the trade-off between faster but larger individual cores and the number of cores that fit on a chip. Yavits et al. build on this and add inter-core communication and sequential to parallel data synchronization [4]. The Universal Scalability Law (USL) by Gunther et al. [5] is a model based on queuing theory. In this work, we use matrix multiplication which has no sequential code parts, apart from small OpenMP overheads. No communication between the individual threads is required. We still observe scaling behaviors far from linear in our experiments, due to various microarchitectural effects.
Several papers present scalability curves which cannot be well described by Amdahl’s law. These include superlinear speedups [6], i.e. a scaling behavior better than linear with the number of used cores, scalability curves with steps [7], as well as curves which clearly decrease with increasing thread count after a certain maximum [8]. Many speedup curves in the literature are not well analyzed and no or only a simple interpretation is provided. This motivates our work.
Nowadays, even for real-time systems, multicores are used in order to meet increasing performance requirements. Safe upper bounds on the Worst Case Execution Time (WCET) are needed here, thus researchers started to study how cores interfere with each other through shared resources. Wilhelm et al. discuss in [9] that modern architectures are pipelined with complex features, e.g. out-of-order execution, and might thus exhibit timing anomalies as in [10]. Simplified, those are situations where a local worst case, e.g. a cache miss, does not cause the global worst case of execution time. Based on this, Wilhelm et al. classify architectures as fully timing compositional (no timing anomalies), compositional with constant-bounded effects (bounded by a fixed number of penalty cycles) and noncompositional architectures (anomalies can have arbitrary effects) [9]. Most proposed static analysis for resource sharing, e.g. [11, 12], are only feasible for fully compositional architectures. Here, penalties of individual effects can be viewed in isolation and then added together. However, the Intel Xeon we use has to be assumed noncompositional. We discuss the impact of this in Section 3.
Resource sharing and especially contention of resources has been studied in the context of co-scheduling, where a workload composed of multiple applications needs to be scheduled in time and on the set of available cores of a system. Antonopoulos et al. [13] observe that the memory bandwidth
often limits performance for (bus-based) computing systems. They propose co-scheduling policies which select co-runners using as much of the available bandwidth as possible, without exceeding its limit. In [14], Knauerhase et al. focus on balancing the load between multiple Last Level Caches (LLCs). The researchers argue that the number of cache misses per cycle indicates cache interferences well, thus they use it as a heuristic to guide their co-scheduling decisions. Zhuravlev et al. [15] make a more detailed analysis of the impact of various shared resources when two applications run together - they study the DRAM controller, the Front Side Bus (FSB), the LLC and resources involved in prefetching. Based on this, they discuss schemes to predict mutual degradation of co-running applications. The authors conclude that simply the number of LLC misses per cycle, as used by Knauerhase et al., serves as a good heuristic to estimate the degree of contention. This is explained by a high correlation of the misses with DRAM, FSB and prefetch requests. The work of Bhadauria and McKee [16] considers multithreaded programs. An application which does not scale well to high thread counts because it saturates a hardware resource can run with a lower thread count and another application with lower intensity on this resource is co-scheduled on the remaining cores. Sasaki et al. [17] follow a similar approach but base their scheduling decisions only on the scalability of the programs when run in isolation. In [18] the authors consider modern NUMA machines. Four factors are identified to be important: contention either for the LLC, memory controller or interconnect, as well as the latency of remote memory accesses. The previous solutions are found to not work well because they frequently change the core on which a thread runs but the data stays in memory at the original node. This increases interconnect contention, contention for the memory controller at the remote node and introduces remote memory access latency, only LLC contention is reduced. The authors thus propose to move threads only when clearly beneficial and to migrate a certain amount of actively used memory pages with the thread to the new node. Similar works targeting Simultaneous Multithreading (SMT) processors also try to maximize the symbiosis between co-running threads, but for an individual physical core instead of at chip level.
Scalability of a parallel application, which is our topic here, can be seen as a special case of co-scheduling where all threads have identical characteristics, though can share memory regions. Still, similar microarchitectural resources will present bottlenecks and insights can be used in both disciplines. A general overview of resource sharing is provided in [1]. The authors group shared resources into bandwidth resources, as shared buses, and storage resources, as the capacity of shared caches. Resources might be shared between all cores in the system, at chip level or even just between pairs of cores We use this classification as a basis in this paper.
3
Methodology
The timing behavior of current HPC processor architectures is noncompositional, meaning all microar-chitectural effects have to be viewed together resulting in exploding complexity for static analyses. In addition, many internals of our target’s processor microarchitecture are not publicly available such that a detailed timing investigation is impossible. Instead of a static analysis, we therefore use empirical mea-surements to showcase different microarchitectural effects on the performance. A detailed description of the experiments is available in [19].
3.1
Experiment setup
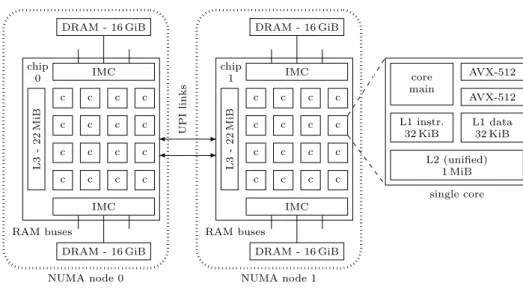
For all our experiments we use a dual-socket workstation with two Intel Xeon Gold 6130 multicore processors. Each of those chips contains 16 physical cores, the whole machine thus has 32 cores. Figure 1 gives an overview of the machine’s architecture. The cores support AVX-512 vector instructions, have private L1 caches for instructions and data, also private L2 caches (inclusive) and an L3 cache shared between all cores of the chip which is non-inclusive (11-way set associative). Two Integrated Memory Controllers (IMCs) per CPU chip offer three DDR4-DRAM channels each, so 12 channels in total. In our machine, only a single 16 GiB module is connected to each IMC, leading to 64 GiB in total with a theoretical peak bandwidth of 85.33 GB/s. The CPU chips are connected over two cache-coherent Intel Ultra Path Interconnect (UPI) links. Each CPU chip together with the RAM connected to it, however, forms a Non-Uniform Memory Access (NUMA) node, i.e. accesses to memory locations physically located at the remote node are slower than local ones.
Our aim is to generate reproducible and understandable results. We thus deactivate Dynamic Voltage and Frequency Scaling (DVFS) through Turbo Boost and P-states. Nevertheless, we allow C-states during the experiments as used cores should not enter any of the sleep states in our high load experiments and this configuration is closer to a usual scenario.
Our experiment applications run under a Linux Mint 19 (Tara) Operating System (OS), with Linux kernel 4.15.0. To reduce interference from other processes, only a minimum set of required services runs
c c c c c c c c c c c c c c c c IMC IMC L3 -22 MiB chip 0 DRAM - 16 GiB DRAM - 16 GiB RAM buses NUMA node 0 c c c c c c c c c c c c c c c c IMC IMC L3 -22 MiB chip 1 DRAM - 16 GiB DRAM - 16 GiB RAM buses NUMA node 1 UPI links core main AVX-512 AVX-512 L1 instr. 32 KiB L1 data 32 KiB L2 (unified) 1 MiB single core
Figure 1: Architecture of our test machine
in the background. We use GCC 8.2.0, ICC 19.0.0.117 and Clang/LLVM 7.0.1 to compile our C++ test codes. Applications using OpenMP link the default OpenMP runtimes in the same versions as the compilers - for GCC to libgomp, for ICC and Clang to libiomp5 respectively libomp5, which use the same source for the implementations. Experiments with Intel’s Math Kernel Library (MKL) use version 2019.0.0. We compile our codes with the -O3 -march=skylake-avx512 flags in all cases. For GCC and ICC, we add the -ffast-math flag. ICC already allows similar optimizations with the -O3 flag. We further force to use the maximum vector width of AVX-512 for GCC as well as for ICC, Clang by default uses the full vector width.
3.2
Experiment description
Our test applications perform a very well studied operation: matrix-matrix multiplication. The computa-tion is embarrassingly parallel, consequently, the algorithm is expected to scale very well with increasing parallel execution capabilities. This allows us to exclude already known parallelization issues and focus on the microarchitectural effects we want to study. We use three implementations with different char-acteristics. The simple implementation is a straightforward code with three nested loops. The tiling implementation explicitly contains tiling on all three loops using additional loops in the nest. Last, our MKL version uses Intel’s library to do the computation.
We employ several methods to reduce runtime variability to a minimum: minimal background ser-vices, fixed thread affinity and controlled NUMA memory allocation. Nonetheless, a noncompositional architecture means that a small variation in the execution of one CPU core can lead to large, unbounded, impacts on the runtime of any of the threads executing in parallel on the multicore. Application runtimes thus likely still vary significantly as shown by Mazouz et al. [20] for parallel applications. We have to capture this and therefore repeat all measurements N = 50 times with identical parameters.
We create sequential and parallel versions of our codes. We evaluate the performance of the parallel versions, for thread counts from one up to the number of physical cores in our machine, i.e. 32, in comparison to the sequential baseline version. Let treal(A, p, n) be the real time, i.e. wall clock time,
of application A, with p threads in experiment repetition n ∈ {0, 1, ..., N − 1} =: I. Further, let Aseq
be the sequential version belonging to A. Since the sequential applications show small variability in our measurements and other studies [20], we use the median of treal of all repetitions of Aseqas a reference
to which we compute speedups. Our empirical parallel speedup is then the set of all speedups achieved in the N measurements of A with a certain thread count p:
Speedupempirical(p)
= {median{treal(Aseq, 1, i) | i ∈ I} treal(A, p, j)
| j ∈ I}. (1)
spends in user and system mode. We obtain CP U usageempirical(p) = { p−1 P i=0 (ti
user(A, p, j) + tisys(A, p, j))
p × treal(A, p, j)
| j ∈ I}.
(2)
We measure the second call of the matrix multiplication function in each run to exclude internal initialization overheads of MKL. Data from hardware performance counters allows us to identify mi-croarchitectural performance issues.
We ran experiments with 72 different configurations of parameters. We denote those in the form (implementation, compiler, data type, memory allocation , affinity policy) in the following. In other words, we first write the matrix multiplication implementation (simple, tiling, MKL), followed by the used compiler (GCC, ICC, Clang) and the used data type (float, double). The fourth parameter is the NUMA memory allocation scheme. Bind here means that we allocate all our data, in particular the matrices, only at NUMA node 0. Interleaved (interl) allocates memory pages in a round-robin fashion on both NUMA nodes, i.e. new pages are assigned alternating between the two nodes. Last, we control the thread affinity, i.e. we bind threads to specific cores of our machine, which is crucial to reduce variability in program execution times [21]. Without fixing the affinity, the OS kernel is free to choose any mapping of threads to cores and, even worse, migrate threads to other cores during execution. The fifth parameter of our configuration notation details the used affinity policy. We use either OpenMP’s spread policy or our own balanced (blcd ) policy, which ensures an equalized thread count on the two CPU chips. For both, at maximum one thread is mapped to each physical core.
The purpose of these various configurations is to generate cases with different characteristic usages of the underlying hardware features. Comparing between two of them only makes sense when both configurations exhibit the same microarchitectural behavior. For example, ICC optimizes the simple implementation with loop tiling, leading to a very different microarchitectural usage compared to GCC and Clang which do not perform such an optimization. This translates to distinct effects in the scaling behaviors. From the point of view of our study, the programs generated by the different compilers have to be seen as different applications. Speedups further only represent the relative scaling behavior and not the absolute runtimes, i.e. a configuration with good scaling behavior might still be worse than another one in absolute terms. However, in this work, this is not an issue as our aim is to analyze effects that limit the scalability, in each configuration individually.
4
Microarchitectural effects on scalability
Our experiment data shows very different scaling behaviors, depending on the experiment configuration. In most of the cases, the parallel scaling is thereby largely inferior to the bound imposed by Amdahl’s law, due to effects in the underlying hardware. In the following, we analyze how, in the respective experiments, these lead to imbalanced work distributions and to three different issues of shared resources: bandwidth resource saturation, storage resource conflicts, as well as a shared power budget limiting consumption of individual cores.
4.1
Work distribution
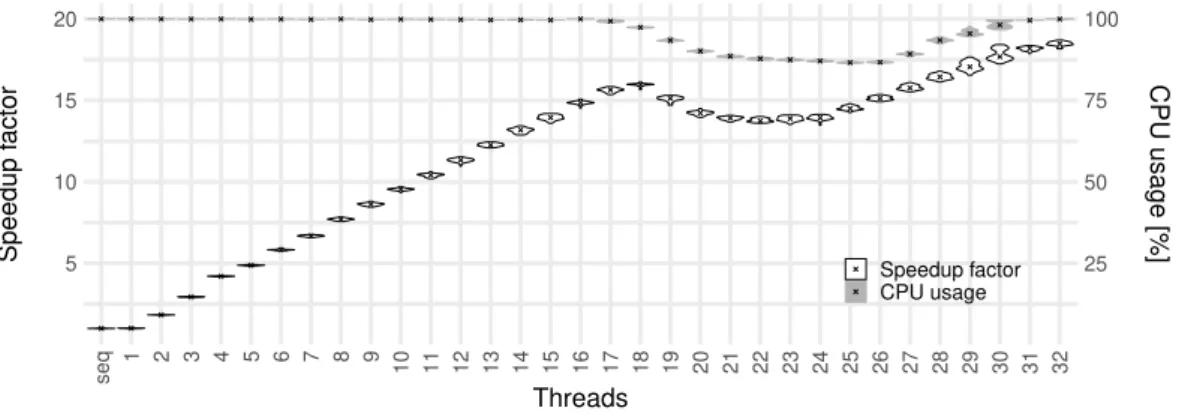
A well-known factor limiting parallel speedup is an unbalanced work distribution among the available computing resources, as the overall performance is determined by the last finishing computation. In the most common case, an application cannot distribute its overall work equally among all of its threads. However, even if all threads have the same amount of computations assigned, the system’s architecture can cause an imbalance between the runtime of the application’s threads, depending on how the threads are mapped to actual physical processor cores. In the architecture of our test machine, computing cores belong to two higher-level groups, the two processor chips, which contain resources shared only between cores inside these groups, e.g. the common L3 cache. Figure 2 visualizes the results for (simple, GCC, float, interl, spread) as a set of violin plots. This type of plot is similar to a boxplot but in addition the sides of the boxes are rotated plots of the estimated probability density distribution. Each individual violin in the plot represents all repetitions of one experiment with a certain thread count, i.e. one violin shows the output of Eq. (1), respectively of Eq. (2), for one input value. We mark median values but omit quartiles, to avoid overloading the figures. We use the same type of plot throughout this paper. In Fig. 2, we show two series of violins, one for the speedup and one for the CPU usage.
The spread affinity policy of OpenMP does not take into account a grouping of cores and lets freedom to the implementation. When increasing the thread count further than 16, gomp’s implementation of
5 10 15 20 25 50 75 100 seq 1 2 3 4 5 6 7 8 9 10 11 12 13 14 15 16 17 18 19 20 21 22 23 24 25 26 27 28 29 30 31 32 Threads Speedup f actor CPU usage [%] Speedup factor CPU usage
Figure 2: Chip imbalance - (simple, GCC, float, interl, spread)
5 10 15 20 25 50 75 100 seq 1 2 3 4 5 6 7 8 9 10 11 12 13 14 15 16 17 18 19 20 21 22 23 24 25 26 27 28 29 30 31 32 Threads Speedup f actor CPU usage [%] Speedup factor CPU usage
Figure 3: Balanced chip usage - (simple, GCC, float, interl, blcd)
spread binds all new threads on chip 1 until all cores of this chip are used at a thread count of 24 (16 threads on cores of chip 1 vs. 8 threads on chip 0). In this experiment, the L3 access bandwidth of a chip gets saturated when more than 10 cores are active. We scrutinize this further in Section 4.2.2. As each thread and with this core gets the same amount of work assigned, from 16 threads on a larger fraction of the overall task is processed on chip 1. However, as soon as the L3 bandwidth bound is reached, the chip’s overall throughput does not increase anymore, or just very slow. The execution time consequently increases with more work assigned to that chip. Starting at 24 threads, the fraction of the work assigned to chip 0 increases again and we see the speedups recover in the plot. Remark that this behavior is also reflected in the CPU usage curve, as fast threads are idle when waiting for the slower ones to finish. Even though such a situation can be mitigated by a careful affinity mapping, it easily occurs if the implementation is not done by an expert and uses the affinity policy provided by OpenMP. We therefore implemented our own affinity policy (balanced, or blcd ) which ensures that the same amount of threads is assigned to each of the chips. Obviously, for odd thread counts a difference of one used core remains between the chips, i.e. a small imbalance. Figure 3 shows the resulting improve in scalability and CPU usage. All the following experiments presented in this paper use this affinity scheme as well. As expected, the reported CPU usage is now close to 100 % for even thread counts - it seems to the OS and the user that the hardware is well utilized, though the subsequent sections show the contrary.
4.2
Shared bandwidth resource saturation
Multicore architectures include many bandwidth resources which are shared among the CPU cores, for example:
the memory access bandwidth,
links for inter-socket communication (e.g. Intel’s UPI in our system), the access bandwidth of the shared L3 cache or
0 2 4 6 8 10 0 100 200 seq 1 2 3 4 5 6 7 8 9 10 11 12 13 14 15 16 17 18 19 20 21 22 23 24 25 26 27 28 29 30 31 32 Threads Speedup f actor
Stall cycles per memor
y access
Speedup factor Stall cycles chip 0 Stall cycles chip 1
Figure 4: Shared memory bandwidth - (MKL, ICC, double, bind, blcd)
We analyze two of those which show to limit performance scalability in our experiments: a shared memory access bandwidth and a shared L3 bandwidth.
4.2.1 Shared memory access bandwidth
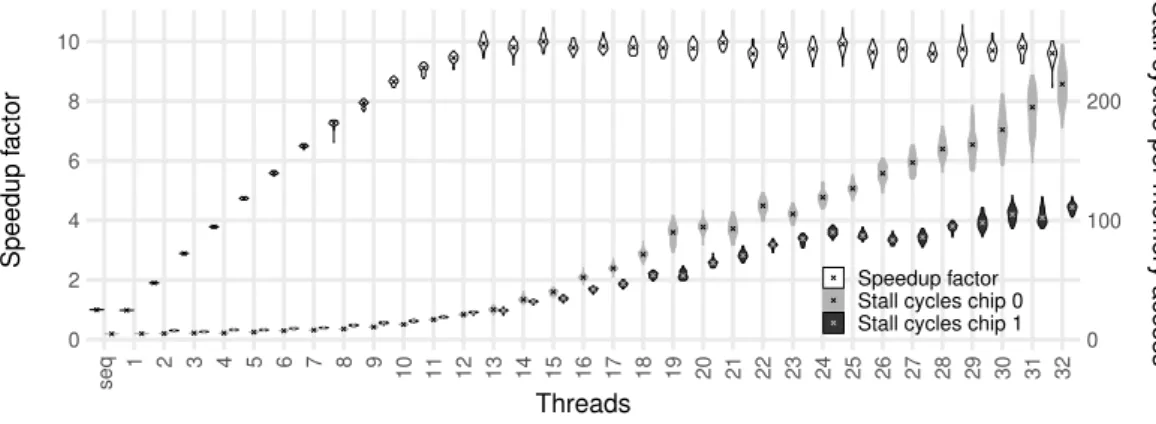
As our machine is a shared memory architecture, all CPU cores access the same physical main memory connected to the IMCs of the NUMA nodes. The available bandwidth of their buses is thus shared among all cores of the system. Figure 4 shows data for (MKL, ICC, double, bind, blcd). We here bind memory allocation to NUMA node 0 only, thus just the memory bandwidth of the IMCs of a single chip of our machine is available, i.e. a theoretical peak bandwidth of 42.66 GB/s. The curve of speedups sharply stops increasing at 13 threads and then stays almost constant. We measured the actual memory bandwidth used during the experiment and it indeed gets close to its limit at the same moment, with a margin between theoretical peak and practically usable bandwidth as in other experiments [7].
To further investigate the memory bandwidth saturation, we also measured the number of mem-ory accesses, gathered through the L3 misses summed over all cores. We obtain this through the LONGEST LAT CACHE.MISS hardware performance counter. For more than two threads, the amount of memory accesses stays constant or even decreases, meaning that the parallelization does not cause ad-ditional accesses. The second and third curves in Fig. 4 show for how many cycles cores have to stall on average for each memory access on the two CPU chips. We get the metric through the quotient of the counters CYCLE ACTIVITY.STALLS MEM ANY and LONGEST LAT CACHE.MISS. Contrary to the number of accesses, these times sharply increase when reaching saturation.
The shapes of the curves suggest advanced data prefetching of MKL: for low thread counts, MKL’s memory accesses incur almost no stall cycles. The usually high memory latency is almost completely hidden. When increasing the number of threads, however, the sum of the shared bandwidth reaches its limit. Now, each individual core gets less and less bandwidth to use but still needs to fetch the same amount of data per computation. As a logical consequence, the data fetch needs longer and does not arrive in time anymore: the cores need to stall. The more threads we add, the worse this situation gets and the stall cycles for memory accesses of all cores increase. Adding new threads thus does not add performance anymore, as the workload and available bandwidth are both shared equally between all used cores. We reverse-engineering parts of MKL, revealing that it indeed extensively uses prefetching through software instructions.
Note that we intentionally use the counter for any memory access instead of STALLS L3 MISS in our metric. Latter does not count stall cycles caused by instructions accessing memory addresses for which a software prefetch was already issued but which did not yet finish fetching the data. A possible pipeline stall however is always caused by the actual memory load instruction and not by the prefetch instruction. As a prefetch is already in flight, the access of the load instruction is counted as a hit in L3 or even in a higher cache level. The cycles are not attributed to the L3-miss stall counter, even though the stall indeed waits for data from main memory. As noted, MKL extensively uses software prefetching - such that this is a commonly occurring case.
4.2.2 Shared L3 bandwidth
Let us now only look at even thread counts in Fig. 3, i.e. only at the thread counts without any work distribution imbalance. We then see that also this scalability curve approaches a limit for more than 20
0e+00 1e+09 2e+09 3e+09 0 5 10 15 20 seq 1 2 3 4 5 6 7 8 9 10 11 12 13 14 15 16 17 18 19 20 21 22 23 24 25 26 27 28 29 30 31 32 Threads L3 hits
Stall cycles per L3 hit
L3 hits
Stall cycles chip 0 Stall cycles chip 1
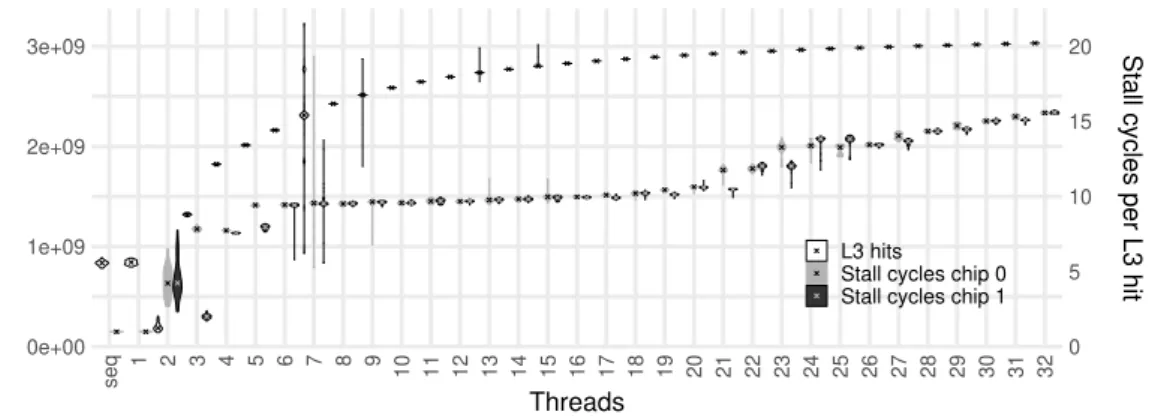
Figure 5: Shared L3 bandwidth - (simple, GCC, float, interl, blcd)
threads.
Similar to the memory bandwidth saturation case where the bandwidth to access main memory is shared among cores, here the bandwidth to access the L3 cache is shared. However, this time each chip has its individual L3 cache, so the bandwidth resource is only shared between all cores of one chip. We only care about accesses that are actually served with success by the L3, i.e. L3 hits. The first series of violins in Fig. 5 visualizes those for our experiment. We get the metric by subtracting L3 misses (LONGEST LAT CACHE.MISS) from all L3 references which include L2 misses as well as prefetches (LONGEST LAT CACHE.REFERENCES). Even though we see in the plot that the L3 hits increase with the thread count, for higher thread counts this increase is small.
We now want to study the penalty in time caused by each of the L3 hits, in other words, we are interested in how many clock cycles are needed for an individual data access that can be served by the L3. It is important to be aware that we are again talking about stall cycles and not the actual time to access the L3 cache. Out-of-order execution and other features can hide a part of the access time which is around 50-70 cycles for the L3 of the Skylake-server architecture [22] when the cache does not have to serve other requests in parallel. However, only when the core has to stall, the cycles are penalty time and not spend on useful work. We thus compute the stall cycles incurred by each L3 hit on average as
stallsL3 hit=
stallsL3 hits
L3 hits =
stallsL2 misses− stallsL3 misses
L3 references − L3 misses (3) which directly maps to hardware performance counters. Figure 5 also contains two series of violins showing this metric on average over cores, individually for each of the two chips. From 3 to 10 used cores of a chip, i.e. between 5 and 20 threads for chip 0 and between 6 and 21 threads for chip 1, we can see an almost constant penalty of around 10 stall cycles for each data access that hits in L3. Then, an increase can be seen which corresponds to the saturation in the speedup curve (Fig. 3), as the performance of each individual core decreases at this point. The stall cycles continue to increase further with additional added active cores - the bandwidth for L3 cache accesses reached its limit. We remark that these cycles also includes the latency of the chip’s mesh interconnect, i.e. the parallel accesses might saturate the interconnection network and not the actual L3 cache logic. However, in both cases, this is the maximal bandwidth available for accesses of CPU cores to the L3 cache.
4.3
Shared storage resource conflicts
By storage resources we mean all resources that can maintain state information over time and thus retain data. This is a clear contrast to the bandwidth resources of the previous section. In this work, we are mainly interested in on-chip storage resources since they likely introduce stronger interferences. The amount of storage is limited and in case of a resource shared between multiple cores they compete for the available capacity. Storing information of one core might thus need to evict data of another core. In general, a storage resource can be any component of the chip which keeps information over multiple CPU cycles, including load or store buffers, Translation Lookaside Buffers (TLBs) or even the state of a branch predictor. Here we only consider the most relevant case: caches, in particular the shared L3 of our system.
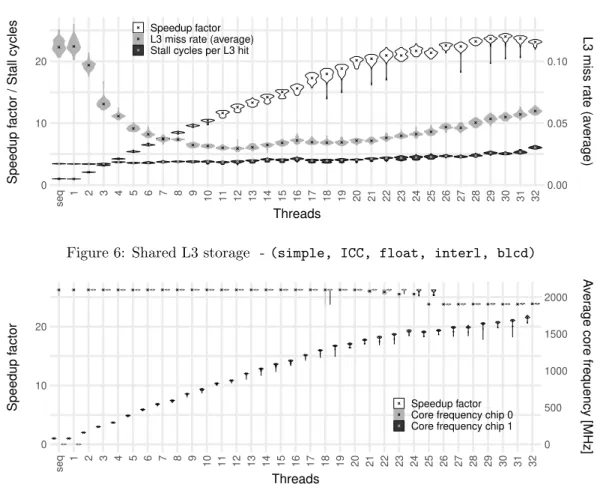
Figure 6 shows the scaling behavior of (simple, ICC, float, interl, blcd). It also includes a series of violins for the L3 miss rate in average over both CPU chips, obtained by the quotient between the LONGEST LAT CACHE.MISS and the LONGEST LAT CACHE.REFERENCES counters. The L3 miss rate first
0 10 20 0.00 0.05 0.10 seq 1 2 3 4 5 6 7 8 9 10 11 12 13 14 15 16 17 18 19 20 21 22 23 24 25 26 27 28 29 30 31 32 Threads Speedup f
actor / Stall cycles
L3 miss r
ate (a
ver
age)
Speedup factor L3 miss rate (average) Stall cycles per L3 hit
Figure 6: Shared L3 storage - (simple, ICC, float, interl, blcd)
0 10 20 0 500 1000 1500 2000 seq 1 2 3 4 5 6 7 8 9 10 11 12 13 14 15 16 17 18 19 20 21 22 23 24 25 26 27 28 29 30 31 32 Threads Speedup f actor A ver
age core frequency [MHz]
Speedup factor Core frequency chip 0 Core frequency chip 1
Figure 7: Shared power budget - (MKL, Clang, float, interl, blcd)
decreases until 12 threads. This is explained by the fact that using more cores also adds more cache in form of the private L2 caches of the additional cores, which cannot be used otherwise. For Skylake the L3 is non-inclusive and the L2 is quite large (1 MiB) compared to previous processor generations. Hence, the total available cache capacity increases significantly and larger parts of the working set can stay in the caches, such that the L3 miss rate decreases. We remark that this is particular to the used Dynamic Re-Reference Interval Prediction (DRRIP) cache replacement policy [23]. With classical LRU, no subset of the data could stay in the cache. The effect is especially relevant for small thread counts, as the relative capacity increase is larger.
For higher thread counts, on the other hand, the cores start competing for the L3 cache. We observe increases in the miss rate from 13 to 16 threads and again from 21 threads on. Latter is especially interesting: chip 0 has 11 used cores at this count and Skylake’s L3 cache is 11-way set associative. Consequently, for more than 11 used cores per chip, not all cores can place a distinct cache line in the same cache set at the same time. We can thus suspect that there is high interference on some of the cache sets, even though the overall L3 capacity might not be fully used. In other words, we likely observe many conflict misses caused by multiple cores sharing the common cache. Competition for the overall capacity of the L3 cache might also occur causing capacity misses, maybe even more common. In particular, cases where the threads work on distinct working sets, i.e. not on overlapping memory addresses, might experience such conflicts.
Further, the third series of violins in Figure 6 visualizes the stall cycles imposed by each memory access that hits in L3, as we define them in Eq. (3). The metric again increases for high thread counts, i.e. the application also reaches L3 bandwidth saturation in addition to the storage resource conflicts. Both those effects together cause the speedup curve not only to flatten but even to decrease for 31 and 32 used threads.
4.4
Shared power and temperature budget
In Fig. 7, we see a performance decrease for 25 threads compared to 24 threads for (MKL, Clang, float, interl, blcd). This is followed by a decreased slope of the speedup curve for higher thread counts. We
also plot the clock frequencies at which the cores run, on average over the whole experiment execution time and over all cores of a CPU chip. We observe that the frequency is stable at 2.1 GHz for low thread counts. It drops to 1.9 GHz when a chip reaches 13 used cores, i.e. at 25 threads for chip 0 and at 26 threads for chip 1. Note that for chip 0 there is an intermediate region and the decrease gradually starts already at 11 used cores. The performance per core decreases with the frequency which is the reason for the slowdown followed by a lowered slope.
Recall from Section 3.1 that we disabled Turbo Boost and P-states for our experiments. So why do we still observe different clock frequencies in Fig. 7? Let us therefore first outline the complex DVFS mechanisms which Intel uses in their modern processors to limit power consumption. Sleep states (C-states) allow idle cores to consume less power by turning off parts of the cores. In running mode, i.e. C0 state, a core can use different P-states (performance states), mapping to different operating frequencies and voltages. The CPU is designed to be able to maintain all these frequencies steadily on all cores. Turbo Boost (2.0) extends the performance levels above the nominal clock frequency. The CPU might not be able to keep those states over a long time and the concretely achievable frequency depends on the actual conditions, often referred to as dynamic overclocking. In order to avoid running into dynamic limits, the maximum frequency is further bound by two static factors: the number of active cores and the type of the executed workload (non-vector, AVX2, AVX-512), which Intel also calls license levels 0 to 2. Those frequency limits are documented in the processor’s specification [24].
With Turbo Boost deactivated, like in our experiments, the cores run at the base frequency. Our code makes heavy use of AVX-512 instructions, so it triggers Intel’s license level 2, meaning that very power-hungry instruction are executed. However, also in this mode, the base frequency of license level 0 (2.1 GHz) is used. It is higher than the guaranteed base frequency of AVX-512 (1.3 GHz). Limits thus apply and in the processor’s specification, we see that for more than 12 active cores the maximum AVX-512 frequency (1.9 GHz) is lower than the used base frequency, independent of any actual conditions. This corresponds exactly to our observed frequency steps. We can interpret this as Turbo Boost not being completely disabled, or as vector instructions causing downclocking of the cores.
The frequency of chip 0 starts decreasing already at 11 used cores because the OS is scheduling other processes than our test application, which use one or two additional cores. Those are remaining kernel processes which need to be executed even though we reduced the number of background services. They do not consume a relevant amount of CPU time but are enough to trigger sleeping cores to wake-up to the active state which then causes the interference with our application due to the chip’s power management. If we are close to the boundary of 13 active cores, all our cores have to reduce their frequency during those times in which the additional cores are active. On average over the whole experiment execution time, our cores use an intermediate frequency. The same happens for the frequency outliers we see for 18 threads in Fig. 7, here during the full time of some experiment executions additional cores are kept active. If we had enabled Turbo Boost in our experiments, even more frequency steps would be present in a huge range from 3.5 GHz to 1.9 GHz. Many more slowdowns or at least worse scaling behaviors could be seen.
As with the end of Dennard scaling the power wall gets more and more dominant in chip design [25], Intel extends the DVFS features in each chip generation. Power and thermal management, which are closely related as heat dissipation is only the cause of power consumption, thus have an increasing impact on performance. In multicore processors, the individual cores are not independent but coupled through the chip’s total budget. Cores compete for this resource - a high consumption on one core introduces interference on others. We can consequently see the power and temperature budget of the chip as a shared resource, whose consumption is controlled through dynamic clock frequency selection.
5
Conclusion and future work
We present and analyze many cases from our experimental data where microarchitectural effects directly limit scalability. A work distribution which is unbalanced with respect to the physical hardware organi-zation, e.g. in two separate CPU chips, can be seen in the CPU usage, as some threads finish computing early. However, shared resource effects happen invisibly in the microarchitecture and a high CPU usage is reported. To the OS and the user, it seems that the hardware is perfectly used, despite the fact that cores actually spend most of their time waiting in stall cycles. It is thus crucial to know and understand these effects. Our contributions and insights of this paper are summarized as follows:
We present an empirical study of resource sharing effects, on a modern multicore system with high core count.
We show that on multicore systems various microarchitectural effects can dominate the scalability behavior. This is a clear contrast to existing literature which identifies memory bandwidth as the sole important performance limiting factor.
We provide an overview of performance limits due to shared resources and showcase their behavior. This shall help researchers to identify and to avoid them.
We identify three important categories of resources: bandwidth resources, storage resources as well as a shared power and temperature budget.
Even though we try to isolate the different effects to study them individually, we also show that in many cases two or more resource sharing effects appear together (e.g. L3 bandwidth saturation and storage conflicts). Interestingly, their combined impact can even lead to decreasing performance when increasing the number of used cores.
We propose to view the power and temperature budget as a shared resource for which the cores of a multicore chip compete.
As chips are hitting the power wall, the sharing of a power and temperature budget is increasingly important, leading to strategies like Turbo Boost to control its use. The marketing name suggests that performance is increased compared to the baseline, in the case when only a few cores are active. This leads to the common interpretation that such technologies can accelerate sequential code parts and mitigate Amdahl’s law to some extent [26, 27]. However, all cores are full-fledged cores, i.e. each core contains exactly the same hardware resources and can run at the same maximum frequency. Cores only have to limit their frequency when other cores interfere and also consume power. This situation is similar to e.g. a shared memory bandwidth: a single active core can use all the resource by itself whereas during parallel execution it has to share, probably causing slower execution. Hence we argue to see Turbo Boost the same way, i.e. as reducing performance in the parallel case. Obviously, this does not mean it lowers the chip’s maximum achievable performance. Without such a technology, fewer cores could be integrated in a chip as the overall budget is a fixed design constraint.
The general principle of co-scheduling solutions is to schedule processes together that complement each other in their resource usage, i.e. applications causing high contention on a resource together with processes using this resource only rarely. In this paper, we analyze shared resources in a system with modern CMPs with high core counts. Contrary to the findings of published co-scheduling works, we observe that contention for many other resources than the memory bandwidth can represent important performance-limiting factors. Our insights can be used to improve the heuristics of co-scheduling ap-proaches: (1) The heuristics should not solely focus on bandwidth resources anymore, but also take into account the other two classes of shared resources which we identified to be important for multicore chips. This is straightforward to do for storage resources. (2) The influence of the power budget could be estimated in a fashion similar to the static clock frequency limits which Intel processors use as a control mechanism, i.e. based on how many cores execute which types of instructions. This does not account for the dynamic behavior but should lead to a good first bound. (3) The heuristics need to consider the physical placement of cores. Existing approaches already do so to optimize for NUMA latencies and to maximize the bandwidth to caches shared by a subset of cores. However, the competition for the available space of storage resources is not treated. Furthermore, which processes have to share the common temperature and power budget of a multicore chip depends on the placement on physical cores chosen by the scheduler.
Independent of these co-scheduling improvements, it remains open to show the importance of the reported microarchitectural effects for complex real-world applications instead of a single compute kernel, as well as to conduct experiments with more common hardware configurations, i.e. with Turbo Boost and SMT enabled. It should be further investigated how a parallel compiler can make use of our results to improve parallel performance.
References
[1] Andreas Abel, Florian Benz, Johannes Doerfert, Barbara D¨orr, Sebastian Hahn, Florian Hau-penthal, Michael Jacobs, Amir H Moin, Jan Reineke, Bernhard Schommer, and Reinhard Wilhelm. Impact of resource sharing on performance and performance prediction: A survey. In Proceedings of the 24th international conference on Concurrency Theory, pages 25–43. Springer, 2013.
[2] Gene M Amdahl. Validity of the single processor approach to achieving large scale computing capabilities. In Proceedings of the April 18-20, 1967, Spring Joint Computer Conference, pages 483–485. ACM, 1967.
[3] Mark D Hill and Michael R Marty. Amdahl’s law in the multicore era. Computer, 41(7):33–38, 2008.
[4] Leonid Yavits, Amir Morad, and Ran Ginosar. The effect of communication and synchronization on Amdahl’s law in multicore systems. Parallel Computing, 40(1):1–16, 2014.
[5] Neil J Gunther, Shanti Subramanyam, and Stefan Parvu. A Methodology for Optimizing Multi-threaded System Scalability on Multicores. In Sabri Pllana and Fatos Xhafa, editors, Programming Multicore and Many-core Computing Systems, pages 363–384. John Wiley and Sons Inc., 2017. [6] Sasko Ristov and Marjan Gusev. Superlinear speedup for matrix multiplication. In Proceedings
of the 34th International Conference on Information Technology Interfaces, pages 499–504. IEEE, 2012.
[7] Simon Hammond, Courtenay Vaughan, and Clay Hughes. Evaluating the Intel Skylake Xeon pro-cessor for HPC workloads. In 2018 International Conference on High Perf. Comp. & Simulation (HPCS), pages 342–349. IEEE, 2018.
[8] Keryan Didier, Dumitru Potop-Butucaru, Guillaume Iooss, Albert Cohen, Jean Souyris, Philippe Baufreton, and Amaury Graillat. Correct-by-Construction Parallelization of Hard Real-Time Avion-ics Applications on Off-the-Shelf Predictable Hardware. ACM Trans. Archit. Code Optim., 16(3), July 2019.
[9] Reinhard Wilhelm, Daniel Grund, Jan Reineke, Marc Schlickling, Markus Pister, and Christian Ferdinand. Memory hierarchies, pipelines, and buses for future architectures in time-critical em-bedded systems. IEEE Transactions on Computer-Aided Design of Integrated Circuits and Systems, 28(7):966–978, 2009.
[10] Thomas Lundqvist and Per Stenstrom. Timing anomalies in dynamically scheduled microprocessors. In Proceedings of the 20th IEEE Real-Time Systems Symposium, pages 12–21. IEEE, 1999. [11] Rodolfo Pellizzoni, Andreas Schranzhofer, Jian-Jia Chen, Marco Caccamo, and Lothar Thiele.
Worst case delay analysis for memory interference in multicore systems. In 2010 Design, Au-tomation & Test in Europe Conference & Exhibition (DATE 2010), pages 741–746. IEEE, 2010. [12] Andreas Schranzhofer, Jian-Jia Chen, and Lothar Thiele. Timing analysis for TDMA arbitration
in resource sharing systems. In 16th IEEE Real-Time and Embedded Technology and Applications Symposium, pages 215–224. IEEE, 2010.
[13] Christos D. Antonopoulos, Dimitrios S. Nikolopoulos, and Theodore S. Papatheodorou. Realistic Workload Scheduling Policies for Taming the Memory Bandwidth Bottleneck of SMPs. In Pro-ceedings of the 11th International Conference on High Performance Computing, HiPC’04, pages 286–296, Berlin, Heidelberg, 2004. Springer.
[14] R. Knauerhase, P. Brett, B. Hohlt, T. Li, and S. Hahn. Using OS Observations to Improve Perfor-mance in Multicore Systems. IEEE Micro, 28(3):54–66, 2008.
[15] Sergey Zhuravlev, Sergey Blagodurov, and Alexandra Fedorova. Addressing Shared Resource Contention in Multicore Processors via Scheduling. SIGARCH Computer Architecture News, 38(1):129–142, 2010.
[16] Major Bhadauria and Sally A McKee. An approach to resource-aware co-scheduling for CMPs. In Proceedings of the 24th ACM International Conference on Supercomputing, pages 189–199. ACM, 2010.
[17] Hiroshi Sasaki, Teruo Tanimoto, Koji Inoue, and Hiroshi Nakamura. Scalability-Based Manycore Partitioning. In Proceedings of the 21st International Conference on Parallel Architectures and Compilation Techniques, PACT ’12, page 107–116, New York, USA, 2012. ACM.
[18] Sergey Blagodurov, Sergey Zhuravlev, Mohammad Dashti, and Alexandra Fedorova. A Case for NUMA-Aware Contention Management on Multicore Systems. In Proceedings of the 2011 USENIX Conference on USENIX Annual Technical Conference, USENIXATC’11, USA, 2011. USENIX As-sociation.
[19] Carsten Bruns and Sid Touati. Empirical study of Amdahl’s law on multicore processors. Re-search Report RR-9311, INRIA Sophia-Antipolis M´editerran´ee ; Universit´e Cˆote d’Azur, CNRS, I3S, France, Dec 2019.
[20] Abdelhafid Mazouz, Denis Barthou, et al. Study of variations of native program execution times on multi-core architectures. In 2010 International Conference on Complex, Intelligent and Software Intensive Systems, pages 919–924. IEEE, 2010.
[21] Abdelhafid Mazouz, Sid Touati, and Denis Barthou. Analysing the variability of OpenMP pro-grams performances on multicore architectures. In Fourth workshop on programmability issues for heterogeneous multicores (MULTIPROG-2011), 2011.
[22] Intel Corporation. Intel® 64 and IA-32 Architectures Optimization Reference Manual, September 2019. Order Number: 248966-042b.
[23] Aamer Jaleel, Kevin B Theobald, Simon C Steely Jr, and Joel Emer. High performance cache replacement using re-reference interval prediction (RRIP). ACM SIGARCH Computer Archit. News, 38(3):60–71, 2010.
[24] Intel Corporation. Intel® Xeon® Processor Scalable Family Specification Update, September 2019. Reference Number: 336065-010US.
[25] David A Patterson and John L Hennessy. Computer Organization and Design MIPS Edition: The Hardware/Software Interface. Newnes, 2013. ISBN-13: 978-0124077263.
[26] James Charles, Preet Jassi, Narayan S Ananth, Abbas Sadat, and Alexandra Fedorova. Evaluation of the Intel® Core i7 Turbo Boost feature. In 2009 IEEE International Symposium on Workload Characterization (IISWC), pages 188–197. IEEE, 2009.
[27] Murali Annavaram, Ed Grochowski, and John Shen. Mitigating Amdahl’s law through EPI throt-tling. ACM SIGARCH Computer Architecture News, 33(2):298–309, 2005.