HAL Id: hal-02538367
https://hal.archives-ouvertes.fr/hal-02538367
Submitted on 9 Apr 2020
HAL is a multi-disciplinary open access
archive for the deposit and dissemination of
sci-entific research documents, whether they are
pub-lished or not. The documents may come from
teaching and research institutions in France or
abroad, or from public or private research centers.
L’archive ouverte pluridisciplinaire HAL, est
destinée au dépôt et à la diffusion de documents
scientifiques de niveau recherche, publiés ou non,
émanant des établissements d’enseignement et de
recherche français ou étrangers, des laboratoires
publics ou privés.
Automatic detection of individual and touching moths
from trap images by combining contour-based and
region-based segmentation
Mohamed Chafik Bakkay, Sylvie Chambon, Hatem A. Rashwan, Christian
Lubat, Sébastien Barsotti
To cite this version:
Mohamed Chafik Bakkay, Sylvie Chambon, Hatem A. Rashwan, Christian Lubat, Sébastien Barsotti.
Automatic detection of individual and touching moths from trap images by combining contour-based
and region-based segmentation. IET Computer Vision, IET, 2018, 12 (2), pp.138-145.
�10.1049/iet-cvi.2017.0086�. �hal-02538367�
OATAO is an open access repository that collects the work of Toulouse
researchers and makes it freely available over the web where possible
Any correspondence concerning this service should be sent
to the repository administrator:
tech-oatao@listes-diff.inp-toulouse.fr
This is an author’s version published in:
http://oatao.univ-toulouse.fr/2
2262
To cite this version:
Bakkay, Mohamed Chafik
and Chambon, Sylvie
and Rashwan, Hatem A.
and Lubat, Christian and Barsotti, Sébastien Automatic detection of individual and
touching moths from trap images by combining contour-based and region-based
segmentation.
(2018) IET Computer Vision, 12 (2). 138-145. ISSN 1751-9632.
Official URL:
https://doi.org/10.1049/iet-cvi.2017.0086
this method needs multiple images taken at different times per day and a background model in order to separate touching insects.
2.3 Discussion
In conclusion of this review, it seems that most of the existing approaches are incomplete, since they take into account only one aspect of the problem (the colour or the shape, the contour or the region). In consequence, they fail to take into account some difficulties like the presence of touching insects. In addition, even the most recent hybrid approaches introduce many parameters not easy to choose. Consequently, our idea is to combine contour-based and region-based segmentation approaches to keep the details of insects, in addition to be able to separate touching insects. Thus, an automated segmentation method is proposed that can be enough reliable to initialise candidates for insect identification. Moreover, we want to introduce an approach with less parameters as possible and easy to choose, i.e. the choice of these parameters do not dramatically influence the quality of the results.
3 Proposed approach
3.1 Overview
The proposed method allows the detection of individual and touching insects in images of a trap, that contain many difficulties (noises and elements that are not insects), as presented in Fig. 1, by combining contour-based and region-based segmentation approaches. The method takes as an input a trap image and it returns as an output the localisation of each insect (i.e. a bounding box of each detected insect).
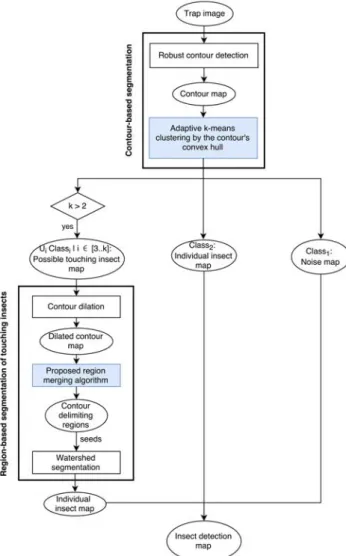
Fig. 2 shows the schematic overview of the proposed method. First of all, we apply a robust contour detection that we previously published in [10] to detect the different contours in the input image. Then, we apply a k-means algorithm to classify the previous estimated contours into different categories. On this step, our main contribution is to introduce an adapted criterion: the shape of the surface included in a closed contour. In fact, the shape is a significant characteristic to separate the different kinds of elements in the scene, i.e. it helps to distinguish between contours due to noises (class 1), contours related to individual insects (class 2) and contours that contain touching insects (class 3 to k). Moreover, in comparison to the state-of-the-art methods, in this approach, the number of classes is automatically selected by using the Elbow method [35]. After this automated clustering step, the next task attempts to separate the obtained possible touching insects by applying a region-based segmentation. The idea is to use the contours classified into class 3 to k that delimit regions as seeds for the watershed algorithm [36]. This region-based segmentation part contains three ordered steps: the contour dilation, the region
merging algorithm and the watershed segmentation. After these
three steps, two results are possible:
i. The watershed algorithm detects two or more regions inside the contour, thus touching insects will be separated to two or more insects.
ii. The algorithm detects only one big region and the shape of this insect is just refined.
The details and the justifications of each step of the proposed scheme are given in the following subsections.
3.2 Robust contour detection (first step of the contour-based segmentation)
In the literature, many contour detectors have been introduced and the most famous one is Canny operator [1]. More recently, in [10] the interest of using curvature has been highlighted, since it detects what we have named ‘curvilinear structures’ that generate a single response for both lines and edges. Moreover, in [10], we have shown that using curvature allows to deal with noises. For these reasons, we use this detector in this work. In details, since the principal curvatures of a curve at a given point can be approximated by the eigenvalues of the Hessian matrix, the Hessian matrix can be used for estimating these principal curvatures. Then, we compute the difference between these principal curvatures (i.e. eigenvalues) and we suppose that the higher the difference, the most interesting the point, i.e. the point is related to an edge or a line. This computation is done in multi-scale in order to detect both important structures and small details. We have to choose the number of scales, NS, and the choice for this
parameter are given in Section 4.2. Finally, the curves are given by selecting the local maxima in scale space. An example of these estimated curves is shown in Fig. 3. More details of the approach can be found in the complete description in [10].
3.3 Adaptive k-means clustering (second step of the contour-based segmentation)
In this paper, we propose to use the contour's convex hull, noted ℋ, as a criterion for estimating the clustering. To illustrate the interest of this criterion, we introduce it in a k-means method
Fig. 2 Proposed method – we distinguish the manipulated data (inside ellipses) from the actions (inside rectangles). The main contributions of the paper correspond to blue rectangles
Fig. 3 Contour detection
individual insects. If we keep these small regions as seeds, the watershed algorithm will over-segment the insects in these regions. Thus, these regions must be merged with the bigger regions to avoid over-segmentation. This is the goal of the next step of the algorithm.
3.4.3 Proposed region merging algorithm: The proposed region
merging algorithm, see Algorithm 1 (in Fig. 6), iteratively merges small regions ri, inside each dilated contour c belonging to the set
of estimated contours C, with the nearest region rn inside the same contour. Merging two regions consists of linking them by the shortest segment l between them. This segment has at least one pixel of thickness. An important fact is that the algorithm must avoid to merge big regions together (to keep insects separated) and must avoid to open the closed contours. Thus, the step of merging is repeated until no small regions, which can be merged, are found. In this way, small regions will grow progressively until they reach a maximum size, i.e. A(ri) ≤ T × ℋ(c)), where A(ri) means the area of ri and T is a threshold that is empirically selected, see
Section 4.2 to illustrate the influence of this parameter. This condition avoids the algorithm to merge big regions. In Fig. 5b, we can see that the estimated contour contains some discontinuities, see for example the wings of the fly. After the dilation (see Fig. 5c), the contours are closed but some small regions still remain, like the region of the legs of the fly. However, after the merging step, as expected, we can notice that the small regions are merged with the biggest nearest regions, see, for example, the white path between the legs and the core of the fly, while the two insects are not merged together.
3.4.4 Watershed algorithm: Finally, after merging the small
regions, the watershed algorithm [36] is applied with these merged regions as seeds in order to obtain an accurate segmentation, i.e. an accurate separation of insects. The result given in Fig. 5d highlights the quality of the results that we have obtained in general on all the tested images.
4 Experimentation
For all the results presenting in this section, we use these coding colours:
• Green rectangles are insects.
• Blue rectangles indicate noises (herbs, small insects, reflections).
• Red rectangles correspond to touching insects.
4.1 Illustration of the behaviour of Elbow algorithm
In Fig. 4, we present the results of the Elbow algorithm for two different images, and with two values of k. More precisely, for the first image, in Figs. 4a and b, the Elbow is reached for k = 2 whereas, for the second one, in Figs. 4c and d, it is reached for k = 3. These examples illustrate how it is important to use an adaptive number of classes and the interest of using the Elbow algorithm.
4.2 Parameter study
In the proposed algorithm, we have to choose these parameters: • NS: the number of scales used for the contour detection;
• S: the threshold used for the dilation step; • T: the threshold used for the merging step.
For the contour detection algorithm [10], four scale levels are used for NS, it is a choice coherent with the recommendations made in
the paper. For the two other parameters, a value has been chosen empirically by analysing the graphs presented in Fig. 7. More precisely, to choose the values of S and T, we have used what we call the segmentation rate of touching insects which is equal to the number of segmented insects divided by the number of original insects (ground truth). When, this rate is above 1, it means that the image is over-segmented, whereas when it is under 1, the image is under-segmented. Hence, ideally, it has to be equal to 1, and, in this configuration, it means that the number of segmented insects is equals to the number of original insects. In consequence, in the graph, we have to choose the point of intersection of any curve with the black line (that corresponds to the segmentation rate of touching insects equals to 1) to avoid under- and over-segmentations while minimising the dilation (i.e. minimising the computational cost). For each curve presented in Fig. 7, T has a fixed value whereas S varies from 50 to 100% of the contour's convex hull. We show the curves for four different values of T between 0.02 and 0.15. Finally, the graphs highlight that the best choice, i.e. the choice that allows to obtain a segmentation rate of touching insects equals to 1, is S = 80% of the contour's convex hull and T = 0.1. Consequently, we define small regions as regions that have at least 10% of the contour's convex hull.
4.3 Real dataset
We have collected a big number of insect images (almost 100 images with an average of 30 insects per image; see Figs. 8a and
b). These images are collected using moth traps designed by
SiConsult, one of the companies involved in the project (see acknowledgment for the details). In these images, there are many insects of varying types and sizes and they are captured under different illumination conditions. These images contain different noises or elements that can induce false detections, like the pheromone cap (see Figs. 8b). As shown, most individual insects are detected by the proposed method. In addition, the proposed method separates touching insects in most of the cases. As well, it avoids over-segmentation of big insects (see Figs. 8a). However, in some images, such as the image shown in Figs. 8b, the big insects are over-segmented. Since some big insects have different parts (like big wings, or thin long paws), the watershed algorithm considers them as overlapping insects. However, we can imagine that the recognition step will not recognise these parts of insects as the insect we want to recognise because the shape is too different.
Fig. 6 Algorithm 1 proposed region merging algorithm
Fig. 7 Parameter study using 20 images containing 58 groups of touching insects. We show how S and T have to be fixed in order to have a segmentation rate of touching insects equals to 1. All the definitions and explanations about S, T and this rate are given in Section 4.2
7 References
[1] Canny, J : ‘A computational approach to edge detection’, IEEE Trans. Pattern
Anal. Mach. Intell., 1986, 8, (6), pp 679–698
[2] Deriche, R : ‘Using Canny's criteria to derive a recursively implemented optimal edge detector’, Int. J. Comput. Vis., 1987, 1, (2), pp 167–187 [3] Kass, M , Witkin, A , Terzopoulos, D : ‘Snakes: active contour models’, Int. J.
Comput. Vis., 1988, 1, (4), pp 321–331
[4] Wagstaff, K , Cardie, C , Rogers, S , et al.: ‘Constrained k-means clustering with background knowledge’ Int Conf on Machine Learning, 2001, pp 577–584
[5] Comaniciu, D , Meer, P : ‘Mean shift: a robust approach toward feature space analysis’, IEEE Trans. Pattern Anal. Mach. Intell., 2002, 24, (5), pp 603–619 [6] Lowe, D : ‘Distinctive image features from scale-invariant keypoints’, Int. J.
Comput. Vis., 2004, 60, (2), pp 91–110
[7] Deschamps, T , Cohen, L : ‘Fast extraction of minimal paths in 3D images and applications to virtual endoscopy’, Med. Image Anal., 2001, 5, (4), pp 281–299
[8] Chen, X M , Geng, G H , Zhou, M Q , et al.: ‘Applying expectation-maximization in insect image segmentation using multi-features’, Comput.
Appl. Softw., 2009, 26, (2), pp 20–22
[9] Schurischuster, S , Zambanini, S , Kampel, M , et al.: ‘Sensor study for monitoring varroa mites on honey bees (apis mellifera)’ Visual Observation and Analysis of Vertebrate and Insect Behavior Workshop, 2016
[10] Rashwan, H A , Chambon, S , Gurdjos, P , et al.: ‘Towards multi-scale feature detection repeatable over intensity and depth images’ IEEE Int Conf on Image Processing, 2016, pp 36–40
[11] Wen, C , Wu, D , Hu, H , et al.: ‘Pose estimation-dependent identification method for field moth images using deep learning architecture’, Biosyst. Eng., 2015, 136, pp 117–128
[12] Larios, N , Soran, B , Shapiro, L G , et al.: ‘Haar random forest features and SVM spatial matching kernel for stonefly species identification’ IEEE Int Conf on Pattern Recognition, 2010, pp 2624–2627
[13] Wang, J , Lin, C , Ji, L , et al.: ‘A new automatic identification system of insect images at the order level’, Knowl.-Based Syst., 2012, 33, pp 102–110 [14] Wen, C , Guyer, D E , Li, W : ‘Local feature-based identification and
classification for orchard insects’, Biosyst. Eng., 2009, 104, (3), pp 299–307 [15] Fedor, P , Malenovský, I , Vanhara, J , et al.: ‘Thrips (thysanoptera)
identification using artificial neural networks’, Bull. Entomol. Res., 2008, 98, (5), pp 437–447
[16] Kaya, Y , Kayci, L : ‘Application of artificial neural network for automatic detection of butterfly species using color and texture features’, Vis. Comput., 2014, 30, (1), pp 71–79
[17] Li, X L , Huang, S G , Zhou, M Q , et al.: ‘KNN-spectral regression LDA for insect recognition’ Int Conf on Information Science and Engineering, 2009, pp 1315–1318
[18] Wen, C , Guyer, D : ‘Image-based orchard insect automated identification and classification method’, Comput. Electron. Agric., 2012, 89, pp 110–115 [19] Ding, W , Taylor, G W : ‘Automatic moth detection from trap images for pest
management’, Comput. Electron. Agric., 2016, 123, (C), pp 17–28 [20] Vincent, L , Soille, P : ‘Watersheds in digital spaces: an efficient algorithm
based on immersion simulations’, IEEE Trans. Pattern Anal. Mach. Intell., 1991, 13, (6), pp 583–598
[21] Achanta, R , Shaji, A , Smith, K , et al.: ‘SLIC superpixels compared to state-of-the-art superpixel methods’, IEEE Trans. Pattern Anal. Mach. Intell., 2012,
34, (11), pp 2274–2282
[22] Blasco, J , Gómez-Sanchís, J , Gutierrez, A , et al.: ‘Automatic sex detection of individuals of ceratitis capitata by means of computer vision in a biofactory’, Pest Manage. Sci., 2009, 65, (1), pp 99–104
[23] Zhang, H T , Hu, Y D , Qiu, D Y : ‘The stored-grain pest image segmentation algorithm based on the relative entropy threshold’, J. North China Inst. Water
Conservancy Hydroelectr. Power, 2003, 24, (3), pp 27–29
[24] Luo, T -H : ‘Investigation on image threshold segmentation method of pests in stored grain’, J. Wuhan Polytech. Univ., 2006, 25, (1), pp 5–8
[25] Xinwen, Y , Zuorui, S : ‘Segmentation technology for digital image of insects’, Trans. Chin. Soc. Agric. Eng., 2001, 17, (3), pp 137–141
[26] Prakash, J , Vijayakumar, V : ‘A new texture based segmentation method to extract object from background’, Glob. J. Comput. Sci. Technol. Graph. Vis., 2012, 12, (15), pp 47–53
[27] Yuehua, C , Xiaoguang, H , Changli, Z : ‘Algorithm for segmentation of insect pest images from wheat leaves based on machine vision’, Trans. Chin.
Soc. Agric. Eng., 2007, 23, (12), pp 187–191
[28] Zhao, J , Liu, M , Yao, M : ‘Study on image recognition of insect pest of sugarcane cotton aphis based on rough set and fuzzy c-means clustering’ IEEE Int Symp on Intelligent Information Technology Application, 2009, vol 2, pp 553–555
[29] Yogamangalam, R , Karthikeyan, B : ‘Segmentation techniques comparison in image processing’, Int. J. Eng. Technol., 2013, 5, (1), pp 307–313
[30] Ramesh, R , Kulkarni, A C , Prasad, N R , et al.: ‘Face recognition using snakes algorithm and skin detection based face localization’ Int Conf on Signal, Networks, Computing, and Systems, 2016, pp 61–71
[31] Wang, Y , Peng, Y : ‘Application of watershed algorithm in image of food insects’, J. Shandong Univ. Sci. Technol., Nat. Sci., 2007, 26, (2), pp 79–82 [32] Zhang, W F , Guo, M : ‘Stored grain insect image segmentation method based
on graph cuts’, Sci. Technol. Eng., 2010, 7, pp 1661–1664
[33] Mele, K : ‘Insect soup challenge: segmentation, counting, and simple classification’ IEEE Int Conf on Computer Vision Workshops, 2013, pp 168–171
[34] Yalcin, H : ‘Vision based automatic inspection of insects in pheromone traps’ IEEE Int Conf on Agro-Geoinformatics, 2015, pp 333–338
[35] Tibshirani, R , Walther, G , Hastie, T : ‘Estimating the number of clusters in a data set via the gap statistic’, J. R. Stat. Soc., Ser. B (Stat. Methodol.), 2001,
63, (2), pp 411–423
[36] Meyer, F : ‘Color image segmentation’ IET Int Conf on Image Processing and its Applications, 1992, pp 303–306
[37] Yao, Q , Liu, Q , Dietterich, T G , et al.: ‘Segmentation of touching insects based on optical flow and Ncuts’, Biosyst. Eng., 2013, 114, (2), pp 67–77 [38] Wang, Y , Weng, G : ‘The monitoring population density of pests based on
edge-enhancing diffusion filtering and image processing’ Int Conf on Computer and Computing Technologies in Agriculture, 2007, pp 899–907 [39] Stehman, S V : ‘Selecting and interpreting measures of thematic classification