HAL Id: hal-01457249
https://hal-amu.archives-ouvertes.fr/hal-01457249
Submitted on 6 Feb 2017
HAL is a multi-disciplinary open access
archive for the deposit and dissemination of
sci-entific research documents, whether they are
pub-lished or not. The documents may come from
teaching and research institutions in France or
abroad, or from public or private research centers.
L’archive ouverte pluridisciplinaire HAL, est
destinée au dépôt et à la diffusion de documents
scientifiques de niveau recherche, publiés ou non,
émanant des établissements d’enseignement et de
recherche français ou étrangers, des laboratoires
publics ou privés.
Reply to comment by Rashid et al. on ”Asynchronous
variation in the East Asian winter monsoon during the
Holocene”
Liya Jin, Xiaojian Zhang, Guillaume Leduc
To cite this version:
Liya Jin, Xiaojian Zhang, Guillaume Leduc. Reply to comment by Rashid et al. on ”Asynchronous
variation in the East Asian winter monsoon during the Holocene”. Journal of Geophysical Research:
Atmospheres, American Geophysical Union, 2016, 121, pp.1615 - 1620. �10.1002/2015JD024270�.
�hal-01457249�
Reply to comment by Rashid et al. on
“Asynchronous
variation in the East Asian winter monsoon
during the Holocene
”
Liya Jin1, Xiaojian Zhang1, and Guillaume Leduc2 1
Key Laboratory of Western China’s Environmental Systems (Ministry of Education), College of Earth and Environmental Sciences, Lanzhou University, Lanzhou, China,2CEREGE UM34, Aix-Marseille Université, CNRS, Europôle Méditerranéen
de L’Arbois, Aix en Provence, France
Abstract
Rashid et al. (2016) questioned the use of the Mg-/Ca-based sea surface temperature (SST) data from the subpolar North Atlantic Ocean as well as the alkenone-based SST data from the western tropical Indian Ocean we used to reflect the winter SSTs or regional changes in the Holocene SSTs. We first would like to reemphasize that the main message we wanted to convey in our article is that the East Asian winter monsoon (EAWM) strength decreased and then increased again during the Holocene but with a substantial lag in southern China as compared to northern China. We, of course, wanted to back up our model results with published SST data that may have detected such an asynchronous variation in the EAWM. For convenience, we used a series of proxy records extracted from the extended Global database for alkenone-derived HOlocene Sea-surface Temperature (GHOST) database that were initially intended to provide a template of Holocene SST trends for model/data comparison purpose (http://doi.pangaea.de/10.1594/PANGAEA.737370). Rashid et al. (2016) questioned our model/data comparison exercise, arguing that the data we present in Zhang et al. (2015a) cannot be used to track leads and lags in winter SSTs in the North Atlantic and northern Indian Ocean. Below we address point by point the issues raised by Rashid et al. (2016) and thank the authors for giving us the opportunity to sharpen our model/data comparison analysis.1. SST of the Subpolar North Atlantic Ocean
Thefirst point raised by Rashid et al. [2016] concerns a series of proxy SST data from the northwestern Atlantic Ocean core OCE326-26GGC that was used to indicate middle latitude North Atlantic boreal winter SST variations during the Holocene, especially for the rising trend in SSTs between 4.5 ka and 2 ka [Zhang et al., 2015a, Figure 11b3], which is just the curve of the Mg-/Ca-based SST from the planktonic foraminifera Globigerina bulloides from the Laurentian Fan core OCE326-26GGC [Keigwin et al., 2005, Figure 5b]. This curve is referred to as Figure 1b2 in Rashid et al. [2016]. After having carefully checked the data and curves in our paper [Zhang et al., 2015a], we realized that the citation of Sachs [2007] for the Mg-/Ca-derived SST from the core OCE326-26GGC is a misuse of Keigwin et al. [2005], and we thank Rashid et al. [2016] for reporting us this mistake.
Then, Rashid et al. [2016] question our interpretation of the Laurentian Fan core OCE326-26GGC SST results in terms of seasonality and depth habitat. We acknowledge that seasonality and depth habitat in this region and elsewhere is a long-standing debate so that different interpretations and opinions may vary among different authors [see, e.g., Hillaire-Marcel and de Vernal, 2008]. As mentioned by Rashid et al. [2016], G. bulloides seasonality may vary upon latitudes and cite, in particular, the study by Tolderlund and Bé [1971]. This paper reports seasonalfluxes of G. bulloides being maximum during summer at two stations located at ~56° and 53°N, and during winter at three stations located at ~44°, 35°, and 32°N in the northwestern Atlantic [see Tolderlund and Bé, 1971, Figure 5]. Core OCE326-26GGC being located at 43°N, the study by Tolderlund and Bé [1971], tends to confirm our interpretation of OCE326-26GGC core in terms of winter SST.
Rashid et al. [2016] then turn to core MD99-2251, that was recovered further to the north and hence may be located in a region where G. bulloides is more sensitive to summer temperatures [Tolderlund and Bé, 1971]. We, however, did not discuss this record in length since, as we quoted,“The core however was collected from an area at the boundary of negative anomalies identified in the KCM simulated SST EOF1 component (Figure 11a)” [Zhang et al., 2015a]. However, Rashid et al. [2016] finish their comment on core MD99-2251 by comparing its Mg/Ca signal to the one published in Berner et al. [2008] that represent August SSTs and point out that the data“do not show any rising trend in SSTs at 4.5 ka either” [Rashid et al., 2016].
Journal of Geophysical Research: Atmospheres
REPLY
10.1002/2015JD024270
This article is a reply to comment by Rashid et al. [2016] doi:10.1002/ 2015JD023983.
Key Point:
• Reply to Rashid et al. [2016] about the winter SSTs in the North Atlantic and northern Indian Ocean
Correspondence to:
L. Jin, jinly@lzu.edu.cn
Citation:
Jin, L., X. Zhang, and G. Leduc (2016), Reply to comment by Rashid et al. on “Asynchronous variation in the East Asian winter monsoon during the Holocene”, J. Geophys. Res. Atmos., 121, 1615–1620, doi:10.1002/2015JD024270.
Received 24 SEP 2015 Accepted 7 JAN 2016
Accepted article online 11 JAN 2016 Published online 16 FEB 2016
©2016. American Geophysical Union. All Rights Reserved.
Although Rashid et al. [2016] do not develop further this remark, we find it encouraging that August SST does not resemble to the MD99-2251 Mg/Ca sig-nal that we initially suggested as being reflective of winter temperature. In addition, we would like to perform further comparisons between model results and proxy records to confirm our results as model-data comparisons can reduce the seasonal bias in proxy records [Schneider et al., 2010; Lohmann et al., 2013]. Mg/Ca records generally reveal warming trends in the subtropical and subpolar North Atlantic (north of 30°N) except the eastern part of the subtropical North Atlantic during the Holocene (Figure 1, Table 1), whichfit well with modeled winter and spring SSTs (Figures 2a and 2b) but differ somewhat from summer SSTs [Zhang et al., 2015b] as estimated in the Kiel Climate Model (KCM) Holocene transient simulation (HT) simulation [Jin et al., 2014]. The warming trends in the subtropical and subpolar North Atlantic (north of 30°N) can be attributed to the increasing winter insolation (Figure 3) [Liu et al., 2003; Came et al., 2007; Leduc et al., 2010]. North Atlantic SSTs tend to extend their memories from winter to spring as shown in Figure 2c showing high correlations between winter and spring SSTs on interannual to interdecadal timescales even when the linear trends (insola-tion forcing) were removed (Figure 2d), generating similar modes in the changing trends of winter and spring SSTs during the Holocene in terms of spatial pattern and amplitudes (Figures 2a and 2b) in spite of significantly different changing trends in winter and spring insolation (Figure 3). The lagged response of spring SSTs to winter insolation has also been suggested by other studies [e.g., Laepple and Lohmann, 2009; Timmermann et al., 2014]. These suggest that variability in spring SSTs in the North Atlantic during the Holocene probably resulted from winter SSTs. Winter SSTs in the North Atlantic store their signals not only in winter water but also in spring water. Therefore, Mg/Ca records in the subtropical and subpolar North Atlantic can reflect winter SSTs even if there were no evidence for a calcifying population of planktonic foraminifera being present in winter as planktonic foraminifera records (both N. pachyderma (s) and G. bulloides) in this area can record spring ocean conditions [Jonkers et al., 2013; Rashid et al., 2016] that receives signal from winter SSTs.
2. Western Indian Ocean SST
Rashid et al. [2016] then turn to the reliability of our interpretation of the alkenone-derived SST record from core MD77-194. They start by arguing that long-distance transport of alkenones may obscure the SST signal from the region. This process is of course probably at least partly at play at this site, and we further note that such process may even alter foraminifera at other locations [van Sebille et al., 2015], in the same manner than
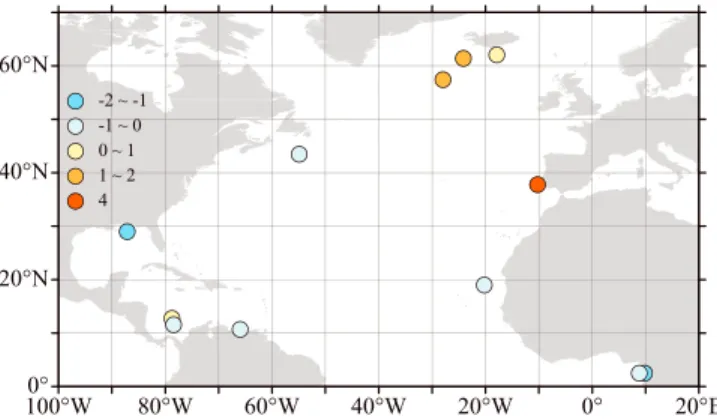
Figure 1. Mg-/Ca-based SST linear trends (°C/9.5 ka) during the Holocene (9.5–0 ka BP) over the North Atlantic. Summary of Mg/Ca records are described in Table 1.
Table 1. Summary of Mg/Ca Records Used in the Study
ID Core name Latitude (°N) Longitude (°E) Linear trend (°C/9.5 ka) Reference 1 RAPID-12-1 K 62.09 17.82 0.7 Thornalley et al. [2009] 2 ODP984 61.425317 24.08242 1.4 Came et al. [2007] 3 MD99-2251 57.447833 27.90783 1.2 Farmer et al. [2011] 4 OCE326-GGC26 43.483 54.867 0.9 Keigwin et al. [2005] 5 MD02-2575 29.0017 87.1188 2.0 Nürnberg et al. [2008] 6 ODP999 12.75 78.733 0.9 Schmidt et al. [2004] 7 VM28-122 11.567 78.417 0 Schmidt et al. [2004] 8 PL07-39PC 10.7 65.942 0.2 Lea et al. [2003] 9 MD03-2707 2.502 9.395 1.7 Weldeab et al. [2007a] 10 GeoB4905-4 2.5 9.39 0.8 Weldeab et al. [2007b] 11 BOFS31_1K 18.9979 20.1621 0.4 Elderfield and Ganssen [2000] 12 MD99-2334 37.801167 10.17133 4.0 Skinner and Elderfield [2005]
Journal of Geophysical Research: Atmospheres
10.1002/2015JD024270
for virtually every single proxy record from the marine realm. This process cannot be avoided, though, but other records suggest that the alkenone-based winter SST trends we present in Zhang et al. [2015a] are not an artifact (see detailed discussion below).
Rashid et al. [2016] further provided four evidences arguing against our reported winter SST record ((a) The core MD77-194 does not contain sediments younger than 2.71 ka. (b) Fluctuation of 0.3 °C SST between 4.5 ka and 2 ka is negligible in estimating the SSTs from alkenone concentration from core MD77-194. (c) Modern analog technique-derived (MAT-derived) SST estimates from the same core (i.e., MD77-194) do not show the“apparent cooling of 0.2°C,” rather it shows the warming trend which is bigger than 0.2°C. (d) There is no abrupt increase in SSTs in the eastern (it is not the western) tropical Indian Ocean) to conclude that the alkenone-derived SSTs from core MD77-194 is“not a reliable in-situ temperature” and “generally assumed to be an annual average SST proxy.” In addition, Rashid et al. [2016] compared recent Mg/Ca-SST data from a nearby core SK237-GC04 [Saraswat et al., 2013] with the alkenone-derived SSTs from core MD77-194 [Rashid et al., 2016, Figure 2]. On point (a), to reflect the evolution of SSTs during the Holocene over the low-latitude Indian Ocean, we used SSTs over the western tropical Indian Ocean from core MD77-194 [Sonzogni et al., 1998] as it was used to compute long-term Holocene SST trends in Leduc et al. [2010]. As no radiocarbon data
Figure 3. Changes in January (plus line) and April (circle line) insolation at 45°N during the Holocene [Berger and Loutre, 1991].
Figure 2. Changing trends (°C/9.5 ka) in (a) winter and (b) spring North Atlantic SSTs during the Holocene as estimated in the KCM HT simulation. Point-to-point correlations between December–February (DJF) and March–May (MAM) SSTs on interannual to interdecadal timescales (c) without and (d) with the removal of linear trends (insolation forcing). Dark (light) shading indicates areas where trends (correlations) are positively (negatively) significant at the 99% confidence level.
were available for that core, MD77-194 age model was considered as constant through the Holocene, with core top assigned to a“zero age” [Leduc et al., 2010]. Although probably appropriate to estimate the long-term Holocene SST trend, we agree with Rashid et al. [2016] that other cores with better age control are warranted. In the north-eastern Indian Ocean, an extended bibliographic survey made us aware of two other alkenone-based SST records with a much better age control than for core MD77-194 [Doose-Rolinski et al., 2001; Huguet et al., 2006]. On points (a), (b), and (d), many other studies do share a common SST increase during the mid-Holocene, although not “abrupt,” ranges from ~0.5°C to 1.5°C starting at around 6 ka seen in four different cores (Figure 4) over the tropical Indian Ocean and surrounding ocean [Arz et al., 2003; Kienast et al., 2001; Zhao et al., 2006; Lückge et al., 2009], i.e., in synchrony with other climatic records other than MD77-194 (Figure 5) that trend back toward values suggestive of a reinforced EAWM in southern Asia.
On point (c), along with the remark that the Mg-/Ca-derived SSTs from core SK237-GC04 [Saraswat et al., 2013] does not share the above mentioned trends, we emphasize that (1) the MAT records are more and more ques-tioned in the paleocommunity since, in the MARGO effort, it has been iden-tified to be responsible for a much stronger level of spatial heterogeneity in the tropics than has been simulated by coupled model runs (see, e.g., dis-cussion in Kageyama et al. [2013] and Lea et al. [2014]), and (2) by mixing the alkenone-derived and Mg/Ca-derived SST, Rashid et al. [2016] seem to ignore the increasing number of tropical to subtropical SST records suggesting that mixing SST proxies may lead to misin-terpret SST signals because they do not record SST over the same seasons [Koutavas and Sachs, 2008; Leduc et al., 2010; Schneider et al., 2010; Lohmann et al., 2013; Wang et al., 2013; Hessler et al., 2014; Timmermann et al., 2014; Leduc et al., 2014]. Among above men-tioned articles, those that deal with SST estimates from the northern tropics all interpret alkenone-derived SSTs as being reflective of winter-skewed SST records. Such a winter-skewed interpre-tation of alkenone-based SST records is also in agreement with the seasonality of coccolithophorids fluxes that peak in winter [Chen et al., 2007]. At low lati-tudes, where light is always available and the upper ocean largely stratified,
Figure 5. Evolution of SSTs in the tropical Indian Ocean and surrounding oceans. Locations of proxy records are given above in Figure 4.
Figure 4. Locations of alkenone records (GeoB5844 [Arz et al., 2003], MD77194 [Sonzogni et al., 1998], GIK18252 [Kienast et al., 2001], MD972151 [Zhao et al., 2006], and SO139-74KL [Lückge et al., 2009]) over the tropical Indian Ocean and surrounding oceans given below in Figure 5.
thefirst-order limiting factor for growth of primary producers such as coccolithophorids is nutrient availability, which increases in winter when upper ocean mixing occurs [Behrenfeld et al., 2006].
3. Conclusion
The divergences in the use of the SSTs records from the subpolar North Atlantic and tropical Indian Ocean during the Holocene between Zhang et al. [2015a] and Rashid et al. [2016] mirror enormous controversy interpreting paleo-SST records [e.g., Mann et al., 2009; Leduc et al., 2010; Schneider et al., 2010; Lohmann et al., 2013; Liu et al., 2014]. Further studies, e.g., modern process analysis, model-data comparisons, are needed to address this controversy.
References
Arz, H. W., F. Lamy, J. Pätzold, P. J. Müller, and M. Prins (2003), Mediterranean moisture source for an early Holocene humid period in the northern Red Sea, Science, 300, 118–121.
Behrenfeld, M., R. O’Malley, D. A. Siegel, C. McClain, J. Sarmiento, G. Feldman, P. Falkowski, E. Boss, and A. Milligan (2006), Climate-driven trends in contemporary ocean productivity, Nature, 444, 752–755.
Berger, A., and M. F. Loutre (1991), Insolation values for the climate of the last 10 million years, Quat. Sci. Rev., 10, 297–317, doi:10.1016/ 0277-3791(91)90033-Q.
Berner, K. S., N. Koç, D. Divine, F. Godtliebsen, and M. Moros (2008), A decadal-scale Holocene sea surface temperature record from the subpolar North Atlantic constructed using diatoms and statistics and its relation to other climate parameters, Paleoceanography, 23, PA2210, doi:10.1029/2006PA001339.
Came, R. E., D. W. Oppo, and J. F. McManus (2007), Amplitude and timing of temperature and salinity variability in the subpolar North Atlantic over the last 10,000 years, Geology, 35, 315–318.
Chen, Y.-L., H.-Y. Chen, and C.-W. Chung (2007), Seasonal variability of coccolithophore abundance and assemblage in the northern South China Sea, Deep Sea Res., Part II, 54, 1617–1633, doi:10.1016/j.dsr2.2007.05.005.
Doose-Rolinski, H., U. Rogalla, G. Scheeder, A. Lückge, and U. vonRad (2001), High-resolution temperature and evaporation changes during the Late Holocene in the northeastern Arabian Sea, Paleoceanography, 16(4), 358–367, doi:10.1029/2000PA000511.
Elderfield, H., and G. Ganssen (2000), Past temperature and δ18
O of surface ocean waters inferred from foraminifera Mg/Ca ratios, Nature, 405, 442–445.
Farmer, E. J., M. R. Chapman, and J. E. Andrews (2011), Holocene temperature evolution of the subpolar North Atlantic recorded in the Mg/Ca ratios of surface and thermocline dwelling planktonic foraminifera, Global Planet. Change, 79, 234–243.
Hessler, I., et al. (2014), Implication of methodological uncertainties for mid-Holocene sea surface temperature reconstructions, Clim. Past, 10, 2237–2252, doi:10.5194/cp-10-2237-2014.
Hillaire-Marcel, C., and A. de Vernal (2008), Comment on“Mixed-Layer Deepening During Heinrich Events: A Multi-Planktonic Foraminiferal δ18
O Approach”, Science, 320, 1161, doi:10.1126/science.1153316.
Huguet, C., J.-H. Kim, J. S. S. Damsté, and S. Schouten (2006), Reconstruction of sea surface temperature variations in the Arabian Sea over the last 23 kyr using organic proxies (TEX86and U37K′), Paleoceanography, 21, PA3003, doi:10.1029/2005PA001215.
Jin, L., B. Schneider, W. Park, M. Latif, V. Khon, and X. Zhang (2014), The spatial-temporal patterns of Asian summer monsoon precipitation in response to Holocene insolation change: A model-data synthesis, Quat. Sci. Rev., 85, 47–62, doi:10.1016/j.quascirev.2013.11.004. Jonkers, L., P. Jiménez-Amat, P. G. Mortyn, and G.-J. A. Brummer (2013), Seasonal Mg/Ca variability of N. pachyderma (s) and G. bulloides:
Implications for seawater temperature reconstruction, Earth Planet. Sci. Lett., 376, 137–144.
Kageyama, M., et al. (2013), Mid-Holocene and Last Glacial Maximum climate simulations with the IPSL model. Part II: Model-data comparisons, Clim. Dyn., 40, 2469–2495, doi:10.1007/s00382-012-1499-5.
Keigwin, L. D., J. P. Sachs, Y. Rosenthal, and E. A. Boyle (2005), The 8200 year B.P. event in the slope water system, western subpolar North Atlantic, Paleoceanography, 20, doi:10.1029/2004PA001074.
Kienast, M., S. Steinke, K. Stattegger, and S. E. Calvert (2001), Synchronous tropical south China Sea SST change and Greenland warming during deglaciation, Science, 291, 2132–2134.
Koutavas, A., and J. P. Sachs (2008), Northern timing of deglaciation in the eastern equatorial Pacific from alkenone paleothermometry, Paleoceanography, 23, PA4205, doi:10.1029/2008PA001593.
Laepple, T., and G. Lohmann (2009), Seasonal cycle as template for climate variability on astronomical timescales, Paleoceanography, 24, PA4201, doi:10.1029/2008PA001674.
Lea, D. W., D. K. Pak, L. C. Peterson, and K. A. Hughen (2003), Synchroneity of tropical and high-latitude Atlantic temperatures over the last glacial termination, Science, 301, 1361–1364.
Lea, D. W., M. Kienast, T. de Garidel-Thoron, M. Kageyama, A. Paul, and E. Bard (2014), COMPARE 2013: Constraining tropical ocean cooling during the Last Glacial Maximum, Past Global Changes Mag., 22(1), 43.
Leduc, G., R. Schneider, J.-H. Kim, and G. Lohmann (2010), Holocene and Eemian sea surface temperature trends as revealed by alkenone and Mg/Ca paleothermometry, Quat. Sci. Rev., 29, 989–1004.
Leduc, G., D. Garbe-Schönberg, M. Regenberg, C. Contoux, J. Etourneau, and R. Schneider (2014), The late Pliocene Benguela upwelling status revisited by means of multiple temperature proxies, Geochem. Geophys. Geosyst., 15, 475–491, doi:10.1002/2013GC004940.
Liu, Z., E. Brady, and J. Lynch-Stieglitz (2003), Global ocean response to orbital forcing in the Holocene, Paleoceanography, 18(2), 1041, doi:10.1029/2002PA000819, 2.
Liu, Z., J. Zhu, Y. Rosenthal, X. Zhang, B. L. Otto-Bliesner, A. Timmermann, R. S. Smith, G. Lohmann, W. Zheng, and O. Elison Timm (2014), The Holocene temperature conundrum, Proc. Natl. Acad. Sci. U.S.A., 111(34), E3501–E3505, doi:10.1073/pnas.1407229111.
Lohmann, G., M. Pfeiffer, T. Laepple, G. Leduc, and J.-H. Kim (2013), A model–data comparison of the Holocene global sea surface temperature evolution, Clim. Past, 9, 1807–1839, doi:10.5194/cp-9-1807-2013.
Lückge, A., M. Mohtadi, C. Rühlemann, G. Scheeder, A. Vink, L. Reinhardt, and M. Wiedicke (2009), Monsoon versus ocean circulation controls on paleoenvironmental conditions off southern Sumatra during the past 300,000 years, Paleoceanography, 24, PA1208, doi:10.1029/2008PA001627.
Acknowledgments
This study isfinanced by the National Natural Science Foundation of China (NSFC) (41275071), the State Key Program of NSFC (41130102), and the Fundamental Research Program funds for the Central Universities (grant lzujbky-2015-218). Liya Jin acknowledge support from the Deutsche Forschungsgemeinschaft (DFG) in the framework of the Cluster of Excellence“The Future Ocean” (EXC 80/1). The modeling experiments for the Holocene with KCM were performed at the Computer Center of Kiel University, Germany.
Mann, M. E., G. A. Schmidt, S. K. Miller, and A. N. LeGrande (2009), Potential biases in inferring Holocene temperature trends from long-term borehole information, Geophys. Res. Lett., 36, L05708, doi:10.1029/2008GL036354.
Nürnberg, D., M. Ziegler, C. Karas, R. Tiedemann, and M. W. Schmidt (2008), Interacting Loop Current variability and Mississippi River discharge over the past 400 kyr, Earth Planet. Sci. Lett., 272, 278–289, doi:10.1016/j.epsl.2008.04.051.
Rashid, H., B. Marche, M. Vermooten, D. Parry, M. Webb, B. Brockway, and K. Langer (2016), Comment on“Asynchronous variation in the East Asian winter monsoon during the Holocene” by Xiaojian Zhang, Liya Jin and Na Li, J. Geophys. Res. Atmos., 121, doi:10.1002/2015JD023983. Sachs, J. P. (2007), Cooling of Northwest Atlantic slope waters during the Holocene, Geophys. Res. Lett., 34, L03609, doi:10.1029/2006GL028495. Saraswat, R., D. W. Lea, R. Nigam, A. Mackensen, and D. K. Naik (2013), Deglaciation in the tropical Indian Ocean driven by interplay between
the regional monsoon and global teleconnections, Earth Planet. Sci. Lett., 375, 166–175.
Schmidt, M. W., H. J. Spero, and D. W. Lea (2004), Links between salinity variation in the Caribbean and North Atlantic thermohaline circulation, Nature, 428, 160–163.
Schneider, B., G. Leduc, and W. Park (2010), Disentangling seasonal signals in Holocene climate trends by satellite-model-proxy integration, Paleoceanography, 25, PA4217, doi:10.1029/2009PA001893.
Skinner, L. C., and H. Elderfield (2005), Constraining ecological and biological bias in planktonic foraminiferal Mg/Ca and δ18
Occ: A multispecies approach to proxy calibration testing, Paleoceanography, 20, PA1015, doi:10.1029/2004PA001058.
Sonzogni, C., E. Bard, and F. Rostek (1998), Tropical sea surface temperatures during the last glacial period: A view based on alkenones in Indian Ocean sediments, Quat. Sci. Rev., 17, 1185–1201, doi:10.1016/S0277-3791(97)00099-1.
Thornalley, D. J. R., H. Elderfield, and I. N. McCave (2009), Holocene oscillations in temperature and salinity of the subpolar North Atlantic, Nature, 457, 711–714, doi:10.1038/nature07717.
Timmermann, A., J. Sachs, and O. E. Timm (2014), Assessing divergent SST behavior during the last 21 ka derived from alkenones and G. ruber-Mg/Ca in the equatorial Pacific, Paleoceanography, 29, 680–696, doi:10.1002/2013PA002598.
Tolderlund, D. S., and A. W. H. Bé (1971), Seasonal distribution of planktonic foraminifera in the Western North Atlantic, Micropaleontology, 17, 297–329.
van Sebille, E., P. Scussolini, J. V. Durgadoo, F. J. C. Peeters, A. Biastoch, W. Weijer, C. Turney, C. B. Paris, and R. Zahn (2015), Ocean currents generate large footprints in marine palaeoclimate proxies, Nat. Commun., 6, 6521, doi:10.1038/ncomms7521.
Wang, Y. V., G. Leduc, M. Regenberg, N. Andersen, T. Larsen, T. Blanz, and R. R. Schneider (2013), Northern and southern hemisphere controls on seasonal sea surface temperatures in the Indian Ocean during the last deglaciation, Paleoceanography, 28, 619–632, doi:10.1002/palo.20053. Weldeab, S., D. W. Lea, R. R. Schneider, and N. Andersen (2007a), 155,000 years of West African monsoon and ocean thermal evolution, Science,
316, 1303–1307.
Weldeab, S., R. R. Schneider, and P. Müller (2007b), Comparison of Mg/Ca- and alkenone-based sea surface temperature estimates in the fresh water–influenced Gulf of Guinea, eastern equatorial Atlantic, Geochem. Geophys. Geosyst., 8, Q05P22, doi:10.1029/2006GC001360. Zhang, X., L. Jin, and N. Li (2015a), Asynchronous variation in the East Asian winter monsoon during the Holocene, J. Geophys. Res. Atmos.,
120, 5357–5370, doi:10.1002/2014JD022585.
Zhang, X., L. Jin, and W. Jia (2015b), Centennial-scale teleconnection between North Atlantic sea surface temperatures and the Indian summer monsoon during the Holocene, Clim. Dyn., doi:10.1007/s00382-015-2771-2.
Zhao, M., C.-Y. Huang, C.-C. Wang, and G. Wei (2006), A millennial-scale U37K′sea-surface temperature record from the South China Sea (8°N) over the last 150 kyr: Monsoon and sea-level influence, Palaeogeogr. Palaeoclimatol. Palaeoecol., 236, 39–55, doi:10.1016/j.palaeo.2005.11.033.

![Figure 4. Locations of alkenone records (GeoB5844 [Arz et al., 2003], MD77194 [Sonzogni et al., 1998], GIK18252 [Kienast et al., 2001], MD972151 [Zhao et al., 2006], and SO139-74KL [Lückge et al., 2009]) over the tropical Indian Ocean and surrounding ocean](https://thumb-eu.123doks.com/thumbv2/123doknet/13713710.434683/5.918.267.628.138.330/figure-locations-alkenone-sonzogni-kienast-lückge-tropical-surrounding.webp)
