HAL Id: hal-02407751
https://hal.archives-ouvertes.fr/hal-02407751
Submitted on 21 Apr 2021
HAL is a multi-disciplinary open access
archive for the deposit and dissemination of
sci-entific research documents, whether they are
pub-lished or not. The documents may come from
teaching and research institutions in France or
abroad, or from public or private research centers.
L’archive ouverte pluridisciplinaire HAL, est
destinée au dépôt et à la diffusion de documents
scientifiques de niveau recherche, publiés ou non,
émanant des établissements d’enseignement et de
recherche français ou étrangers, des laboratoires
publics ou privés.
Distributed under a Creative Commons Attribution| 4.0 International License
High-resolution vegetation and climate change
associated with Pliocene Australopithecus afarensis
Raymonde Bonnefille, R. Potts, F. Chalié, D. Jolly, O. Peyron
To cite this version:
Raymonde Bonnefille, R. Potts, F. Chalié, D. Jolly, O. Peyron. High-resolution vegetation and climate
change associated with Pliocene Australopithecus afarensis. Proceedings of the National Academy of
Sciences of the United States of America , National Academy of Sciences, 2004, 101 (33),
pp.12125-12129. �10.1073/pnas.0401709101�. �hal-02407751�
High-resolution vegetation and climate change
associated with Pliocene
Australopithecus afarensis
R. Bonnefille*†, R. Potts†‡, F. Chalie´*, D. Jolly§, and O. Peyron¶
*Centre Europe´en de Recherche et d’Enseignement des Ge´osciences de l’Environnement, Unite´ Mixte de Recherche 6635, Centre National de la Recherche Scientifique, B.P. 80, 13545 Aix-en-Provence Cedex 04, France;‡Human Origins Program, National Museum of Natural History, Smithsonian Institution,
Washington, DC 20560-0112;§Institut des Sciences de l’Evolution, Unite´ Mixte de Recherche Centre National de la Recherche Scientifique 5554, Universite´
Montpellier II, F-34095 Montpellier Cedex 05 France; and¶Laboratoire de Chronoe´cologie, Unite´ Mixte de Recherche 6565, Universite´ de Franche Comte´
25030 Besanc¸on, France
Edited by Thure E. Cerling, University of Utah, Salt Lake City, UT, and approved June 22, 2004 (received for review March 11, 2004)
Plio-Pleistocene global climate change is believed to have had an important influence on local habitats and early human evolution in Africa. Responses of hominin lineages to climate change have been difficult to test, however, because this procedure requires well documented evidence for connections between global climate and hominin environment. Through high-resolution pollen data from Hadar, Ethiopia, we show that the hominin Australopithecus
afa-rensis accommodated to substantial environmental variability
be-tween 3.4 and 2.9 million years ago. A large biome shift, up to 5°C cooling, and a 200- to 300-mm兾yr rainfall increase occurred just before 3.3 million years ago, which is consistent with a global marine␦18O isotopic shift.
G
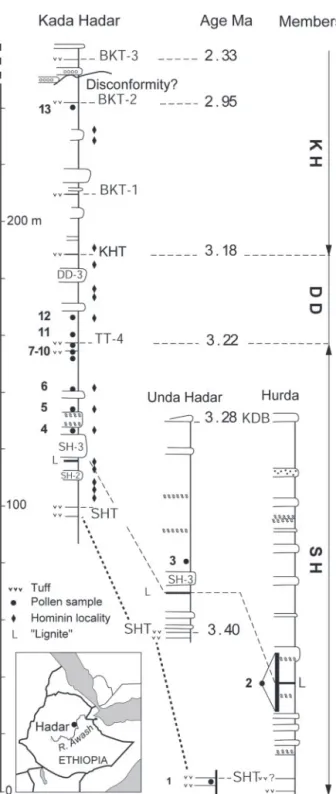
lobal cooling, drying, and high-amplitude climate variability have been associated with evolutionary change in terrestrial mammals since the early Pliocene. The idea that global climate events may account for evolutionary change in early humans has led to considerable debate about whether Pliocene hominins favored open-arid settings or wooded-moist habitats, or could adjust to diverse environments (1–4). To determine the climatic conditions of human evolution requires temporally and spatially precise environmental data and improved methods of relating environmental and evolutionary change (1–3, 5, 6). Australo-pithecus afarensis is the best documented Pliocene hominin lineage, known from numerous localities in the well calibrated sequence at Hadar (7–9), dated from 3.4 to 2.9 million years ago (mya). The nearly continuous stratigraphic distribution of this species at Hadar offers a unique opportunity to address the relationship between environment and hominin evolution. By providing new quantitative estimates of climatic parameters, statistically supported and repeatable from high-resolution pol-len data associated with A. afarensis, we establish a link between change in terrestrial ecosystems at Hadar and global climatic variability.Fossil pollen assemblages were recovered from 27 strati-graphic horizons within lacustrine facies (10) of the Hadar Formation (11). The age of the samples is well constrained by Ar40兾Ar39dating of the main marker tuffs (12, 13), paleomag-netic measurements (14, 15), and stratigraphic correlation be-tween sections at Hadar and Hurda, a few kilometers east of the Kada Hadar (ref. 16 and Fig. 1). At Hurda, a 20-m outcrop of lacustrine black clay below the SH-3 sand provided high-resolution pollen data for an⬇20-kyr interval (3.37–3.35 mya) between the 3.4 mya Sidi Hakoma Tuff (SHT) and the 3.28 mya Kada Damum Basalt (KDB). The span of⬇20 kyr is estimated on the basis of an averaged sedimentation rate also previously used to match the stratigraphic placement of the lower limit of the Mammoth event at Hadar with its 3.32-mya age (15).
The Hadar region (11o06⬘ to 09⬘ N, 40o35⬘ to 39⬘ E; alt. 500 m) today is extremely arid. Mean annual precipitation is⬇500 mm, potential evapotranspiration is 1,750 mm兾yr, interpolated mean annual temperature (Tann) is 26.6°C, and mean temperature of the coldest month (MTCO) is 24°C. Monsoon precipitation shows strong annual fluctuation between 300 and 800 mm兾yr.
Pollen-based estimates of present climatic parameters were obtained on modern pollen samples collected in 2001, and gave results consistent with both measured and interpolated climate data (Table 1, which is published as supporting information on the PNAS web site). The local vegetation at Hadar is Acacia兾
Commiphora steppe, with Ficus兾Tamarix riverine forest well
developed within the meanders of the Awash River. Acacia兾 Euclea evergreen bushland is observed at midelevation on the rift escarpment, whereas Podocarpus兾Olea with Juniperus forest occurs above 2,000 m and Afroalpine grassland above the upper tree limit at 3,300 m elevation (11).
Methods
Biome and climatic interpretations of the Hadar fossil record take into account pollen presence兾absence and the relative abundance of pollen taxa. Biome reconstructions are based on modern pollen taxa frequencies obtained from 966 recently collected sites and measured climatic parameters derived from hundreds of meteoro-logical stations across Africa (17–19). Based on combinations of plant functional types (PFTs), African biomes reconstructed by using these modern data sets realistically reproduce classic vege-tation maps (17). Biome reconstructions at Hadar relied on assign-ing each of the 121 fossil pollen taxa to one or more PFTs. Four biomes were inferred from the Hadar data set, including steppe (STEP), tropical xerophytic woods兾scrub (TXWS), temperate xe-rophytic woods兾scrub (XERO), and warm mixed forest (WAMF). STEP biome contains only steppe forb兾shrub PFTs. TXWS biome contains tropical sclerophyll兾succulent PFTs. XERO has temper-ate sclerophyll兾succulent plus eurythermic conifer PFTs. WAMF includes six PFTs, ranging from warm-temperate evergreen (cor-responding to broad- or needle-leaved taxa) to tropical raingreen PFTs (seasonal or deciduous) and boreal summer green (19, 20). For each pollen sample, the four biomes are represented by affinity score values calculated by the algorithm in ref. 17. The dominant biome has the highest score, as exemplified by modern samples in which the STEP biome has the highest score, in agreement with the observed modern vegetation.
Climatic parameters were reconstructed by two distinct methods, which use 79 fossil pollen taxa in common with a modern pollen data set of 450 sites limited to East Africa (18). In the PFT method (19), pollen taxa were assigned to PFTs (17). Estimates of mean annual precipitation, humidity coefficient, and MTCO at each modern pollen site were calculated by a transfer function using an artificial neural network to relate pollen percentages attached to the PFT and meteorological parameters (19). In the Best Analog This paper was submitted directly (Track II) to the PNAS office.
Abbrevations: SH, Sidi Hakoma; SHT, SH Tuff; KDB, Kada Damum Basalt; DD, Denen Dora; MTCO, mean temperature of the coldest month; PFT, plant functional type; STEP, steppe; TXWS, tropical xerophytic woods兾scrub; XERO, temperate xerophytic woods兾scrub; WAMF, warm mixed forest; BA, Best Analog; mya, million years ago.
†To whom correspondence may be addressed. E-mail: [email protected] or [email protected].
© 2004 by The National Academy of Sciences of the USA
(BA) method (18), weighting coefficients are provided by the first principal component of the lagged cross-correlation between pollen taxa in the time-constrained fossil sequence. Similarity indices
between each fossil sample and ten modern pollen analogs are given by a chord distance, calculated as a sum of differences between log-transformed percentages of the 79 taxa. Error is defined as the lower and upper extreme chord distances compared with the mean value. The precision of climatic estimates by using the BA method was tested by using distinct pollen preparations of a single fossil pollen sample (Table 2, which is published as supporting informa-tion on the PNAS web site).
Results and Discussion
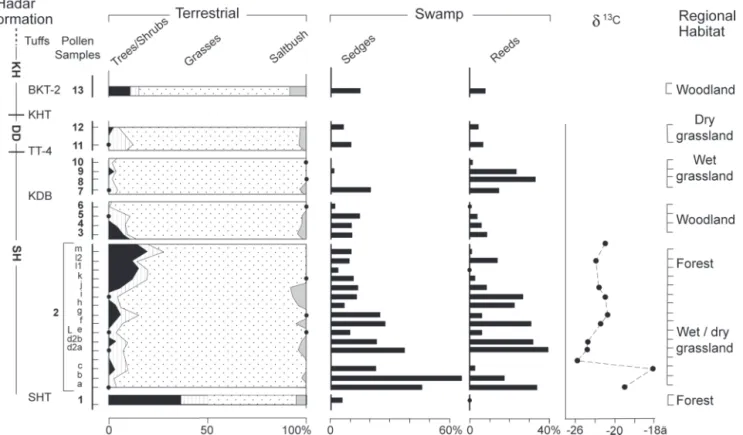
The Hadar fossil pollen record (Fig. 2) is dominated by suba-quatic emergent reeds (Typha), sedges (Cyperaceae), and grasses (Gramineae), indicating locally extensive herbaceous cover sur-rounding the paleolake. Typha grows on flat, soft, inundated soils in proximity to low-energy river deltas or lakes and with-stands periodic dryness. The occurrence of aquatic Laurembergia and high Cyperaceae values (21) characterizes extant highland swamps. Variations in sedge percentages (2–60%) reflect water level fluctuations; however, a low proportion of saltbush (Che-nopodiaceae兾Amaranthaceae) pollen contrasts with its abun-dance in alkaline lakes of the arid Rift today (22). If regional grasses contributed to organic input, they consisted mainly of C3 species typical of highlands (Fig. 2).
A total of 51 fossil pollen taxa were attributed to trees or shrubs, the composition and percentages of which fluctuate through time (1–30%). The oldest sample of the lower Sidi Hakoma (SH) Member, at 3.4 mya, contains elements of both deciduous (Garcinia and Euclea) and evergreen forest or bush-land (Alangium, Ekebergia, and Juniperus), later replaced by high-elevation humid forest taxa (Myrica, Ilex, Hagenia, and Olea). Pollen data from the upper SH and lower Denen Dora (DD) Members indicate a succession from woodland to wet and dry grassland. A component of drier conifer forest (Juniperus) occurs throughout the sequence but becomes abundant only in the youngest sample (2.95 mya). Arboreal elements of arid steppe (Commiphora, Acacia, Grewia, and Capparidaceae) and riverine forest (Combretaceae and Tamarix) were rare.
Unlike the fauna, which includes many extinct species, the taxonomy of fossil pollen taxa refers to modern plants (11), and thus allows statistical interpretation based on attributes of modern biome (17) and climatic parameters (18, 19). Of the four major fossil biomes identified at Hadar, STEP, TXWS, and XERO have similar score values throughout the sequence (Fig. 3), indicating their permanent presence in the area. Scores for the WAMF biome indicate its repeated appearance and disappearance, with two notable increases, one near the SHT and the other below the KDB. Due to high score values during these two intervals, we assume that the WAMF signal corresponds to regional pollen input from a source not far from the site. Its increase represents an overall expansion of this biome that brought it closer to the sampling site. The four biomes imply different ecological settings and require pollen input from vegetation at different altitudes. We thus infer that Hadar was located at the limit of the WAMF biome adjacent to xerophytic cool steppe along an escarpment slope.
Here, we present two temporal distributions of paleoclimate values derived from the BA and PFT methods. The results are highly consistent (Fig. 3, and Table 3, which is published as supporting information on the PNAS web site). They show that Pliocene rainfall values (800–1,200 mm兾yr) throughout the fossil sequence were about twice that of today. Highest precipitation values (1,000–1,200 mm兾yr) occurred between 3.37 and 3.35 mya (samples 2k-2m), and are accompanied by an increase in the humidity coefficient (70–90%). Two independent methods of temperature estimation (MTCO and Tann) give similar values. Throughout the Hadar sequence, Tann varies from 15.5°C to 24.8°C, a range included within the tropical domain. Between 3.37 and 3.35 mya, MTCO and Tann estimates were ⬇8–11°C lower than present, coinciding with significantly higher humidity. Fig. 1. Location of pollen samples (bold numbers) from the Hadar Formation,
according to stratigraphy (14 –16), dated tuffs (12, 13), and hominin localities (7–9). 1: clay, 20 cm below SHT, 3.40 mya; 2: lacustrine black clay (L), 20-m section ⬇30 m above SHT and ⬇80 m below the 3.28 mya KDB, 3.37–3.35 mya; 3: silty clay, 3 m above the top of the SH-3 sand and below the gastropod layer,⬍3.28 mya; 4: brown clay, 11 m above the base of the SH-3 sand, 3.25 mya; 5: silt, lower contact of pink calcareous marl, 3.25 mya; 6: green clay, below TT-4, 3.24 mya; 7: green clay, below TT-4, 3.23 mya; 8: sandy clay, below TT-4, 3.22 mya; 9: black clay, 50 cm below ostracod layer, 3.22 mya; 10: ostracod clay, below TT-4, 3.22 mya; 11: silt, 2m above TT-4,⬍3.22 mya; 12: clay, 10 m above TT-4, ⬍3.18 mya; 13: clay, lower contact with BKT-2, 2.95 mya. All ages are interpolated except for samples 1 and 13. Although pollen sampling was systematically done throughout the section, including hominin localities, fossil pollen were preserved only in specific strata.
Temperature and precipitation values and trends are consistent with biome reconstructions. The calculated humidity coefficient oscillates around 60%, which is slightly below the 65% threshold for forest biome worldwide today (20).
For the entire 3.4- to 2.95-mya period, climatic parameters reconstructed from pollen indicate conditions significantly cooler and wetter than present, a conclusion that fits the depleted isotopic␦18O values on shells (23), and may be partially explained by higher elevation (10). The mean temperature estimate of 20.2°C calculated for all pollen samples implies that Hadar was generally 6.4°C cooler than the present. This differ-ence is consistent with an elevation 1,000 m higher than today, assuming a present lapse rate of 0.6°C兾100 m (24). Substantial temperature, rainfall, humidity, and biome change recorded in the upper part of sample 2, followed by a return to previous conditions, however, is not adequately explained by a unidirec-tional tectonic change. Indeed, subsidence in the Hadar area was virtually completed by the mid-Pliocene (25). Although variation in the climatic estimates between adjacent samples is generally encompassed within statistical error, the longer-term pattern of fluctuation implies a climatic cause (Fig. 3).
The oldest level, just before 3.4 mya, shows highest probability precipitation values slightly greater than present, lower temper-ature, a higher humidity coefficient, and a higher WAMF biome score. After significant forest retreat, xerophytic biomes and STEP dominated, although buffered by a fluctuating swamp. Within the densely sampled interval ⬇3.37–3.35 mya, strong cooling of up to 5°C is associated with increasing rainfall of 200–300 mm兾yr and a humidity index favorable to wet forest for a few thousand years. The pollen record of the upper SH and lower DD Members is more discontinuous but attests to the predominance of xerophytic biomes, although cooler and less arid than present (800–900 mm兾yr; Table 3). The single pollen sample below the 2.95-mya BKT-2 indicates the return of higher
humidity, slight expansion of the forest biome, and a greater difference between MTCO and Tann, which attests to a stronger seasonal contrast than today. In general, faunal information from the late Pliocene of East Africa is consistent with the biome changes we infer throughout the Hadar sequence (6, 26–28).
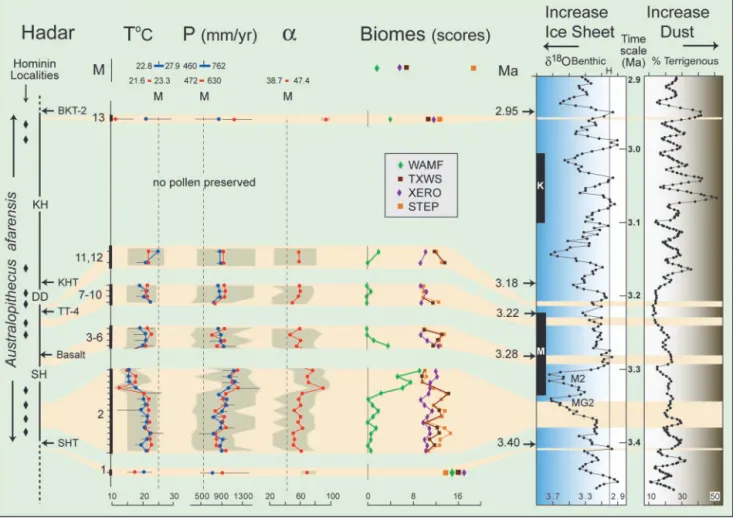
Climate and vegetation variability at Hadar corresponds well with global records (Fig. 3). Environmental change in the lower SH Member, evident in the high-resolution, ⬇20-kyr interval (pollen samples 2a to 2m at Hurda), may track a precessional cycle, which dominated global climate variability before 2.8 mya (2). However, stratigraphic correlation places this strong cool兾wet shift and vegetation change immediately below the limit of the Mammoth subchron (14–16). We thus infer that the marked change at Hadar reflects the initial phase of the MG2 isotopic cooling event, well documented in the marine␦18O record, corresponding to ice sheet growth and sea temperature change (29). The magnitude of Hadar cooling also agrees with the model-simulated mid-Pliocene cooling over East Africa, explained by increased low-level cloud cover (30) and a predominantly El Nin˜o pattern (31) under modern pCO2values. Pollen samples 3–6 correlate precisely with the warming phase that followed the marine isotopic M2 cooling event. Samples 7–12 document a stable period of expanded steppe and wooded grasslands in the upper SH Member correlative with a 100-kyr stable period in the ␦18O and terrigenous dust records (2, 29). Despite systematic sampling, no pollen was recovered from 3.2 to 2.95 mya. At the end of this interval, stronger seasonal contrasts (MTCO relative to Tann) in sample 13 fits well with increased dust variability in the African marine record (2).
Our results show that a diversity of biomes was available to A. afarensis. Recovery of hominin fossils through the entire strati-graphic range suggests no marked preference by A. afarensis for any single biome, including forest. Significant cooling and biome Fig. 2. Summary pollen diagram of the Hadar Formation, showing pollen frequencies from trees兾shrubs, grasses, and saltbush, calculated after excluding swamp component and fern spores. Stratigraphy as in Fig. 1. Interpretation of regional habitat is based on a classical palynological approach without statistical comparison. Stable␦13C values from total organic matter have been provided by T. E. Cerling (University of Utah, Salt Lake City).
change had no obvious effect on the presence of this species through the sequence, a pattern of persistence shared by other Pliocene mammal taxa at Hadar and elsewhere (6, 27, 32). We hypothesize that A. afarensis was able to accommodate to periods of directional cooling, climate stability, and high variability. Our findings further imply that A. afarensis’ ability to adapt to such diverse conditions did not depend on an enlarged brain or stone toolmaking, which characterized later hominins.
We thank the Ethiopian and Afar authorities; the Institute of Human Origins (Arizona State University, Tempe, AZ); D. C. Johanson and
W. H. Kimbel, codirectors of the Hadar Research Project, for support of the additional 2001 field work; W. H. Kimbel, C. J. Campisano, A. K. Behrensmeyer, E. Hovers, G. G. Eck, R. Bobe, P. Molnar, C. Feibel, J. Guiot, and J. Aronson for manuscript discussions; T. E. Cerling for carbon isotopic measurements; P. deMenocal and N. Shackleton for terrigenous dust and oxygen isotopic data used in the figures; G. Buchet for assistance on pollen data; and M. Parrish, D. Reed, and J. B. Clark for assistance with the manuscript. This work was supported by the French Centre National de la Recherche Scientifique and Smithsonian Fellowships Program (to R.B.) and by the Smithsonian Human Origins Program and the National Science Foundation (to R.P.).
1. Vrba, E. S., Denton, G. H., Partridge, T. C. & Burckle, L. H., eds. (1995)
Paleoclimate and Evolution, with Emphasis on Human Origins (Yale Univ. Press,
New Haven, CT).
2. deMenocal, P. B. (1995) Science 270, 53–59. 3. Potts, R. (1998) Yrb. Phys. Anthropol. 41, 93–136.
4. WoldeGabriel, G., White, T. D., Suwa, G., Renne, P., de Heinzelin, J., Hart, W. K. & Heiken, G. (1994) Nature 371, 330–333.
5. Behrensmeyer, A. K., Todd, N. E., Potts, R. & McBrinn, G. E. (1997) Science
278,1589–1594.
6. Bobe, R., Behrensmeyer, A. K. & Chapman, R. E. (2002) J. Hum. Evol. 42, 475–497.
7. Johanson, D. C., Taieb, M. & Coppens, Y. (1982) Am. J. Phys. Anthropol. 57, 373–402.
8. Kimbel, W. H., Johanson, D. C. & Rak, Y. (1994) Nature 368, 449–451. 9. Lockwood, C. A., Kimbel, W. H. & Johanson, D. C. (2000) J. Hum. Evol. 39,
23–55.
10. Aronson, J. & Taieb, M. (1981) AAAS Sel. Symp. 63, 165–195.
11. Bonnefille, R., Vincens, A. & Buchet, G. (1987) Palaeogeogr. Palaeoclimatol.
Palaeoecol. 60, 249–281.
12. Walter, R. C. & Aronson, J. L. (1993) J. Hum. Evol. 25, 229–240. 13. Walter, R. C. (1994) Geology 22, 6–10.
14. Schmitt, T. J. & Nairn, A. E. M. (1984) Nature 309, 704–706.
15. Renne, P. R., Walter, R. C., Verosub, K. L., Sweitzer, M. & Aronson, J. L. (1993) Geophys. Res. Lett. 20, 1067–1070.
16. Tiercelin, J. J. (1986) Sedimentation in the African Rifts (Blackwell, Oxford).
Fig. 3. Estimated climatic parameters and biome scores associated with Hadar geochronology (Left) and related to variations of global climate (␦18O) and dust
recorded from the Indian Ocean (Right). T°C refers to mean annual temperature (Tann) estimated by the BA method (blue curve) and MTCO estimated by the
PFT method (red curve). P (mm兾yr) refers to mean annual precipitation estimated by the BA method (blue curve) and by the PFT method (red curve). Humidity coefficient (␣) is reconstructed by the PFT method. (Upper) Modern references (M) for Hadar correspond to the range of estimated climatic parameters and biome scores obtained on modern pollen samples, showing the overlap between the two methods. The vertical dotted line corresponds to the mean of the modern estimates, which is compared against Pliocene values. Red and blue dots represent the highest probability estimates; statistical error (see text) is indicated in gray for the red dots and by a horizontal solid line for the blue dots. Biomes (see text) include WAMF, STEP, TXWS, and XERO. Terrigenous percent is from Ocean Drilling Program (ODP) sites 721兾722 (2).␦18O benthic is from ODP site 846 (29).
17. Jolly, D., Prentice, I., Bonnefille, R., Ballouche, A, Bengo, M., Brenac, P., Buchet, G., Burney, D., Cazet J., Cheddadi, R., et al. (1998) J. Biogeogr. 25, 1007–1027. 18. Bonnefille, R., Chalie´, F., Guiot, J. & Vincens, A. (1992) Clim. Dyn. 6, 251–257. 19. Peyron, O., Jolly, D., Bonnefille, R., Vincens, A. & Guiot, J. (2000) Quat. Res.
54,90–101.
20. Prentice, I. C., Cramer, W., Harrison, S. P., Leemans, R., Monserud, R. A. & Solomon, A. M. (1992) J. Biogeogr. 19, 117–134.
21. Mohammed, M. U. & Bonnefille, R. (1998) Global and Planetary Change
16–17,121–129.
22. Mohammed, M. U., Bonnefille, R. & Johnson, T. C. (1995) Palaeogeogr.
Palaeoclimatol. Palaeoecol. 119, 371–383.
23. Hailemichael, M., Aronson, J. L., Savin, S., Tevesz, M. J. S. & Carter J.G. (2002) Palaeogeogr. Palaeoclimatol. Palaeoecol. 186, 81–99.
24. Meyer, H. (1992) Palaeogeogr. Palaeoclimatol. Palaeoecol. 99, 71–99. 25. Redfield, T.F., Wheeler, W.H. & Often, M. (2003) Earth Planet. Sci. Lett. 216,
383–398.
26. Reed, K. E. (1997) J. Hum. Evol. 32, 289–322.
27. Bobe, R. & G. Eck, G. (2001) Paleobiology Memoirs 27, Suppl. 2, 1–48.
28. Alemseged, Z. (2003) J. Hum. Evol. 44, 451–478.
29. Shackleton, N. J., Hall, M. A. & Pate, D. (1995) Proc. Ocean Drill. Program:
Sci. Res. 138, 337–353.
30. Chandler, M., Rind, D. & Thompson, R. (1994) Global and Planetary Change
9,197–219.
31. Cane, M. A. & Molnar, P. (2001) Nature 411, 157–162. 32. Frost, S. R. & Delson, E. (2002) J. Hum. Evol. 43, 687–748.