K.,
May 7th, 1998
© Luis Garcia-Delgado, 1998. All Rights Reserved.
7
A
uthor ... ...
..
...
;
...
Department of Nuclear Engineering
A
May 7th, 1998
Certified by
... ----....
...
...
... ...
N.E. Todreas, Professor of Nuclear Engineering
Thesis Co-Supervisor
Certified by
...
...
...
M.J. Driscoll, Professokmeritus of Nuclear Engineering
Thesis Co-Supervisor
Certified by
...
...
J.E. Meyer, Pro~ssor of Nuclear Engineering
Thesis Co-Supervisor
Accepted by
...
.. .
...
L. Lidsky, Professor of Nuclear Engineering
Chairman, Dept. Committee on Graduate Students
A"
LK
Design of an Economically Optimum PWR
Reload Core for a 36-Month Cycle
by
Luis Garcia-Delgado
Ingeniero Industrial, Universidad Polit6cnica de Madrid (1996)
Ing6nieur, Ecole Centrale Paris (1996)
Submitted to the Department of Nuclear Engineering in partial
fulfill-ment of the requirefulfill-ments for the degrees of Nuclear Engineer and
Master of Science in Nuclear Engineering
at the
Design of an Economically Optimum PWR
Reload Core for a 36-Month Cycle
by
Luis Garcia-Delgado
Submitted to the Department of Nuclear Engineering on May 7, 1998, in partial fulfillment of the requirements for the degrees of Nuclear Engineer and Master of Science in Nuclear Engineering
Abstract
The goal of making nuclear plants more economically competitive with other sources of electricity has motivated research on extended operating cycles. By increasing cycle length in currently operating PWRs, the outage frequency is reduced, and the capacity fac-tor is improved, providing an economic benefit. On the other hand, fuel with higher enrichment is required, and the fuel fabrication costs go up. A single-batch strategy is required if the current burnup licensing limit (60 GWD/MTU) is to be maintained. Previ-ous work has shown the technical feasibility of single-batch cycles up to 44 calendar months in PWRs. Parametric studies indicated that the economically optimum length for a PWR, single-batch core is about 36 calendar months.
The goal of this thesis is to design a PWR reload core for a 36-month cycle ready for implementation in current reactors and capable of appealing to utility managers. The core design includes physics, fuel performance and economics analysis. For the neutronics study, the core is modeled in 3 dimensions and in the steady-state using the codes CASMO-3/SIMULATE-3. Several steps are considered in the design process. First, the fuel enrichment required for the cycle and the most suitable burnable absorber are selected. Then, an optimum design is obtained for the peripheral assemblies that mini-mizes fuel costs. Finally, axial blankets that reduce neutron leakage are analyzed, as well as the benefits of axially grading the poison loading. The fuel performance --key to the technical feasibility of the core-- is analyzed with the code FROSSTEY-2, and simple models are developed for cladding corrosion and fission gas release. Core costs are calcu-lated and the influence of operational and economics parameters is studied.
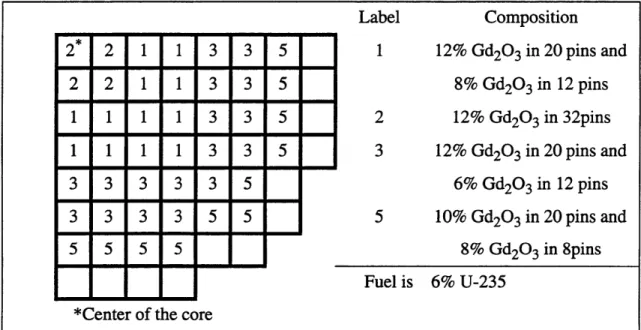
A PWR reload core is presented that meets current physics and fuel performance design limits for a cycle of 33.9 EFPM or 36 calendar months when operating at a capacity factor of 94.1%. Fuel is enriched to 6.5% U-235 and selected pins use gadolinia as burnable absorber mixed with U02. By including pins with two different concentrations of
gado-linia in the asssemblies, very good reactivity control is obtained, and the power is evenly distributed over a broad region of the core. Fuel costs are optimized by loading the core periphery with reused assemblies. The rest of the assemblies are discharged after one cycle in the core. The design criteria for peak pin exposure, axial enthalpy rise hot channel factor, and total peaking factors are met.
The fuel performance analysis indicates that fuel centerline temperature, rod internal pres-sure, cladding oxide thickness, clad surface temperature and fission gas release are within
acceptable limits, although in general slightly larger than for a contemporary reference 18-month cycle multibatch loading strategy.
The 36-month core is economically competitive with an 18-month reference core under certain operational conditions. Considering a refueling outage of 30 days and 3% forced outage rate, the 36-month core is about $5M/yr more expensive than an 18-month refer-ence core. However, if the outage length increases to 42 days, costs are similar for both cores. Furthermore, the reduction in enrichment costs expected with the development of AVLIS technology will make the 36-month cycle more economically attractive and poten-tially cost competitive with the 18-month reference cycle.
Thesis Co-Supervisor: Michael J. Driscoll Title: Prof. Emeritus of Nuclear Engineering Thesis Co-Supervisor: John E. Meyer
Title: Prof. of Nuclear Engineering Thesis Co-Supervisor: Neil E. Todreas Title: Prof. of Nuclear Engineering
Acknowledgments
I am very grateful to Professors N.E. Todreas, M.J. Driscoll, and J.E. Meyer, who pro-vided invaluable guidance and advice. I particularly appreciate their availability, useful comments and challenging suggestions that helped me in my endeavors.
I want to thank all those who provided some assistance at some point in my work. In particular, my colleagues C.S. Handwerk and M.V. McMahon worked on related topics for their graduate degrees and were willing to share their knowledge on extended cycles. Assistance from professionals in the nuclear industry was essential. Special thanks to K. St.John, from Yankee Atomic Electric Company, now Duke Engineering & Services, who provided access to the code FROSSTEY-2 and was always ready to answer my questions on fuel performance.
I would like to thank La Caixa, whose financial support made possible my studies at MIT.
And last but not least, I am very grateful to my family, especially my parents, who sup-ported me from afar.
Major Nomenclature
AVLIS: Atomic Vapor Laser Isotopic Separation
BC: Boron Coefficient
BOC: Beginning Of Cycle
CBC: Core Boron Concentration
CDF: Cumulative Distribution Function EFPD: Effective Full Power Days
EFPM: Effective Full Power Months EOC: End Of Cycle
FCT: Fuel Centerline Temperature FGR: Fission Gas Release
FAH: Maximum Enthalpy Rise Hot Channel Factor FOR: Forced Outage Rate
FQ: Total Core Peaking Factor FTC: Fuel Temperature Coefficient
HFP: Hot Full Power
IFBA: Integral Fuel Burnable Absorber
LOCA: Loss Of Coolant Accident LWR: Light Water Reactor
MOX: Mixed Oxide
MTC: Moderator Temperature Coefficient
PC: Power Coefficient PCI: Pellet-Clad Interaction
PWR: Pressurized Water Reactor RBA: Radial Blanket Assembly
RCCA: Rod Cluster Control Assembly RFO: Refueling Outage
Table of Contents
Acknowledgments 5 Major Nomenclature 6 Table of Contents 7 List of Tables 12 List of Figures 14Chapter 1. Introduction and Background
17
1.1. Forew ord ... 17
1.2. Background on Extended Operating Cycles ... ... 18
1.2.1. Single-Batch Loading ... 18
1.2.2. Extended Cycle Designs ... 20
1.2.3. Economics Analysis ... 20
1.3. Core Design Considerations ... ... 21
1.3.1. Design Constraints ... 21
1.3.2. Goals and Scope ... 22
1.4. Structure of the Document ... 22
Chapter 2. Model Description
25
2.1. Plant D escription... ... 252.2. Computer Code Descriptions... ...25
2.2.1. CASM O-3 ... 28 2.2.2. TABLES-3 ... ... 30 2.2.3. SIMULATE-3 ... 31 2.2.4. FROSSTEY-2 ... 32 2.2.5. Economics Code ... 32 2.3. M odel ... ... 33 2.3.1. Single-Assembly Modeling ... 33 2.3.2. Core Modeling ... 35
2.4. D esign Lim its... ... 36
2.4.1. Neutronics Limits ... 36
2.4.2. Fuel Performance Limits ... 37
3.1. F uel ... 39
3.1.1. Enrichment ... 39
3.1.2. Annular versus Solid Fuel Pellets ... 40
3.2. Poison Selection...42 3.2.1. Burnable Absorbers ... ... 4 2 3.2.2. Gadolinium ... 3.2.2.1 Introduction ... 3.2.2.2 Simple Loading... 3.2.2.3 Duplex Loading ... 3.2.3. Erbium ... 3.2.3.1 Characteristics ... 3.2.3.2 Reported Experience ... 3.2.3.3 Calculations for a Single Assembly 3.2.3.4 Calculations for a Full Core ... 3.2.4. Erbium and IFBA ... 3.2.4.1 Characteristics of IFBA ... 3.2.4.2 Calculations and Results ... ... 4 3 ... 43 ... 44 ... 45 ... 47 ... 47 ... 48 ... 49 ... 52 ... 54 ... 54 ... 54 3.3. Conclusions... ... 57
Chapter 4. Design of Peripheral Assemblies
59
4.1. A pproach ... ... 594.2. Natural Uranium as Radial Blanket ... 60
4.3. Use of Periphery for Two Cycles... 61
4.3.1. M odel ... 61
4.3.2. Results and Discussion ... 62
4.3.2.1 Periphery at 3% U-235 ... 62
4.3.2.2 Natural Uranium in the Outer Rows of Pins. ... 63
4.4. Reflectors of Beryllium ... 64
4.4.1. Introduction ... 64
4.4.2. M odel...65
4.4.3. Results ... 65
4.5. Shuffling Interior Assemblies into the Periphery ... ... 68
4.5.1. M odel ... 68
4.5.2. Results ... 69
4.6. Discussion and Conclusions ... 70
8
39
Chapter 3. Fuel and Poison Selection
5.1. Introduction ... 73
5.2. A xial B lankets...73
5.2.1. M odel ... ... 73
5.2.2. Performance ... 74
5.2.2.1 Comparison of Parameters ... 74
5.2.2.2 Analysis of Axial Shapes ... 76
5.3. Poison Zoning ... ... 79
5.3.1. Model ... 80
5.3.2. Results ... ... 80
5.4. C onclusions... .. 82
Chapter 6. Description of the Thirty-Six Month Core
85
6.1. Loading Pattern... ... 856.2. Core Perform ance ... ... 86
6.2.1. General Characteristics ... 86
6.2.2. Cycle Exposure ... 6.2.3. Core Power Distribution ... 6.2.3.1 Radial Distribution ... 6.2.3.2 Total Peaking Factor ... 6.2.4. Core Boron Concentration ... 6.2.5. Reactivity Related Issues ... 6.2.5.1 Coefficients of Reactivity ... 6.2.5.2 Control Rod Worth ... 6.3. Improvement Margin in the 36-Month Core ... 6.3.1. Elimination of Reactivity Residual Penalty. ... 6.3.1.1 Isotopic Composition of Gadolinium ... 6.3.1.2 Estimate of Residual Penalty ... 6.3.2. Radial Optimization of the Loading Pattern ... 6.3.3. Axial Poison Zoning ... 6.4. Transition Cycle... 6.4.1. Introduction ... 6.4.2. Twenty Four Month Cycle... 6.4.3. Strategies for the Transition Cycle ... 6.4.3.1 Description of Options ... 6.4.3.2 Transition Penalty ... ... 87 ... 88 ... 89 ... 91 ... 92 ... 93 ... 94 ... 94 ... 95 ... 96 ... 96 ... 98 ... 99 ... 101 ... 102 ... 102 ... 103 ... 104 ... 104 ... 104
6.4.4. Physics Analysis for the Transition Cycle. .
73
... 106Chapter 5. Axial Zoning
6.5. C onclusions... 107
Chapter 7. Fuel Performance
109
7.1. General Considerations ... 1097.1.1. Comparison Between 18- and 36-Month Cores. ... 109
7.1.2. Fuel Performance in Extended Cycles ... 109
7.1.3. Goals and Scope of this Analysis ... 110
7.2. Fuel Performance Analysis with an Envelope Pin... 111
7.2.1. Description of the Envelope Pin ... 111
7.2.2. Envelope Pin Power History ... 114
7.2.2.1 Average Pin Power ... 114
7.2.2.2 Conservatism of the Analysis ... 116
7.2.2.3 Peak Pellet Power ... 118
7.2.3. Fuel Centerline Temperature ... 119
7.2.4. Rod Internal Pressure ... 121
7.3. Cladding Corrosion...123 7.3.1. General Considerations ... 123 7.3.2. Model ... 123 7.3.3. Power Histories ... 125 7.3.4. Results ... 128 7.3.5. Discussion ... 130
7.4. Fission Gas Release ... 132
7.4.1. General Considerations ... 132
7.4.2. Description of Release Mechanisms ... 132
7.4.3. Literature Review ... 133
7.4.4. Model for the 36-Month Core ... 134
7.4.5. Results and Discussion ... 137
7.5. C onclusions... ... 138
Chapter 8. Core Economics
141
8.1. Economics of Extended Cycles ... 1418.2. Costs for the 36-Month Cycle ... 142
8.3. Parametric Analysis ... 144
8.3.1. Operational Parameters ... 144
8.3.2. SW U Costs ... 145
8.3.3. Replacement Power Costs ... 147
8.4. Conclusions... 148
Chapter 9. Summary, Conclusions and Future Work
149
9.1. Summ ary ... 149 9.2. C onclusions... ... 151 9.3. Future W ork ... ... 152 9.3.1. Physics Design. ... 152 9.3.2. Fuel Performance ... 155 9.3.3. Additional Remarks ... 156References
...
157
Appendices
Appendix Appendix163
Core and Assembly Detailed Representation. ... Effective Capture Cross Section of Natural Gadolinium at EOC ... 165... 169
Appendix C. Mass of Gadolinium in the 36-Month Core ... Appendix D. Numerical Values for Radial Optimization Analysis. Appendix E. Estimate of Transition Penalty ... Appendix F. Gadolinia in the Fuel Pellet Annulus ... Appendix G. Fuel Performance Effects on Extended Cycles ... Appendix H. Equations for the Cladding Corrosion Model ... Appendix I. FORTRAN Code for the Cladding Corrosion Model . Appendix J. Equations for the Fission Gas Release Model... Appendix K. FORTRAN Code for the Fission Gas Release Model ... 17 1 ... 173 ... 175 ... 179 ... 181 ... 183 ... 189 ... 193 ... 195
List of Tables
Table Table Table Table Table 2-1: 2-2: 2-3: 2-4: 3-1:Operating parameters for a Westinghouse 4-loop PWR ... 26
Varied parameters in CASMO-3 runs ... 31
Input to the economics model (from Ref. [O-1]) ... 33
Operating parameters for reactivity comparisons ... 35
Cycle length for cores with different fuel enrichments (at 3% FOR and 30 days RFO) ... 40
Effect of annular fuel on cycle length and core costs ... 41
Average relative power fraction of the peripheral assemblies ... 62
Core performance with 3% U-235 in peripheral assemblies ... 63
Core performance with RBAs for two cycles ... 63
Core performance with reflectors of beryllium oxide ... 66
Shuffling assemblies into peripheral positions: core performance ... 69
Summary of cases analyzed for the peripheral assemblies ... 71
Comparative performance of the different options for the periphery ... 72
Comparative performance of axial blankets ... 75
Axial composition of the axially zoned rods ... 80
Core performance for cases with and without axial poison zoning ... 81
Comparison of 36-month core neutronics performance to design limits ... 87
EOC burnup for the three groups of assemblies of the 36-month core ... 88
Comparison of coefficients of reactivity for the 36-month and 18-month cores ... ... 95
Isotopic composition of gadolinium and capture cross sections ... 96
Sets of assemblies for the 24-month cycle ... 103
Core performance for the transition and equilibrium cycles ... 107
Comparison of corrosion performance for the 36-month core and the reference core ... 129
Input to the economics model (from Ref. [0-1]) ... 143
Comparison of annual component and total costs in $M/yr using parameters from Table 8-1 ... 143
Isotopic composition of gadolinium and capture cross sections at EOC .. 169
Discharge burnup for groups of assemblies in the 24-, 36-month and transition cycles ... 175
Original fuel worth ... 175 Table 3-2: Table 4-1: Table 4-2: Table 4-3: Table 4-4: Table 4-5: Table 4-6: Table 4-7: Table 5-1: Table 5-2: Table 5-3: Table 6-1: Table 6-2: Table 6-3: Table Table Table Table 6-4: 6-5: 6-6: 7-1: Table 8-1: Table 8-2: Table B.1: Table E.1: Table E.2:
Table G. 1: Summary of unique fuel performance effects on extended cycle
operation as indicated by Handwerk et al. [H-1] ... 181 Table H. 1: Constants used in the Zircaloy oxidation model ... 186 Table H.2: Average properties of the coolant fluid ... 187
List of Figures
Figure 1-1: Burnup-cycle length map for a representative PWR [M-1] ... 19
Figure 2-1: Flow of calculations in CASMO-3 ... 29
Figure 2-2: Core symmetry sections analyzed ... 34
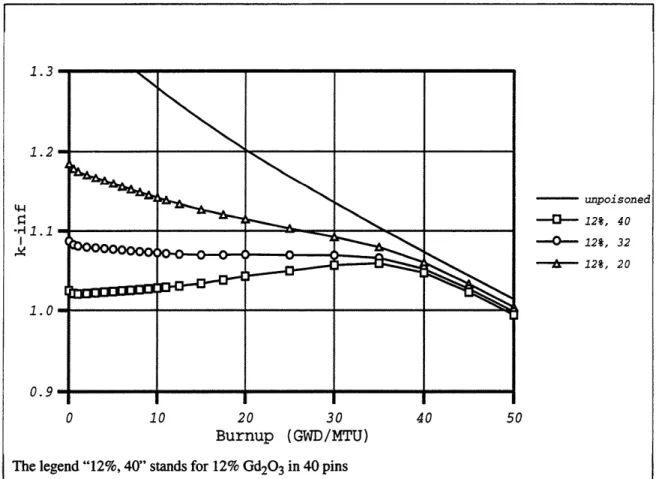
Figure 3-1: Assembly k-infinity for varying number of gadolinia-loaded pins ... 44
Figure 3-2: Assembly k-infinity for varying concentrations of gadolinia ... 45
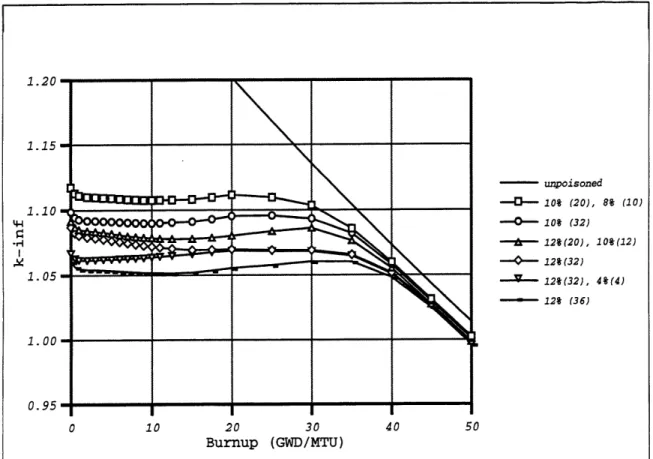
Figure 3-3: Assembly k-infinity for the duplex loading of gadolinia ... 46
Figure 3-4: K-infinity for the assemblies loaded with gadolinia in the 36-month core ...47
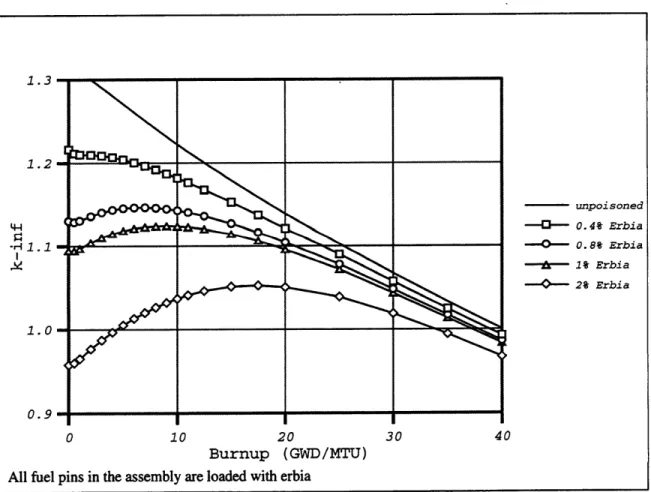
Figure 3-5: Assembly k-infinity for varying concentrations of erbia ... 49
Figure 3-6: Assembly k-infinity for various loadings of erbia ... 50
Figure 3-7: Comparison of assembly k-infinities for different loadings of erbia ... 51
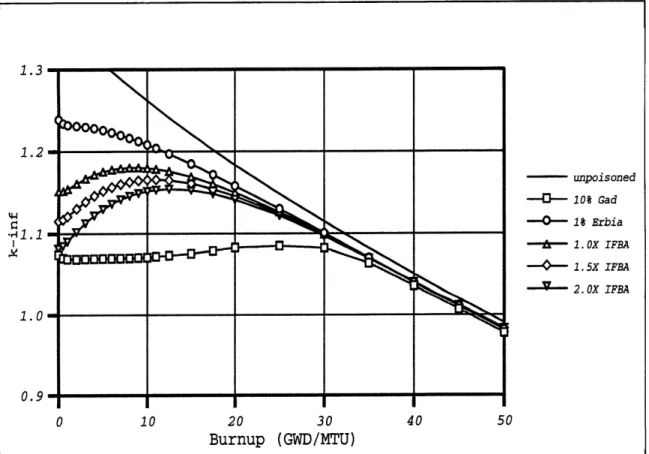
Figure 3-8: Comparison of k-infinities for assemblies with erbia and gadolinia ... 52
Figure 3-9: Effect of the combination of IFBA and erbia ... 55
Figure 3-10: K-infinity of an assembly with erbia and IFBA in varying number of pins 56 Figure 4-1: Loading of assemblies in the core interior for analysis of the periphery ... 60
Figure 4-2: Shuffling scheme for peripheral assemblies ... 62
Figure 4-3: Discharge burnup on an assembly basis for an optimized core with 144 assemblies and a reflector of BeO ... ... 67
Figure 4-4: Scheme to shuffle 44 interior assemblies into the periphery ... 68
Figure 4-5: Assembly discharge burnup for the equilibrium shuffled-to-periphery cycle ... ... ... 70
Figure 5-1: Loading of assemblies in the core used to evaluate axial fuel options ... 74
Figure 5-2: Axial power shapes for axial blankets enriched to 6.5%(left) and 3% (right) ... ... 77
Figure 5-3: Axial representation of the discharge burnup for the central assembly of the core as a function of blanket enrichment ... 78
Figure 5-4: Peaking factors versus burnup for cores with axial blankets with 6.5% and 3% U-235 ... 79
Figure 5-5: Effect of axial poison zoning on power peaks for cases with and without axial poison zoning ... 81
Figure 5-6: Effect of axial poison zoning on the axial power shape ... 83
Figure 6-1: Loading pattern for the 36-month core ... ... 86
Figure 6-2: Assembly average discharge burnup for one eighth core for the 36-month core ... 87
Figure 6-3: Core radial power distribution throughout core life ... 90
Figure 6-4: Evolution of FA for the 36-month and the reference 18-month cycles ... 91
Figure 6-5: Evolution of FQ for the 36-month and the 18-month cycles ... 92
Figure 6-6: Core boron concentration versus cycle duration for the 36-month and 18-month cycles ... 93
Figure 6-7: Natural gadolinium absorption by isotope (from [H-5]) ... 97
Figure 6-8: Cumulative distribution function for the maximum FM. in each assembly 101 Figure 6-9: Schematic representation of options for transition strategy ... 105
Figure 6-10: Assembly average discharge burnup in GWD/MTU for one eighth core for the equilibrium 36-month cycle and the transition cycle (first cycle after last 24-month cycle) ... 107
Figure 7-1: Location and values of the peak pin throughout core life for the three sets of assemblies in the 36-month core ... 13
Figure 7-2: Average linear heat generation rate for the envelope unpoisoned pin ... 115
Figure 7-3: Average linear heat generation rate for the envelope poisoned pin ... 115
Figure 7-4: Conservatism in the envelope pin analysis for the assemblies that are not reused in the 36-month core ... 17
Figure 7-5: Conservatism in the envelope pin analysis for the assemblies that are reused in the 36-month core ... 117
Figure 7-6: Peak linear heat generation rate for the envelope unpoisoned pin ... 118
Figure 7-7: Peak linear heat generation rate for the envelope poisoned pin ... 119
Figure 7-8: Peak fuel centerline temperature for the envelope unpoisoned pin ... 120
Figure 7-9: Peak fuel centerline temperature for the envelope poisoned pin ... 120
Figure 7-10: Rod internal pressure for the envelope unpoisoned pin ... 122
Figure 7-11: Rod internal pressure for the envelope poisoned pin ... 122
Figure 7-12: Simplified power history: rod average power for the 36-month and 18-month reference cores ... 126
Figure 7-13: Axial shapes (local linear heat rate/core average linear heat rate) for the simplified power history in the 36-month core ... 127
Figure 7-14: Axial shapes (local linear heat rate/core average linear heat rate) for the simplified power history in the 18-month core ... 127
Figure 7-15: Oxide thickness versus time at an axial elevation of 300 cm for the 36-month and the reference core ... ... 129
Figure 7-16: Temperature in the metal-oxide interface versus time at an axial elevation of 300 cm for the 36-month and the reference core ... 130 Figure 7-17: Comparison of predicted fractional gas release for the 36-month
Figure Figure Figure Figure Figure Figure Figure Figure Figure 8-1: 8-2: 8-3: 9-1: A.I1: A.2: A.3: A.4: D.1: Figure D.2: Figure L. 1: Figure L.2: Figure L.3: Figure L.4:
and the 18-m onth core ... 138
Influence of the operational parameters on core costs ... 145
Influence of SWU costs on total cycle costs ... 146
Influence of replacement power costs on total cycle costs ... 147
Poisoning scheme for a mixed loading of gadolinia ... 153
Groups of assemblies according to reload strategy ... 165
Rod cluster control assembly pattern ... ... 166
Fuel assembly cross section - 17x17 array ... 167
Interior design for an assembly with 32 poisoned pins ... 168
Peak pin exposure (GWD/MTU) for each assembly in one eighth of the 36-month core ... 173
FH for the assemblies in one eighth of the 36-month core at two steps in core life ... ... ... 174
Comparison of cracked and uncracked fuel pellet centerline temperatures at 10, 30, and 50 kW/m. (from [M-8]). ... 199
Fuel surface temperature as a function of rod power (from [M-8]) ... 200
Fuel centerline temperature measurements showing the effect of initial gap width in helium filled rods (from [G-5]). ... 201
Adjusted fuel centerline temperatures as a function of rod power and burnup ... ... ... 202
Chapter 1
Introduction and Background
1.1 Foreword
The increasing competition in the electricity generation market is forcing nuclear plants to analyze and implement options for reducing their operating costs. One way of cutting costs is to optimize the cycle length so that fuel and O&M costs are minimized.
With this goal in mind, cycle length extensions have been considered and effectively applied. Pressurized Water Reactors (PWRs) that used to operate on 12-month cycles have opted for cycle extensions up to 18-to-24 months. Within the US fleet, 11 PWRs are oper-ating 18-month or longer cycles as of August 1997 [E-1]. The benefit of stretching the cycle length stems from the lower frequency of refueling outages that results in improved capacity factors. However, longer cycles require higher fuel enrichment, and, therefore are burdened with higher fuel costs. The tradeoff between these two opposite trends deter-mines the optimum cycle length.
The decision to increase the cycle length involves more than economics consider-ations. First, longer cycles typically burn fuel at higher power late in life, therefore chal-lenging the mechanical and structural properties of the fuel rods. Second, during refueling outages not only are the new fuel assemblies loaded into the core, but also maintenance tasks are performed. Cycle managers have to consider whether components and equip-ment can reliably operate if maintenance tasks are scheduled after longer intervals.
To date, cycle extensions in PWRs have been moderate, --from 12 to 18 months,-- and only a few plants have opted for cycles between 18 and 24 months. Extension of operating cycles far beyond 24 months may provide an additional economic benefit by significantly improving capacity factors. Research sponsored by the INEEL University Research Con-sortium has examined the technical feasibility of extended cycles up to 48 months, as well as the technical issues that could constrain plant operation and maintenance for such long cycles [G- 1]. This research is focused on cycles that retrofit into currently operating plants and keep the current fuel burnup limits.
This radical increase in cycle length requires an integrated design effort that includes neutronics, fuel performance, economics, and maintenance analyses. From a neutronics point of view, the technical feasibility of extended cycles up to 44.6 months for PWRs was shown by McMahon et al.[M-1]. Fuel performance and economic issues of concern were identified and analyzed by Handwerk et al. in Refs. [H-1] and [H-2] respectively. Moore et al. [M-2] showed that maintenance strategies can support operating cycle lengths up to 48 calendar months. Research by Brodeur et al. [B-1] focused on identifying the sources of Forced Outage Rate (FOR) in nuclear plants and developing methods to improve opera-tional reliability.
For a single-batch reload core --the strategy adopted in Ref. [M-1]-- the cycle length with the lowest operational costs is around 33 calendar months [H-2]. However, the cost curve is quite flat around the minimum with little cost differences in the region ranging from 28 to 38 calendar months.
The purpose of this thesis is to design an economically optimized 36-month reload core for a PWR. The analysis covers 3 main areas: neutronics, fuel performance and eco-nomics. The knowledge acquired from the previous work on extended cycles (l], [M-2], [H-1], [H-2]) is applied here, but the goals and the approach are different. While Ref.
[M-1] is focused on showing the technical feasibility of ultra-long cycles, the present work focuses on determining the most economical solution for a cycle shorter than in [M-1] but under the same design constraints. Although the core costs are a key criterion in the design, selection of a particular design approach is based on both technical and economic considerations.
1.2 Background on Extended Operating Cycles
1.2.1 Single-Batch Loading
The work of Ayoub and Driscoll [A-1] demonstrated that a single-batch reloading was the required strategy for achieving greater than 40-month cycles if the current fuel burnup limits were to be respected. Figure 1-1 shows the fundamental relationships between bur-nup, batch index number, fuel enrichment and cycle length for a typical PWR with a spe-cific power of 38.7 kW/kgU operating with an overall capacity factor of 87%. Current
operation is constrained by the enrichment licensing limit of 5% U-235 and the discharge burnup limit. Cycles between 12 and 24 months can meet these requirements by using batch numbers between 2 and 3. Keeping the burnup limit imposes a severe constraint on extended cycles, and a 48-month cycle will meet this limit only if a single-batch strategy (n=l) is adopted. In that case, the required U-235 enrichment has to be over the current
5% licensing limit.
80000-70000 Future Limit
60000 --- --- - - ..
CL Current Upper Limit n Batch
| Avg. Discharge Burnup
50000
---40000 ... urre... ... ...
BestSest Extended Cycle
SaBatch
Loading30000 ... ..-
.. ..
> 20000 ... ... - ...- - - .. ...
n- 1 Note-. Plots are for a plant
o with a specific power of
10000 ... ... ... . ... ... ./kU 38.7 kW... o..peratji g..
SC--- n= 3 with an overalEcapacity
factor of 87%
Length
0 6 12 18 . 24 30 36 42 48
Cycle Length (Calendar Months)
Figure 1-1: Burnup-cycle length map for a representative PWR [M-1]
A single-batch core lacks the flexibility of fuel management that multibatch cores have since the high reactivity of fresh fuel cannot be balanced with the lower reactivity of assemblies discharged from the previous cycle. An adequate burnable absorber distribu-tion is key to compensate the high initial reactivity of a single-batch core. Moreover, the inability to mix high and low burnup (hence reactivity) assemblies causes some high
bur-nup assemblies to run at higher power over longer periods of time than in multibatch cores, therefore increasing concerns about fuel performance.
1.2.2 Extended Cycle Designs
McMahon et al. [M-1] have proposed core designs for both PWR and BWR extended cycles that show a satisfactory neutronics performance. The PWR reload core achieves a cycle length of 38.8 Effective Full Power Months (EFPM) or 44.6 calendar months when operating at a capacity factor of 87%. The BWR design achieves a cycle length of 45 EFPM or 48 calendar months at the target capacity factor of 93.8%.
The PWR core is a single-batch reload with fuel enriched to 7% U-235. The burnable absorbers are gadolinium oxide (Gd203) and zirconium diboride (ZrB2) --the latter is
commercialized as Integral Fuel Burnable Absorber, or IFBA. This core complies with the physics design limits, although control rods with higher worth are needed to meet the shut-down safety requirements. The fuel performance analysis for this core shows that issues such as fuel stress and strain, rod axial growth, corrosion or internal pressure are exacer-bated in extended cycles when compared to current practice [H-l]. Although some of these factors are not easily quantifiable, solutions have been provided to mitigate the nega-tive effect of cycle extension.
1.2.3 Economics Analysis
Handwerk et al. [H-2] presented a comprehensive analysis of the economic issues related to extended operating cycles and compared partial and total costs for an extended cycle --44.6 calendar months-- and the 18-month reference cycle that represents current industry practice. In this study, the operational parameters are 3% Forced Outage Rate (FOR) and 42 days Refueling Outage (RFO) length for the extended cycle, and 6% FOR and 49 days RFO for the reference cycle. These values yield capacity factors of 93.8% and 85.6% for the extended and reference cycles, respectively. Under these conditions, the extended cycle is about $1M/yr less expensive than the reference cycle. However, when the same operational parameters --3% FOR and 42 days RFO-- are assigned in both cases, this benefit disappears and the extended cycle is more costly by about $11M/yr.
In general, for a fixed batch number, total cycle costs change with cycle length, assum-ing constant FOR (%) and RFO (days). As cycle length increases, total costs decrease,
reach a minimum and finally go up. Total costs include fuel costs, refueling and mainte-nance outage costs and replacement power costs. Increasing cycle length has two effects on costs, considered on an annual basis:
* fuel costs increase because of the higher enrichment required;
* refueling outage and replacement power costs decrease because outages are spaced further apart.
There is an economic tradeoff between these effects which results in a cycle length with optimized, minimum total costs.
Handwerk et al. [H-2] developed a model to determine the optimum extended cycle length. For a single batch core, total costs were analyzed versus cycle length and the min-imum was found to be a 33 calendar month cycle, considering 3% FOR and 30 days RFO. However, the cost curve is quite flat around the minimum, with little cost differences in the region ranging from 28 to 38 calendar months (Fig. 4-8 in [H-2]). The results were found to be fairly dependent on the operational parameters FOR and RFO length. As the opera-tional performance improves, i.e. capacity factor increases, annual costs decrease for both the extended and reference cycles, but the decrease is more significant for the reference cycle. The achievement of increased cycle length requires a technical operating discipline that would concurrently yield shorter FOR and RFO length [G-1], and would provide a larger benefit to the reference cycle. On the other hand, extended operating cycles will be more competitive if fuel costs decrease or replacement power costs increase. In particular, the commercial development of AVLIS enrichment technology may significantly reduce fuel costs, making extended cycles more economically attractive.
1.3 Core Design Considerations
1.3.1 Design ConstraintsSeveral constraints are imposed on this core design. First, since the core design effort aims to improve economics of currently operating PWRs, the core has to be retrofit into current PWR designs. In particular, the applicable reactor parameters are taken from a 4-loop 3411 MWth Westinghouse PWR. Second, this project keeps the current fuel burnup limit for PWRs, which constrains the average burnup of any single pin within the core to
be below 60 GWD/MTU. This limit severely constrains the design options, and, as dis-cussed in Section 1.2.1, requires implementation of the single-batch option. Third, the cycle length was set at 36 months based on the following considerations:
* from a practical point of view, plants have to be available for operation during peri-ods of peak demand, that is, winter and summer, thus limiting the refueling outages to fall and spring;
* the economic optimum from Ref. [H-2] is 33 calendar months, although there is little difference in total costs for cycles between 28 and 38 months.
For this analysis, the FOR of the plant is taken as 3%, and the RFO is 30 days. Current average performance of PWRs is poorer than these parameters. However, these values are taken as best estimates of improved industry performance in the next 5- to 10- year period, when the extended cycles could be implemented. The FOR and RFO length along with the EFPM of the cycle allow determination of the capacity factor and the cycle calendar months, and have, therefore a key influence in the economics analysis.
1.3.2 Goals and Scope
The main goal of this thesis is to design an extended cycle ready for implementation in currently operating PWRs and capable of appealing to utility managers.
More specific goals are:
* determine the optimum fuel type and burnable absorber for this cycle;
* analyze different strategies for the peripheral assemblies of the core, which run at lower-than-average power and are a potential source of savings;
* identify the options to optimize fuel utilization and core economics;
* perform a detailed neutronics analysis for the subject core and show compliance with the design limits;
* maintain the core peaking factors and performance as close as possible to those of the 18-month reference cycle;
* identify possible strategies for further design improvements; * design a transition cycle between a 24- and a 36- month cycle;
* analyze the core fuel performance, and show compliance with design limits; * develop practical tools for analysis of cladding corrosion and fission gas release.
1.4 Structure of the Document
The plant used for the analysis, the computational tools and the models for the core and assemblies are described in Chapter 2. Chapter 3 covers the selection of fuel and
poi-son for the 36-month cycle. Chapter 4 analyzes and compares the options for the periph-eral assemblies. Chapter 5 discusses the axial zoning of both fuel and burnable poison. In Chapter 6, the 36-month core and its neutronics performance are described, the improve-ment possibilities in the core design are identified, and a physics design for a transition cycle from a 24- to a 36-month core is presented. Chapter 7 analyzes the core fuel perfor-mance, with special attention to the cladding corrosion and the fission gas release. The economics aspects of the core are analyzed in Chapter 8. Finally, Chapter 9 summarizes the work, gathers the main conclusions, and identifies the areas where future work is desir-able.
Chapter 2
Model Description
The plant used for this study is a Westinghouse 4-loop 1150 MWe Pressurized Water Reactor. Within the US fleet of reactors, there are 72 operating PWRs, and 27 of them are Westinghouse 4-loop reactors [E-2]. In addition, this class of PWR reactors has the high-est fuel specific power, 38.7 kW/kgU, and thus is the most demanding application. The 36-month cycle presented here is directly applicable to these plants and similar cycles could be considered for PWRs of different design.
In this chapter, the main characteristics of the plant are listed. The computer codes used in the design process are described. Then, general considerations for modeling a sin-gle assembly and a whole core are given. Finally, the design limits used as benchmark val-ues are presented.
2.1 Plant Description
The operating parameters for this analysis are taken from the Seabrook Nuclear Sta-tion in Seabrook, New Hampshire. This plant is currently running on 18-month cycles. Although the cycle length was increased up to 22 months for one cycle, burnup and power distribution considerations have led to a return to the previous 18-month length [R-1]. The values --listed in Table 2.1-- were provided by Yankee Atomic Electric Company [M-l].
Throughout this study, an 18-month reference cycle with the same operating parame-ters is taken as the reference case in order to compare the performance of the 36-month cycle with a cycle representative of current industrial practice.
2.2 Computer Code Descriptions
Several computational tools were used in the design of the 36-month cycle. The neu-tronics analyses were performed with the suite of codes CASMO-3/TABLES-3/SIMU-LATE-3 from Studsvik of America. These powerful, licensing level codes perform high quality calculations and allow an accurate representation of the core physics. The fuel
per-formance analyses were done with the FROSSTEY-2 code from the Yankee Atomic Elec-tric Company. Finally, the economics calculations were performed with an spreadsheet developed by Handwerk et al. [H-3].
Each of the codes is described in the next several Sections.
Table 2-1: Operating parameters for a Westinghouse 4-loop PWR
Operating Parameter Value
Plant
Number of primary loops 4
Total heat output of the core (MWt) 3411
Total plant thermal efficiency (%) 34
Electrical output of plant (MWe) 1150
Energy deposited in the fuel (%) 97.4
Energy deposited in the moderator (%) 2.6
Core
Core thermal inside diameter/outside diameter (m) 3.76/3.87
Mass of fuel U0 2 (MT) 101.0
Mass of fuel as U (MTU) 88.2
Mass of cladding material (MT) 23.1
Rated power density (kW/1) 104.5
Specific power (kW/kgU) 38.7
Average linear heat generation rate (kW/ft) 5.6
Core volume (m3) 32.6
Design axial enthalpy rise (Fa) 1.65
Allowable core total peaking factor (FQ) 2.5
Primary coolant
System pressure (MPa) 15.51
Total core flow rate (Mg/sec) 18.63
Rated coolant mass flux (kg/m2-sec) 2087.6
Table 2-1: Operating parameters for a Westinghouse 4-loop PWR
Operating Parameter Value
Fuel rods
Total number
Fuel density (% of theoretical) Pellet diameter (mm)
Pellet height (mm)
Fuel-clad radial gap width (gim) Cladding material
Cladding thickness (mm) Clad outer diameter (mm) Total fuel height (m) Fuel assemblies
Number of assemblies
Number of fuel rods per assembly Number of grids per assembly Rod pitch (mm)
Overall dimensions (mmxmm) Rod cluster control assemblies
Neutron absorbing material Cladding material
Cladding thickness (mm)
Number of clusters Full/Part length Number of absorber rods per cluster Assembly array Array geometry 50,952 94 8.19 13.4 82 Zircaloy-4 0.57 9.5 3.66 193 264 7 12.6 214x214 Ag-In-Cd Type 304 SS 0.46 53/8 24 17x17 square
2.2.1 CASMO-3
CASMO-3 is a multigroup two-dimensional transport theory code for burnup calcula-tions on BWR and PWR assemblies [E-2]. This code is completely written in Fortran 77. The code reads many parameters by default, therefore simplifying the input file prepara-tion for usual cases.
The CASMO-3 calculation process is shown in Figure 2-1. In the first step, macro-scopic group cross section data are calculated for the fuel assembly using the input data --densities, geometries, composition, operation parameters,-- along with an integrated library of 70 or 40 energy groups.
Effective cross sections in the resonance energy region are calculated for important resonance absorbers (U-235, U-236, U-238, Pu-239) using an equivalence theorem. The resonance region is defined between 4 eV and 9118 eV. The Pu-240 and Pu-239 reso-nances below 4 eV lie in the thermal region where the concentration of thermal groups provides an accurate representation and, therefore, do not require special treatment. Dan-coff factors account for the screening effect between different pins.
Then, a series of microgroup calculations are performed for each type of pin in the assembly using the previous macroscopic group cross sections. Detailed neutron energy spectra are obtained and used to homogenize pin cells and collapse the number of energy groups down to a maximum of 12. The auxiliary MICBURN code provides CASMO-3 with effective cross sections for the fuel pellets when gadolinium is used as burnable absorber in fuel rods.
The two-dimensional transmission probability routine COXY is then used to calculate the flux distribution in a PWR assembly, in a maximum of 12 energy groups. The effects of leakage are considered by using a fundamental buckling mode that modifies the previ-ous results.
For each fuel pin and for each burnable absorber region, isotopic depletion is calcu-lated. Burnup chains are linearized, and 24 fission products, 2 pseudo fission products and
17 heavy nuclides are considered. Depletion is calculated twice in each step, using both
groups PWR o regions ion in groups I r 2D-egons estart file
Sape
61 Data lbrary1
3d lib.
LTap elO 13 F Punch file L Tape 71when burnable absorber rods are involved. The next burnup step considers the average number densities from the previous two calculations.
CASMO-3 produces an output file and a card image file. The output is flexible and includes power distribution, reaction rates, few group cross sections for any region of the assembly, reactivity, discontinuity factors and nuclide concentrations. The card image file is the link with the following code of the suite, TABLES-3.
Assembly cross sections vary with core operational parameters and fuel depletion. In order to account for these changes and obtain an adequate library of cross sections, a set of CASMO-3 branch calculations are performed in the present work. For each of the assem-blies modeled, five input files were prepared which included a base case and several branch cases. For each case, the fuel and moderator temperatures, boron concentration, and boron history were changed. The values for these parameters in the different runs are given in Table 2-2. The control rods were fully withdrawn unless otherwise stated. Calcu-lations are performed at the specified depletion steps.
CASMO-3 performs the calculations for each depletion point using the Base Values indicated in the table. Then, branch calculations are performed using the values of the last column in the table. Assemblies were depleted up to 60 GWD/MTU. The fine mesh estab-lished for these variables insured a detailed library of cross sections.
2.2.2 TABLES-3
TABLES-3 is a data processing code that links CASMO-3 to SIMULATE-3 [S-1]. The code reads the CASMO-3 card image files and generates a library in the format required by SIMULATE-3. The following types of data are processed by TABLES-3:
* two-group cross sections; * discontinuity factors; * fission product data; * detector data;
* pin power reconstruction data; * kinetics data;
2.2.3 SIMULATE-3
SIMULATE-3 is an advanced two-group nodal code for the analysis of both PWRs and BWRs [S-2]. The code is based on the QPANDA neutronics model which employs fourth order polynomial representations of the intranodal flux distribution in both the fast and thermal groups. The code is entirely written in FORTRAN 77.
Table 2-2: Varied parameters in CASMO-3 runs
Parameter Base Value Branches
Base Case
Core Boron Concentration (ppm) 450.0 0, 900, 2000
Moderator Temperature (oC) 310.0 292.7, 326.9
Fuel Temperature (oC) 626.9 292.7, 826.9
Control Rod Position Fully Withdrawn Fully Inserted
0 ppm Boron Case
Core Boron Concentration (ppm) 0.0 450, 900, 2000
Moderator Temperature (oC) 310.0
-Fuel Temperature (oC) 626.9
900 ppm Boron Case
Core Boron Concentration (ppm) 900.0 0, 450, 2000
Moderator Temperature (oC) 310.0
-Fuel Temperature (oC) 626.9
2000 ppm Boron case
Core Boron Concentration (ppm) 2000.0 0, 450, 900
Moderator Temperature (oC) 310.0
-Fuel Temperature (oC) 626.9
Low Moderator Temperature case
Core Boron Concentration (ppm) 450.0
Moderator Temperature (oC) 292.7 310.0, 326.9
In SIMULATE-3, the macroscopic and microscopic cross sections, discontinuity fac-tors, fission product data, and detector data are generated by TABLES-3 after processing the multi-dimensional data from CASMO-3.
SIMULATE-3 performs depletion calculations in two or three dimensions, using 1/8, 1/4, 1/2 symmetry or the full core. The code can be used for fuel management and reload physics calculations. Depleted assemblies from one cycle can be reloaded and shuffled into the next cycle by creation of a restart file. Other code capabilities include reactivity coefficient calculations, criticality searches, and pin power reconstruction.
2.2.4 FROSSTEY-2
FROSSTEY-2 (Fuel ROd Steady-State Thermal Effects) is a state of the art code developed by Yankee Atomic Electric Company [S-3]. Pin specifications, such as materi-als, geometry, fuel composition and pin power history are taken as input values. The code calculates several parameters, including:
* fuel centerline temperature; * gas fraction released;
* hot gap and gap conductance; * clad temperatures;
* ZrO2 thickness;
* fuel pin internal pressure;
* rod gas composition as a function of burnup. 2.2.5 Economics Code
The economics calculations were performed with the model prepared by Handwerk et al. and described in Ref. [H-2]. This model is implemented in a spreadsheet on a PC and it is easily applicable for different core configurations [H-3]. The total operating costs of the plant, appropriately discounted to cycle midpoint, (on an annualized basis) are calculated
as the summation of the following terms:
* fuel costs, including mining, conversion, enrichment, and fabrication costs; * cost of spent fuel, based on the government waste disposal fee;
* material and manpower costs during a refueling outage; * material and manpower costs during a forced outage; * replacement power costs.
Table 2-3 lists the main economics parameters (from Ref. [0-1]) embedded in the model that are common to all the cases analyzed in this thesis. Input values to this model
include plant parameters indicated in Table 2-1 as well as characteristics of each particular core, i.e, the cycle burnup, operational parameters (FOR, RFO) and core composition. The model accepts up to 6 types of fuel pins with 2 axial regions and up to 6 types of assem-blies.
This model provides an acceptably accurate representation of the core costs and com-parisons between different options can be quick and easily performed.
Table 2-3: Input to the economics model (from Ref. [0-1])
Fuel Cycle Economics Parameters Value
Uranium purchase $50/kgU
Conversion $8/kgU
Enrichment $110/kg SWU
Fabrication $ 275/kgU
Waste disposal fee 1 mill/kWhre
Replacement power 25 mills/kWhre
Carrying charge rate 10%/yr
2.3 Model
The design of the 36-month reload core was done in several steps involving analysis and selection of fuel and burnable poisons, peripheral assemblies and axial rod composi-tion. For each of these steps, several options were studied and compared. The optimum solution was retained for each step and incorporated into the 36-month reload core. Com-parison of the options was based on neutronics, economics and fuel performance. For the neutronics analysis, single assemblies and full cores were modeled following the general description given in the next two Sections.
2.3.1 Single-Assembly Modeling
For each type of assembly in the core, an input file was prepared for CASMO-3. The basic geometric parameters required to define the assembly are given in Table 2-1. Input values to CASMO-3 include dimensions and composition of pellets, rods, water holes,
assembly box and spacer grids, pin array structure and dimensions, and operating parame-ters such as fuel and moderator temperatures, boron concentration, and system pressure. Most assemblies were modeled with 1/8 symmetry as shown in Figure 2-2. However, due to the use of special burnable poison distributions and to the asymmetric radial blanket assembly design, some assemblies did not have 1/8 symmetry and were modeled in 1/4 or
1/2 symmetry.
Models of single assemblies were used to screen and select the type and distribution of fuel and burnable absorbers (see Chapter 3). For different assemblies, the two group k-infinities predicted by CASMO-3 were plotted versus the assembly average burnup, and then compared to each other. No branch calculations were performed in this case, since the
purpose was not to create a library of cross sections. The operating parameters used for this application are indicated in Table 2-4. For these conditions, further work indicated that the amount of poison in the core is adequate when loaded with assemblies having k-infinity between 1.05 and 1.12 in the first half of the cycle.
Note in particular that the core boron concentration was set at 450 ppm, to represent an approximate cycle average value. Under these conditions, the assembly becomes subcriti-cal when the k-infinity is below 1, and decreasing the boron concentration would therefore allow the assembly to be critical for a longer period. However, the value of the boron con-centration is irrelevant for this analysis, since the k-infinities are not treated as absolute values, but are only interpreted in comparison to other assemblies that are operating under the same conditions.
Table 2-4: Operating parameters for reactivity comparisons
Parameter Value
Core Boron Concentration (ppm) 450
Moderator Temperature (oC) 310.1
Fuel Temperature (oC) 627
2.3.2 Core Modeling
The model set up for analysis of the core with SIMULATE-3 is described here. The core was modeled in 3 dimensions with 24 axial nodes, and used 1/8 symmetry. Each assembly had 4 radial nodes, therefore providing a more accurate representation and allowing assembly rotation when shuffling. Preliminary analyses for option selection were performed with 2 dimensional models, which retained good accuracy and significantly reduced calculation time.
The core representation included radial and axial reflectors (top and bottom) that account for the coolant and structural materials. In the 2-D models, an input value for the axial buckling accounted for the axial leakage.
The core was analyzed at a condition of steady-state Hot Full Power (HFP) with all the control rods completely withdrawn, and was depleted to End Of Cycle (EOC). At each burnup step, a criticality search was established that adjusted the core boron concentration
(CBC) so that kef= 1. The EOC was determined as the point where CBC=0 ppm. The core was initially free of fission product poisons.
2.4 Design Limits
The performance of the core was analyzed by comparison of neutronics and fuel per-formance parameters to a set of design limits. The technical feasibility of the design is demonstrated if the core complies with these limits. In addition, an effort was made to keep a good margin between the operational parameters and the design limits, so that the core performance is close to that of an 18-month cycle, and has sufficient margin to
accommodate transient situations.
The design limits used for this project are described in the following sections. More details about the neutronics design limits and the impact of extended cycles on design parameters is provided in Ref. [M-1]. The fuel performance limits are also described in
[H-1].
2.4.1 Neutronics Limits
Maximum enthalpy rise hot channel factor (Fg.: defined as the ratio of 1) the axially inte-grated power along the rod with the highest inteinte-grated power to 2) the average rod power in the core. The FAH limit for a Westinghouse 4-loop 1150 MWe PWR is 1.65.
Total core peaking factor (FQ: defined as the ratio of 1) the maximum local rod linear power density in any axial node to 2) the average fuel rod linear power density. The West-inghouse design limit for this core is 2.5.
Core critical boron concentration (CBC): soluble boron in the coolant has a great influence on the primary system chemistry. For the plant considered here, application of the EPRI recommendations [E-3] indicates that the CBC should be kept below 1780 ppm.
Pin burnup: the current licensing limit for burnup in PWRs establishes that the axially averaged burnup of any pin in the core has to be below 60 GWD/MTU.
Coefficients of reactivity: negative fuel temperature coefficient (FTC) and moderator tem-perature coefficient (MTC) are required to insure negative power feedback, and, therefore core stability.
2.4.2 Fuel Performance Limits
Fuel centerline temperature: this temperature has to be kept below the melting temperature for the UO2 under transient conditions, which is a function of burnup and ranges from
2805 OC for unburned fuel to 2613 OC for an exposure of 60 GWD/MTU. Although no limit has been established for steady-state conditions, an adequate margin has to be pro-vided to insure operation below the melting temperature.
Rod internal pressure: the pressure inside the rods increases as fission gases are released. Based on engineering judgment, an operational limit for steady-state conditions is to maintain this pressure below 2600 psia [H-1]. This value is slightly over the primary sys-tem pressure, which is 2250 psia.
Clad surface temperature: high clad temperatures may lead to increased reaction rates of water with zirconium, and the resulting production and pickup of hydrogen. This tempera-ture has to be maintained below 400 oC.
Clad oxide thickness: the US Nuclear Regulatory Commission's Standard Review Plan defines a limit for oxide thickness at 17% of the cladding thickness during accident (LOCA) conditions [N-1]. For this study, an absolute limit will not be established, and the performance for the 36-month core will be evaluated by comparison to the 18-month ref-erence core.
2.5
Summary
The plant parameters for the analysis are taken from a Westinghouse 4-loop 1150 MWe PWR, more specifically those for the Seabrook Nuclear Station. The computational tools for the neutronics and fuel performance analysis are state-of-the-art codes that pro-vide an accurate and reliable representation of the core performance. The economics model allows for quick comparisons between different cores. The main assumptions in the representation of a single assembly and the whole core were presented. Finally, the design limits for selected parameters were presented, which must be met to demonstrate the tech-nical and licensing acceptability of the core.
Chapter 3
Fuel and Poison Selection
3.1 Fuel
In this Section, the enrichment required to operate a 36-month cycle is estimated. Fur-thermore, performance and characteristics of annular fuel are analyzed and its applicabil-ity to the 36-month cycle is assessed.
3.1.1 Enrichment
A preliminary analysis was performed to estimate the approximate fuel enrichment required to achieve a 36-month cycle. Several models were developed in 2-D with CASMO-3/SIMULATE-3 for cores loaded with different fuel enrichments. The cycle bur-nup and EFPM stemming from these calculations bound the maximum cycle length attain-able with the given fuel. The final core design will have a shorter life for two reasons. First, no burnable absorbers were included in the analyses,1 and second, the peripheral assemblies in the final 36-month core are shuffled from a previous cycle, and are hence less reactive than fresh fuel. Use of burnable absorbers in the core reduces the cycle length because of the residual penalty (see Section 3.2.1) and the displacement of fissile atoms.
The average core discharge burnups from SIMULATE-3 are given in Table 3-1 along with the EFPM and calendar months of the cycle for different core enrichments. The EFPM are calculated with the core and operational parameters of this study (see Chapter 8 for equations).
Of particular interest is the core with 5% U-235, since this is the current licensing limit for fuel enrichment. It can be seen that the maximum achievable cycle length for a 5% enriched core is 34.1 calendar months. If a capacity factor of 87% was instead considered, the 5% enriched core would yield 36.9 calendar months. Further analysis showed how-ever, that when the poison residual penalty is taken into account, the resulting cycle length is too short for the purposes of this project.
1. One should note that the peaking factors and levels of soluble boron in an unpoisoned core are expected to be over the design limits.
Table 3-1: Cycle length for cores with different fuel enrichments (at 3% FOR and 30 days RFO)
Enrichment (%) Bd (GWD/MTU) EFPM Calendar months
5.0 37.20 32.1 34.1
5.5 40.88 35.2 37.3
6.0 44.44 38.3 40.5
6.5 47.90 41.3 43.6
Subsequent calculations determined that only a 6.5% enriched core yields a 36 calen-dar month cycle with the operational parameters assigned (3% FOR and 30 days RFO), and the strategy adopted, i.e. gadolinium as burnable poison and a batch number of 1.29 (ratio of total assemblies in the core to new fuel assemblies in each reload).
3.1.2 Annular versus Solid Fuel Pellets
Mechanical and thermal benefits stem from the use of annular fuel pellets instead of solid pellets ([A-1],[S-4], [S-5]). These benefits include:
* increased space for accummulation of fission gas, and, hence reduced rod internal pressure;
* delayed and reduced pellet-clad-interaction (PCI); * lower fuel temperatures;
* lower stored energy in the fuel pins, and therefore benefits for ECCS/LOCA limits. Annular fuel affects the neutronics behavior since the fuel-to-moderator ratio changes. For a Westinghouse plant with 17x17 fuel, annular pellets will only offer an economic benefit if the H/U ratio is more optimum than in the reference core with solid pellets
[M-3], [M-4]. An evaluation performed at B&W indicated that fuel cycle cost benefits are
maximum for annular fuel with about 10% void volume [B-2]. Most reactors operate very near their optimum point, and the effect of annular fuel must be assessed in each particular case [S-5]. It is interesting to note that the Russian VVER-1000 PWR units employ 10% central void annular fuel pellets [P-1] and that this option is available from Western ven-dors such as Siemens [S-4].
The performance of annular fuel with 10% and 20% voids as well as solid fuel was analyzed. First, a single assembly was modeled with 6% U-235 and the results show that the average burnup is very close in the three cases. Then, full cores were modeled with 5% and 6% U-235. The core average discharge burnups and cycle lengths in calendar months are given in Table 3-2. The burnup differences are very small when annular fuel is used instead of solid fuel. For 10% void, the burnup increases about 0.65% and 0.88%, for 5% and 6% U-235, respectively. On the other hand, the content of fissile atoms is reduced by 10% and the cycle lengths are reduced by over 9%. The table also shows the fuel and total costs on a yearly basis. The fuel costs slightly decrease as the void percent increases. However, the total costs are essentially the same.
Table 3-2: Effect of annular fuel on cycle length and core costs
Fuel Void Bd (GWD/ Calendar Fuel costs Total costs
enrichment percent MTU) months* ($M/yr) ($M/yr)
5% 0-(solid) 37.20 34.1 79.5 103.0 5% 10 % 37.44 30.9 78.1 103.1 5% 20 % 37.47 27.6 77.0 103.9 6% 0 - (solid) 44.44 40.5 82.2 103.3 6% 10 % 44.83 36.8 80.5 102.9 6% 20 % 45.03 33.0 79.1 103.0
* at 3% FOR and 30 days RFO
It can be concluded from this analysis that the neutronic and economic benefits of annular fuel for this core are not significant, since the core burnup and the total fuel costs remain virtually unchanged. Moreover, for a given cycle length, a slightly higher enrich-ment will be required if annular fuel is used instead of solid fuel. The interest of annular fuel is, therefore, only linked to its thermal and mechanical benefits. For this core, annular fuel will be only used locally in axial blankets (see Section 5.1) to provide additional space for fission gas release.
3.2 Poison Selection
Selection of burnable absorbers is key to the feasibility of this extended cycle. The high U-235 enrichment in the fresh fuel along with the low batch number (close to 1) results in a considerable positive reactivity, greater than in a multibatch core at BOC and for a long part of the cycle. The excess reactivity is held down by both soluble boron and burnable absorbers. The amount of boron dissolved in the coolant is limited by chemistry considerations to 1780 ppm (see Section 2.5.2), and, therefore, burnable absorbers have to compensate the remaining positive reactivity.
3.2.1 Burnable Absorbers
Burnable absorbers are used to shape the power distribution in the core so that the physics design limits are met and hot spots are avoided. These limits are set to insure that the coolant has the capability of extracting all the energy locally generated in the fuel rods, and the fuel and clad temperatures do not exceed the design limits. Some fuel perfor-mance parameters such as fission gas release or internal pin pressure are closely related to the temperatures attained in the fuel. These parameters have a less favorable behavior as temperature increases. This thesis aims not only to keep peaking factors below limits, but also to maintain them as low as possible, an objective whose achievement relies on an appropriate burnable poison configuration.
The shortcoming of burnable absorbers is the reactivity residual penalty. The concen-tration of burnable absorber is reduced as it captures neutrons, in which process it com-petes with fissile atoms. Towards the last part of the cycle, burnable absorbers are less important or no longer needed, since the excess reactivity can be held down by an accept-able amount of diluted boron, and the less reactive core yields lower peaking factors. However, absorbing isotopes are generated in the neutron capture process (e.g. Gd-157 from Gd-156), producing a residual poisoning. The core reactivity is hence reduced and the core life shortened. Ideally, a burnable absorber for an extended cycle should:
* have a low residual penalty;
* yield low intra-assembly power peaking;
* create a fairly flat reactivity shape throughout core life, thus avoiding undesirable shifts in core power distribution.