HAL Id: hal-02001973
https://hal.archives-ouvertes.fr/hal-02001973
Submitted on 31 Jan 2019HAL is a multi-disciplinary open access archive for the deposit and dissemination of sci-entific research documents, whether they are pub-lished or not. The documents may come from teaching and research institutions in France or
L’archive ouverte pluridisciplinaire HAL, est destinée au dépôt et à la diffusion de documents scientifiques de niveau recherche, publiés ou non, émanant des établissements d’enseignement et de recherche français ou étrangers, des laboratoires
Recirculation cells for granular flow in cylindrical
rotating tumblers
Umberto d’Ortona, Nathalie Thomas, Richard Lueptow
To cite this version:
Umberto d’Ortona, Nathalie Thomas, Richard Lueptow. Recirculation cells for granular flow in cylin-drical rotating tumblers. Physical Review E , American Physical Society (APS), 2018, 97 (5). �hal-02001973�
Recirculation cells for granular flow in cylindrical rotating
tumblers
Umberto D’Ortona∗
Aix Marseille Univ., CNRS, Centrale Marseille, M2P2 UMR 7340, 13451, Marseille, France
Nathalie Thomas
Aix Marseille Univ., CNRS, IUSTI UMR 7343, 13453, Marseille, France
Richard M. Lueptow
Department of Mechanical Engineering,
Northwestern University, Evanston, Illinois 60208, USA and Department of Chemical and Biological Engineering, Northwestern University, Evanston, Illinois 60208, USA
Abstract
To better understand the velocity field and flowing layer structure, we have performed a detailed discrete element method study of the flow of monodisperse particles in a partially-filled three-dimensional (3D) cylindrical rotating tumblers. Similar to what occurs near the poles in spherical and conical tumblers, recirculation cells (secondary flows) develop near the flat endwalls of a cylindrical tumbler in which particles near the surface drift axially toward the endwall, while particles deeper in the flowing layer drift axially toward the mid-length of the tumbler. Another recirculation cell with the opposite sense develops next to each endwall recirculation cell, extending to the mid-length of the tumbler. For a long enough tumbler, each endwall cell is about one quarter of the tumbler diameter in length. Endwall cells are insensitive to tumbler length, and relatively insensitive to rotation speed (so long as the flowing layer remains flat and continuously flowing) or fill level (from 25% to 50% full). However, for shorter tumblers (0.5 to 1.0 length/diameter aspect ratio) the endwall cell size does not change much, while center cells reduce their size and eventually disappear for the shortest tumblers. For longer tumblers (length/diameter aspect ratio larger than 2), a stagnation zone appears in between the central cells. These results provide insight into mixing of monodisperse particles in a rotating cylindrical tumblers as well as the frictional effects of the tumbler endwalls.
I. INTRODUCTION
Horizontal cylindrical rotating tumblers that are partially filled with granular materials are commonly used in industrial processes for mixing, coating, and granulation, and the geometry is considered a canonical system for the study of flowing granular materials [1, 2]. Although granular flow in cylindrical tumblers has long been studied [3–5], it is difficult to experimentally probe the flow beneath the visible free surface whitout the use of complex techniques such as MR, PEPT or X-ray tomography. Consequently, velocity profiles below the free surface are oftenly studied experimentaly in quasi two-dimensional circular tumblers, where the tumbler is only a few particle diameters in axial length, or at a clear endwall of longer rotating drum [6–13], However, the flow near the flat endwalls of the tumbler is strongly affected by the friction between the endwalls and the flowing particles [14–16].
As a result of friction at the endwalls, the flow near the endwalls of a long tumbler differs substantially from the flow midway along the length of the tumbler. Not only is the streamwise velocity near the tumbler endwall slower than that at the center of the tumbler [17], but this reduced mass transport induces a local axial flow near the endwalls [15, 16]. Since particles very near the endwall flow down the slope more slowly than particles further from the endwall due to friction at the endwall, they flow axially away from the endwall in the upper portion of the flowing layer and back toward the endwall in the downstream portion of the flowing layer in order to conserve mass [14, 17, 18]. For a half-filled tumbler, the region that is affected by endwall friction (where particle trajectories are curved) is about D/2 in length from the endwall, where D is the diameter of the tumbler [16, 18]. Moreover, the endwall boundary affects the mixing of monodisperse particles [15] and plays a role in initializing axial segregation bands of bidisperse particles [19–24] near the endwall regions.
By way of comparison, previous studies of half-fill spherical and conical tumblers indicate that the streamwise surface velocity depends on the flowing layer length [18]. Recent studies of flow in partially-filled spherical and conical tumblers have revealed the existence of two recirculation cells in the tumbler [25, 26]. Particles drift axially toward the pole near the surface of the flowing layer with a return flow toward the equator that occurs deeper in the flowing layer resulting in a global circulation of granular material. These two recirculation cells are quite difficult to observe for several reasons. Obviously, the opaque nature of most particles makes it difficult to optically probe the system experimentally below the surface of
the flowing layer, though more sophisticated experimental methods and DEM simulations can overcome this issue. More importantly, the drift induced by the recirculation cells in a 0.14 m diameter spherical tumbler with 2 mm particles is typically on the order of 2 mm or less each time a particle passes through the flowing layer. Consequently, the axial drift and resulting recirculation cells are buried in the noise that comes about due to collisional diffusion as particles flow. It is only possible to extract information from particle motion by considering large volumes of data to obtain statistically meaningful results. But the problem is further complicated by the relatively thin flowing layer (typically O(10) particle diameters thick), making the usual averaging techniques such as binning difficult. Nevertheless, it has been shown using both experiments and DEM simulations that the recirculation cells in spherical and conical tumblers result from both wall friction and tumbler geometry. That is, the roughness of the tumbler wall, varied by comparing a smooth wall with a rough wall constructed of particles, affects the degree of axial drift and the thickness of the flowing layer near the tumbler walls [26]. The shape of the wall (spherical versus conical) also alters the axial drift for the same wall roughness due to a variation in the flowing layer length [25]. In other geometries, secondary flows organized as recirculation cells in the form of stream-wise rolls also occur. In a horizontal channel with lateral walls moving horizontally in op-posite directions, two longitudinal counter-rotating recirculation cells rolls form [27] with particles moving downward near the walls and rising at the center of the channel. Similar results occur in a cylindrical Couette cell where only one recirculation cell arises next to the inner cylinder for either smooth or rough walls with the particles moving down along the inner cylinder wall [27]. For an inclined channel with smooth walls, two or four recirculation cells rolls occur depending on the depth of the flow and the tilt angle [28, 29]. For smaller angles and depths between 12 and 20 particle diameters, two recirculation cells appear as streamwise rolls with particles moving downward at the walls. For shallow depths or higher tilt angles, the sense of rotation of the roll reverses (particles move upward at the walls) or pairs of stacked rolls appear. Finally, for wide channel flows and steep inclines, recirculation cells appear without any lateral walls [30–32].
In this paper, we study recirculation cells in a cylindrical tumbler using the discrete element method (DEM) [33–35]. Unlike spherical and conical tumblers [18, 25], in the cylindrical geometry, the flowing layer length is constant along the axis of the tumbler. With the impact of a variation of the flowing layer length eliminated, the effect of friction
due to the flat endwall on the recirculation cell can be clarified. Our goal is to provide a detailed examination of the three-dimensional flow field, paying particular attention to the axial flow generated from the frictional endwalls and the resulting recirculation cells, which is crucial to understanding the mechanisms of mixing of monodisperse particles [15] and the initiation of axial bands of segregated bidisperse particles [19–23, 36–40] in the endwall regions.
II. DEM SIMULATIONS
For the DEM simulations, a standard linear-spring and viscous damper force model [16, 33–35] is used to calculate the normal force between two contacting particles: Fij
n = [knδ − 2γnmeff(Vij· ˆrij)]ˆrij, where δ and Vij are the particle overlap and the relative velocity (Vi−Vj) of contacting particles i and j respectively; ˆrij is the unit vector in the direction between particles i and j; meff = mimj/(mi + mj) is the reduced mass of the two particles; kn = meff[(π/∆t)2
+ γ2
n] is the normal stiffness and γn = ln e/∆t is the normal damping, where ∆t is the collision time and e is the restitution coefficient [16, 34]. A standard tangential force model [33, 35] with elasticity is implemented: Ft
ij = − min(|µF n ij|, |ksζ|)sgn(V s ij), where Vs
ij is the relative tangential velocity of two particles [41], ks is the tangential stiffness, µ is the Coulomb friction coefficient, and ζ(t) =Rtt0Vs
ij(t′)dt′ is the net tangential displacement after contact is first established at time t = t0. The velocity-Verlet algorithm [34, 42] is used to update the position, orientation, and linear and angular velocity of each particle. Tumbler walls (cylinder and endwalls) are modeled as smooth frictional surfaces with the same properties as the flowing particles and with an infinite mass for calculation of the collision forces between the tumbling particles and the wall.
The horizontal cylindrical tumblers have a radius R = 0.07 m and lengths varying from L = 0.03 to 0.42 m. They are filled to bulk volume fractions from 25% to 50% with d = 2 mm particles. Particle properties correspond to cellulose acetate: density ρ = 1308 kg m−3, restitution coefficient e = 0.87 [35, 43, 44]. The particles are initially randomly distributed in the tumbler with a total of about 5×10⁴
particles in a typical simulation. To avoid a close-packed structure, the particles have a uniform size distribution ranging from 0.95d to 1.05d. The friction coefficient between particles and between particles and walls is set to µ = 0.7. Gravitational acceleration is g = 9.81 m s−2. The collision time is ∆t =10−4 s, consistent
with previous simulations [23, 25, 45] and sufficient for modeling hard spheres [34, 46, 47]. These parameters correspond to a stiffness coefficient kn = 7.32 × 10⁴
(N m−1) [35] and a damping coefficient γn = 0.206 kg s−1. The integration time step is ∆t/50 = 2 × 10⁻⁶ s to meet the requirement of numerical stability [34].
z
x
y’
z’
y
FIG. 1. Set up of the granular system flowing in a 0.14 m length and 0.14 m diameter cylindrical tumbler (not shown) filled at 30% with 2 mm particles randomly colored red and gray. The tumbler cylinder and end-walls are smooth and frictionnal, and the rotation speed is 15 rpm.
Figure 1 shows a typical simulation of granular flow with particles randomly colored red and gray to improve the visualisation. The x-axis is the axis of rotation with the z-axis opposite to g, and the y-axis perpendicular to x and z. The y′ and z′ axes are parallel and perpendicular to the free surface. The origin is at the midlength of the tumbler, though it is offset for the axes shown in Fig. 1. The velocity map throughout the entire domain is obtained by binning particles in a 3D grid and averaging their velocity over time. To have an adequately smooth velocity map, averaging over 50 s of physical time is necessary. The first 20 s of simulation are omitted to assure that steady flow is reached before averaging. Mean particle trajectories are obtained by integrating the velocity based on the velocity map or by averaging individual particle trajectories based on particle positions stored every 0.1 s. Both methods give almost identical results.
III. RESULTS
The flow in a cylindrical rotating tumbler is primarily down the slope of the surface. The secondary flows or recirculation cells and the corresponding axial drift of particles are made evident numerically (and experimentally) by coloring vertical bands of particles to determine their deformation after a few rotations, as was done previously for spherical tumblers [25]. Fig. 2 shows the band deformation obtained in a cylindrical tumbler after exactly 3 passes for all particles through the flowing layer. The bands are shown for 1 mm particles, which more clearly demonstrate the band deformation than coarser 2 mm particles. To understand the band deformation (Fig. 2(b)), one has to remember that the static layer (below the dashed line) is a “stretched mirror” of the particle bands in the flowing layer (above the dashed line). The upper part of the yellow bands near to the endwalls (labelled 1 and 7) are distorted toward the endwalls while the lower parts of the bands, just above the boundary of the flowing layer, have drifted toward the center of the tumbler. Similar behavior has been observed in a spherical tumbler [25, 26]. The difference between a cylindrical tumbler and a spherical tumbler occurs in the bands labelled 2, 3, 5 and 6: they are deformed in Fig. 2(b), but in the opposite direction to the deformation of bands labelled 1 and 7, and in the opposite direction of the bands in a spherical tumbler, suggesting that in cylindrical tumblers, the surface particles that are closer to the center of the axis of the tumbler drift toward the center.
A. Particle trajectories
Another way to study the drift evolution along the cylindrical tumbler is to integrate mean trajectories from the velocity map obtained from the DEM simulations. Fig. 3 shows average particle trajectories for one pass through the flowing layer. The trajectories start from the static zone where particles are in body solid rotation (marked with a star) 3 mm inward from the wall and in the y = 0 plane that includes the axis of rotation. While in the static zone, particles follow a linear trajectory (as seen from the top in Fig. 3) until they reach the flowing layer (uppermost point) and then flow down the slope in the free surface flow following a curved trajectory, except at the center of the tumbler (x = 0), which is a symmetry plane. They then reach the static zone (bottommost point) and again follow a
(a)
(b)
1
2
3
4
5
6
7
2
3
4
5
1
6 7
FIG. 2. Colored vertical slices of particles to show the drift. The tumbler is filled at 50% with 1 mm particles, has smooth walls, and rotates at 15 rpm. (a) Initial vertical bands of particles with the left-front quarter removed to show the vertical slice; (b) particle positions (vertical slice) after exactly 3 passes of the particles through the static zone and flowing layer. The white dashed curve shows the boundary between the static zone and the flowing layer (see equivalent figure for 2 mm particles in supplementary material).
−0.07
−0.06
−0.05
−0.04
−0.03
−0.02
−0.01
0
−0.06
−0.04
−0.02
0
0.02
0.04
0.06
0.08
x (m)
y (m)
FIG. 3. Mean trajectories of 2 mm particles equally spaced (5 mm) along a 0.14 m long cylindrical tumbler filled to 30% and rotating at 15 rpm (looking down the z-axis). Green trajectories have a drift toward the endwall and blue toward the center. The change of drift direction occurs between x= −0.045 and −0.04 m. Only the left half of the tumbler is shown.
linear trajectory. Note that an initial position close to the tumbler cylindrical wall in the static zone corresponds to a particle close to the surface of the flowing layer. An initial position further away from the tumbler cylindrical wall is a particle deeper in the flowing layer.
Two things are notable about these trajectories. First, when in the flowing layer, the trajectories are concave with respect to the endwall. The curvature, defined as the distance from the starting point of the trajectory to the farthest point toward the center, is greatest close to the endwall (x = ±0.07 m) and zero at the center (x = 0). Second, when considering two successive passes through the static zone, the trajectories do not superimpose; instead
there is a net axial drift.
The origin of the curvature of the trajectories is to be found in the friction induced by endwalls [15, 48, 49]. This friction induces a reduction of the velocity profile at the endwall and an increase of the angle of free flow at the endwall. To compensate the flux reduction at the endwall, particules move away from the endwall in the upper part of their flow, and move back at the bottom [15], inducing an axial displacement.
The origin of the drift is less simple. In the sphere, it is due to the interaction of particles with the wall in the lower part of their trajectory (D’Ortona et al.). The friction reduces the second part of the trajectory of the particles flowing near the wall. Particles flowing near the center have to change their trajectory toward the pole to compensate the loss of near-wall particles. This effect can easily be enhanced by increasing the wall roughness. By analogy, one can easily imagine that cylinder endwall will reduce the flux of particles flowing near them, and particles flowing away from the endwall will curve their trajectory to compensate. This possible mechanism is longly discussed in paragraph 3.E.
Similar curvature and drift have been observed in spherical and double cone tumblers [25, 26]. In these geometries, the trajectory curvature is in the opposite direction, concave to the equator, and the drift of the flowing particles at the surface is always toward the poles. Here, the curvature is concave to the endwalls, while the drift is toward the endwall (the poles) for -0.07 m < x < -0.04 m and toward the center for -0.04 m < x < 0 m.
The link between the drift and the curvature of the trajectories is not direct. As just explained, changing the geometry of the drum from sphere to cylinder will revert the direc-tion of the curvature but leaves unchanged the direcdirec-tion of the drift. Furthermore, while moving away from a cylinder endwall, the drift changes sign but not the curvature. In the sphere, changing the roughness of the wall, the rotation speed, the fill level or the size of the particles will also affect drift and curvature, but in a different manner. This suggests that both mechanisms are somehow independent, even though, changing one parameter will affect curvature and drift at the same time.
In the sphere and double cone geometries, the consequence of this drift is the existence of two global recirculation cells [25], one in each half of the tumbler. A similar phenomenon occurs here, except that four recirculation cells are present, two in each half of the tumbler. Fig. 4 shows two separate trajectories starting 3 mm inward from the tumbler cylindrical wall over many successive passes through the flowing layer, indicating the position of the
two recirculation cells in the left-half of the tumbler. The full extent of the recirculation cells would require trajectories at the free surface and touching the tumbler walls. However, this is difficult to accomplish due to the bin-based averaging scheme used here.
−0.07
−0.06
−0.05
−0.04
−0.03
−0.02
−0.01
0
−0.06
−0.04
−0.02
0
0.02
0.04
0.06
0.08
x (m)
y (m)
FIG. 4. Complete recirculation of two particle mean trajectories initially 3 mm away from the cylindrical wall of the tumbler in the left part of a cylindrical tumbler (L = 0.14 m) filled at 30% with 2 mm particles and rotating at 15 rpm. The closed trajectories show the location of the two left recirculation cells, with the drift directions indicated by arrows (upper arrow or surface flow; lower arrow for flow near the bottom of the flowing layer).
The drifts in the two recirculation cells diverge for particles flowing at the surface of the flowing layer (upper arrows in Fig 4), while they converge for particles deeper in the flowing layer (lower arrows in Fig. 4). The recirculation cell adjacent to the endwall is shorter and more “efficient” (relatively large drift), as a complete orbit is obtained in about 100 passes through the flowing layer and the maximum drift for each pass through the flowing layer
around 2.5 mm, similar to that in the spherical geometry of the same diameter [25, 26]. The center recirculation cell is longer and much “weaker” (maximum drift less than 1 mm) so that about 1000 passes through the flowing layer are necessary to close the orbit. In fact, due to the very small drift at the central symmetry plane x = 0, it was necessary to follow a trajectory starting at x = −0.02 m both advancing and going back in time.
To the authors’ knowledge, the existence of recirculation cells near the rotating cylinder endwalls has never been directly observed. Nevertheless, Santomaso and Coll. [15] report an abrupt change of concentration near the endwalls while studying the diffusion along a rotating cylinder. To explain this abnormal diffusion, they assume the existence of “closed-loop zones in the end regions that prevent the axial transport from the middle of the drum but can improve the radial mixing in the sections facing this circulation”. We are convinced that they have obtained in their experiment two endwall recirculation cells without having the possibility to measure them.
1. Cell geometry
To characterize more precisely the recirculation cells, the drift of trajectories after one pass through the flowing layer is measured along the tumbler axis for different initial distances from the cylindrical tumbler wall, as shown in Fig. 5. The drift curves are labelled according to the initial distance of the trajectory from the cylindrical tumbler wall. Trajectories that start further away from the cylindrical tumbler wall correspond to particles deeper in the flowing layer, while trajectories that start close to the cylindrical tumbler wall correspond to trajectories near the surface of the flowing layer. The axial positions where the drift changes sign correspond to the ends of the recirculation cells, approximately at x = −0.04, 0 and 0.04 m. The slight variations of the null drift position around x = −0.04 m and x = −0.04 m with depth indicates that the boundary between endwall and central recirculation cells are not flat vertical planes but are slightly curved. The larger drift for the recirculation cells near the endwall compared to those of the central cells is also evident in Fig. 5.
To see how the recirculation cells are organized geometrically, a displacement vector map is shown for the left half of the tumbler (Fig. 6). The map shows the vector displacement between two successive passes through the flowing layer in the plane perpendicular to the free surface and including the rotation axis (the x−z′ plane). Particle mean trajectories start
−0.002
−0.001
0
0.001
0.002
−0.06
−0.04
−0.02
0
0.02
0.04
0.06
x (m)
drift (m)
3
20
15
10
5
FIG. 5. Drift measured along a 30% full 0.14 m long tumbler rotating at 15 rpm. The initial vertical positions are 3, 5, 10, 15 and 20 mm from the tumbler wall.
from this plane, make a complete revolution, and cross the plane again. The recirculation cell close to the endwall (upper left) is clearly visible while the central cell is more difficult to see due to the small drift (see supplementary material for a drift map where displacement vectors are artificially increased by a factor of 3 to visualize the central recirculation cells). The solid black curve shows the boundary between the flowing layer (above) and the static zone (below). The upper solid blue curve shows the free surface corresponding to a particle volume concentration equal to 0.3, which is about the half of the bulk concentration. Vectors above the free surface correspond to particles flowing in low density regions. The recirculation cell in the lower left is simply the stretched mirror of the upper left one. The dashed lines indicate the approximate boundary between endwall recirculation cells and central recirculation cells, obtained by following two nearby streamlines in each recirculation cell.
-0.07
-0.06
-0.05
-0.04
-0.03
-0.02
-0.07 -0.06 -0.05 -0.04 -0.03 -0.02 -0.01
0
z’ (m)
x (m)
FIG. 6. Displacement vector map measured on a plane perpendicular to the free surface and including the rotation axis. The 0.14 m long tumbler is a 30% full and rotating at 15 rpm. The upper blue curve is the free surface, and the lower black curve is the boundary where the flow velocity is zero (in the laboratory reference frame). The vertical dashed lines indicate the approximate boundary between the endwall and the central recirculation cells.
Note that the position of the center of the upper endwall recirculation cell and its mirror in the static zone are shifted horizontally due to the curvature of the flow trajectories. This also explains why the two boundaries are not perfectly aligned.
This figure is somewhat, though not completely, analogous to the transverse velocity map for secondary flows in shear channels or inclined channels [27–29]. Transverse flows develop near the lateral wall, moving particles downward and by conservation, inducing an upward movement at the other side of the recirculation cell (or roll). The difference here is that the displacements are not the transverse velocity integrated over time, but instead result from a pass through the flowing layer, which is “recorded” in the static zone. Another difference is the existence of a second pair of recirculation cells and their spatial organization. In the shear channel geometry, only one pair of rolls are obtained [27]. In the inclined channel,
when a second pair of rolls emerges, it is above the first pair, in contact with the wall [29]. In the cylindrical tumbler studied here, the pair of central cells are away from the wall, only in contact with the endwall cells.
B. Tumbler length
Figures 4 and 5 show four recirculation cells in a 0.14 mlong tumbler that are about the same size. The same numerical experiment was performed in a 0.28 m long tumbler. Fig. 7 shows that the size of the endwall recirculation cell (green trajectories) is about the same size as that for the 0.14 m long tumbler, while the central recirculation cell (blue trajectories) fills the remaining space.
−0.04 −0.02 0 −0.06 x (m) −0.08 −0.1 −0.12 −0.14 −0.06 −0.04 −0.02 0 0.02 0.04 0.06 0.08 y (m)
FIG. 7. Mean trajectories of particles initially 3 mm away from the cylindrical wall and equally spaced (5 mm) along a 30% full 0.28 m long tumbler. Green trajectories have a drift toward the endwall and blue toward the center.
To confirm this, Fig. 8 shows the drift for particles initially 3 mm from the cylindrical tumbler wall after one pass in the flowing layer in a 0.28 m long tumbler (red curve), compared to that for a 0.14 m long tumbler (green dashed curve that is split and shifted to the endwalls). The two curves perfectly coincide from the endwalls to the first crossing
−0.002
−0.001
0
0.001
0.002
−0.1
−0.05
0
0.05
0.1
drift (m)
x (m)
FIG. 8. Drift measured along a 30% full 0.28 m long tumbler rotating at 15 rpm (red solid curve)). For comparison, the drift measured in the equivalent 0.14 m tumbler has been split and shifted such that the end walls coincide (green dashed curve).
with the x-axis, further demonstrating that the endwall recirculation cells are independent of the length of the tumbler.
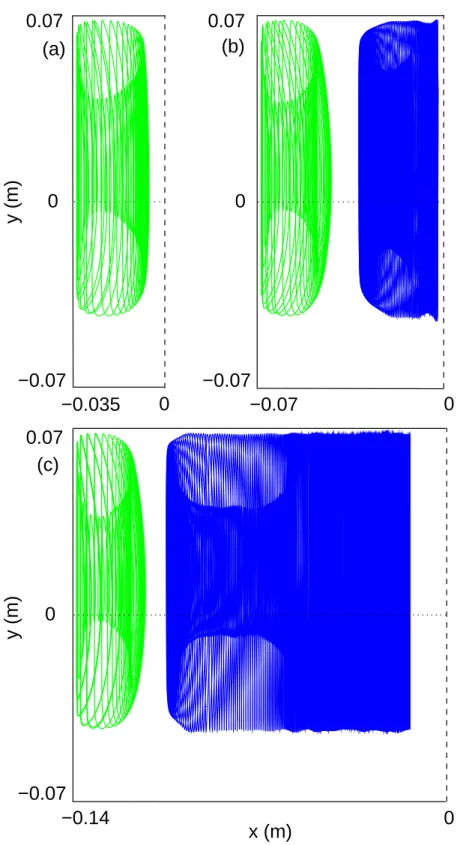
As the tumbler length decreases, the central cells decrease in size and eventually vanish (for lengths below 0.105 m). Fig. 9 shows the left endwall and central recirculation cells obtained in tumblers of length L = 0.07, 0.14 and 0.28 m. In the 0.07 m long tumbler, the central cell does not exist. If the length of the tumbler is further decreased, for example a length of 0.03 m, two endwall recirculation cells still occur. For longer tumblers (Fig. 9(b-c)),
0
0
0
(a)
(b)
(c)
0.07
−0.07
0.07
−0.07
−0.035
−0.07
0.07
−0.07
−0.14
x (m)
y (m)
y (m)
0
0
0
FIG. 9. Top view of the complete recirculation of particles mean trajectories initially placed 3 mm from the tumbler wall in the left part of a cylindrical tumbler filled at 30% with 2 mm particles and rotating at 15 rpm. Lengths are (a) L = 0.07, (b) 0.14 and (c) 0.28 m. The vertical dashed line indicates the center of the tumbler. The trajectories show the location of the 2 left recirculation cells (when they exist). Note that unlike previous figures, the scales for the x− and y−coordinates
the central cell fills the space from the endwall cell to the center of the tumbler.
−0.003
−0.002
−0.001
0
0.001
0.002
0.003
−0.2 −0.15 −0.1 −0.05
0
0.05
0.1
0.15
0.2
drift (m)
x (m)
0.03
0.07
0.14
0.21
0.28
0.35
0.42
FIG. 10. Particle trajectory drift measured for tumblers of increasing length (L = 0.03, 0.07, 0.14, 0.21, 0.28, 0.35 and 0.42 m) with a fill level of 30% and a rotation speed of 15 rpm.
Figure 10 shows the particle trajectory drift for various tumbler lengths. As the tumbler length decreases, the central recirculation cells decrease in size and eventually vanish (for lengths below 0.105 m). For L = 0.105 m, a zone with no drift of about 0.01 m long occurs at the center of the tumbler. If displacement vector maps for endwall recirculation cells are drawn for longer tumbler (see supplementary material for a 0.28 m long tumbler), they nearly perfectly superimpose regardless of tumbler length for lengths greater than 0.07 m.
When looking at the secondary cells of the 0.28 m cylinder, they are composed of an active region with a important drift next to the primary cells, and a second region, farther from the primary cells where the drift decreases while moving away toward the center of the drum. For the 0.21 m cylinder, this decrease is more sharp, but this is due to the central symmetry at x = 0. When the size of the tumbler is further increased (L = 0.35 and 0.42 m),
the active region of the secondary recirculation cells shifts and remains next to the primary cells, suggesting that the secondary cells are a consequence of the circulation in the primary cells. The central region where the drift decays elongates and fills the secondary cells up to the center of the cylinder. No additional pair of recirculation cells appear. Including the central region with no drift in the secondary cells is somehow arbitrary. One could have considered that long enough cylinders are filled with primary cells next to the endwalls, secondary cells next to the primary ones and a central region with no recirculation.
0
0.0005
0.001
0.0015
0.002
0.0025
0.003
0
0.05 0.1 0.15 0.2 0.25 0.3 0.35 0.4 0.45
L (m)
maximal drift (m)
FIG. 11. Maximum particle trajectory drift measured in the endwall cells (red for left, blue for right) versus tumbler length (L = 0.0012 to 0.45 m) for tumblers filled at 30% and rotating at 15 rpm.
Figure 11 plots the absolute value of the maximum trajectory drift of the left and right endwall recirculation cells for increasing cylindrical tumbler lengths. The slight difference between the left an right drift demonstrates the accuracy of the measurement. Two facts are remarkable: 1) For long tumblers, the maximal amplitude of the trajectory drift is nearly constant. With decreasing tumbler length, it passes through a maximum around L = 0.07 m
which corresponds to the size of two endwall recirculation cells. 2) When the tumbler length is further decreased, the maximal trajectory drift approaches zero.
−0.01
−0.008
−0.006
−0.004
−0.002
0
0.002
0.004
0.006
0.008
0.01
−0.2 −0.15 −0.1 −0.05
0
0.05
0.1
0.15
0.2
curvature (m)
x (m)
0.21
0.28
0.35
0.14
0.07
0.03
0.42
FIG. 12. Particle trajectory curvature measured along tumblers of increasing length (L = 0.03, 0.07, 0.14, 0.21, 0.28, 0.35 and 0.42 m) with a fill level of 30% and a rotation speed of 15 rpm.
The particle trajectory curvature shows analogous behaviour with tumbler length (Fig. 12). As the tumbler length decreases, the central region with no curvature decreases in length and eventually vanishes. If the tumbler length is further decreased, the maximum curvature at the endwall monotonically decreases without passing through a maximum unlike the particle trajectory drift. From 0.14 m to 0.07 m, the curvature decreases more rapidly than for longer tumbler, but the slope saturates from a 0.07 m to a 0.03 m long tumbler, while the maximal value of the particle trajectory curvature sharply decreases.
C. Fill level
The fill level can also play a role in the nature of the recirculation cells. For example, in a spherical tumbler, the fill level modifies the curvature of particle trajectories [26]. In the cylindrical tumbler, the fill level modifies the curvature of the trajectories (Fig. 13). The
−0.06
−0.04
−0.02
0
0.02
0.04
0.06
−0.015
−0.01
−0.005
0
0.005
0.01
0.015
x (m)
curvature (m)
25%
30%
40%
50%
FIG. 13. Particle trajectory curvature measured along 0.14 m long tumbler rotating at 15 rpm for fill levels from 25% to 50%.
curvatures along the entire length of the tumbler for the 25% fill level are higher than the curvatures for the 50% fill level. Note that below a fill level of 25%, the particles slip with respect to the smooth tumbler wall. Fig. 14 shows that the drift of particle trajectories is nearly the same for different fill levels. By comparison, in a spherical tumbler, changing fill level from 50% to 20% increases the curvature by a factor of 3 and decreases the drift from a few millimeters to zero [26].
25%
30%
40%
50%
−0.003
−0.002
−0.001
0
0.001
0.002
0.003
−0.06
−0.04
−0.02
0
0.02
0.04
0.06
drift (m)
x (m)
FIG. 14. Particle trajectory drift measured along a 0.14 m long tumbler rotating at 15 rpm for fill levels from 25% to 50%.
The origin of the small influence of the fill level on trajectory drift in the cylinder com-pared to the sphere case is to be found in the endwalls that are vertical in the cylinder. In a sphere, at a fill level near 50%, the particles near the poles flow along a wall that is curved and almost vertical. If the fill level is decreased, this curvature changes, but more impor-tantly, the pole particles flow along a wall that is more and more inclined. This reduces the thickness of the flowing layer, and thus the flux of particles, near the poles. In a cylinder, particles near the endwalls flow along a vertical wall for all fill level. Only the flowing length is reduced while decreasing the fill level. But, this reduction occurs everywhere in the cylin-der and does not affect the relative flux of particles in the cylincylin-der. The weak dependence of curvature and drift on the fill level suggests that in a cylindrical tumbler the fill level would not have a strong effect on the segregation of a bidisperse mixture of particles, though this
deserves further study.
The displacement vector maps give information on the spatial organization of the recir-culation cells (Fig 15). With increasing fill level, the vertical size of the endwall recirrecir-culation cell increases as the thickness of the flowing layer increases to accommodate the higher flow rate due to a larger volume of particles flowing at the same rotation speed. However, the horizontal width of the recirculation region is essentially independent of the fill level. The dashed lines in Fig. 15 indicates that the boundary between endwall and central cells is not always vertical, as is the case for the 30% fill level (Fig. 6).
The results in Figs. 8 and 10 suggest that the central recirculation cells may be constrained to fit the central space left by endwall cells in a 0.14 m long tumbler. To be sure that the weak variation of curvature and drift with fill level (Figs. 13 and 14) is not a consequence of this constraint, the curvature and drift were obtained for a 0.28 m long tumbler (see supplementary material). The variation of drift and curvature measurements with fill level in the longer tumbler remains weak and nearly identical to those obtained in a 0.14 m long tumbler (Figs. 13 and 14). The displacement vector maps for a 0.28 m long tumbler at various fill levels almost perfectly superimpose those for the endwall cells of the 0.14 m long tumbler (see supplementary material).
D. Rotation speed
Finally, we consider the effect of the rotation speed on the drift and curvature in cylindri-cal tumbler flow. Increasing the rotation speed in a sphericylindri-cal tumbler increases the particle trajectory curvature [26]. Fig. 16 shows mean particle trajectories near the left endwall of a 0.14 m long tumbler for rotation speeds ranging from 2.5 to 30 rpm. For both starting po-sitions, the curvature increases with rotation speed. The drift increases with rotation speed for the left trajectories (starting at x = −0.055 m) but for trajectories starting at x = −0.04, the drift changes sign with increasing rotation speed indicating that the boundary between endwall and central cells changes with rotation speed.
Figure 17 shows the trajectory curvature along a 0.14 m long tumbler for various rotation speeds. The curvature increases with higher rotation speed throughout the tumbler. The increase of curvature with increasing the rotation speed may be related to the dependence of the axial segregation of a bidisperse mixture of particles on the rotation speed [20, 39].
-0.04 -0.03 -0.02 -0.01 0 -0.07 -0.06 -0.05 -0.04 -0.03 -0.02 z’ (m) x (m) -0.04 -0.03 -0.02 -0.01 0 -0.07 -0.06 -0.05 -0.04 -0.03 -0.02 z’ (m) x (m) -0.04 -0.03 -0.02 -0.01 0 -0.07 -0.06 -0.05 -0.04 -0.03 -0.02 z’ (m) x (m)
50%
(c)
40%
(b)
(a)
25%
FIG. 15. Displacement vector map of the endwall recirculation cell for various fill levels: (a) 25%, (b) 40% and (c) 50%. The tumbler is 0.14 m long and rotates at 15 rpm. The dashed lines indicate the boundary between the endwall and the central recirculation cells. To reduce overlap, the vector lengths are divided by 2 (the complete displacement map, including the static zone can be found in supplementary material).
−0.04
−0.02
0
0.02
0.04
0.06
−0.06
−0.05
−0.04
−0.03
y (m)
x (m)
30 rpm
2.5 rpm
FIG. 16. Mean trajectories of particles (top view) starting from two initial positions (marked by a star), close to the left tumbler wall, for 6 different rotation speeds (2.5 to 30 rpm). The tumbler is 0.14 m long and 30% full.
Further investigation of the connection between recirculation cells and axial segregation would be worthwhile.
The increase of the trajectory curvature with rotation speed can be understood by looking at the free surface. As expected, the dynamical angle of repose increases with rotation speed. It passes from 25.2◦ at 5 rpm to 32.5◦ at 30 rpm at the center of the drum. At the endwalls,
the dynamical angle of repose is more important. This is due to the friction at the endwall that prevents the free flowing of particles compared to those flowing at the center of the drum. The angle of free flow 3 mm away from the endwalls passes from 28.9◦ at 5 rpm to
38.2◦ at 30rpm. The remarkable fact here is that the difference of angle between endwalls
and the center of the drum increases with rotation speed. As a consequence, the axial displacement is larger at 30rpm compared to 5 rpm.
−0.06
−0.04
−0.02
0
0.02
0.04
0.06
−0.015
−0.01
−0.005
0
0.005
0.01
0.015
x (m)
curvature (m)
2.5 rpm
5 rpm
10 rpm
15 rpm
20 rpm
30 rpm
FIG. 17. Particle trajectory curvature measured along a 0.14 m long tumbler for various rotation speeds (2.5 to 30 rpm) and a fill level of 30% (for a 0.28 m long tumbler, see supplementary material).
In the cylinder, when the rotation speed increases, the trajectory drift increases. This suggests that the loss of particles near the endwall also increases due to a higher friction at the endwalls. This is compatible with the increase of the angle of free flow with rotation speed that is higher next to the endwall compared to the tumbler center. But the cylinder wall should also be considered. Indeed, when replacing the smooth cylinder by a rough cylinder coated with particles (keeping smooth endwalls), the drift strongly decreases showing that the cylinder wall of the tumbler should also be considered. A more complete study on the influence of the roughness on particle trajectories and on recirculation cells is ongoing [50]. The drift increases with rotation speed for the recirculation cells at the endwall (Fig. 18). Furthermore, the endwall recirculation cells grow larger as the rotation speed increases. It is also evident that when the endwall cells are shorter at low rotation speeds, the central
2.5 rpm
5 rpm
10 rpm
15 rpm
20 rpm
30 rpm
−0.003
−0.002
−0.001
0
0.001
0.002
0.003
−0.06
−0.04
−0.02
0
0.02
0.04
0.06
drift (m)
x (m)
FIG. 18. Particle trajectory drift along the length of a 0.14 m long tumbler filled at 30% for various rotation speeds (2.5 to 30 rpm).
cells have more space to expand, resulting in a larger drift amplitude. However, this is only true for the 0.14 m long tumbler. In the 0.28 m long tumbler, the central recirculation cells have nearly the same amplitude of the drift, independent of rotation speed (see Fig. 19). The axial extent of the central cells is nearly independent of the rotation speed, but the cells shift toward the tumbler center to accommodate the larger endwall cells, and the zone with a negligible drift at the center of the tumbler reduces in size.
The displacement vector maps for different rotation speeds show how the recirculation cells change with increasing rotation speed (Fig. 20). The thickness of the flowing layer increases with rotation speed, though this increase is small. Increasing the rotation speed by a factor of 6 results in the thickness of the flowing layer growing by only 30%. The amplitude of the displacement vectors near the endwall and the distance between the center
−0.003
−0.002
−0.001
0
0.001
−0.14
−0.12
−0.1
−0.08
−0.06
−0.04
−0.02
0
drift (m)
x (m)
5 rpm
10 rpm
15 rpm
20 rpm
30 rpm
FIG. 19. Particle trajectory drift along the length of a 0.28 m tumbler filled at 30% for rotation speeds ranging from 5 to 30 rpm.
of the recirculation cell and the free surface are affected very little by the rotation speed. The vertical size of the recirculation cell increases with the thickness of the flowing layer. As a consequence, the drift near the free surface in the direction of the endwall is increased with rotation speed, consistent with Figs. 18 and 19. More importantly, the shapes of the two recirculation cells are affected by the rotation speed. The top of the boundary between the two cells tilts away from the endwall with increasing rotational speed, increasing the region where the drift moves surface particles toward the endwall.
E. Recirculation cell mechanism
The mechanism leading to recirculation cells in a cylindrical tumbler is clearly related to the endwall, but the details are less clear. One possibility is that the mechanism is similar to
-0.04 -0.03 -0.02 -0.07 -0.06 -0.05 -0.04 -0.03 -0.02 z’ (m) x (m) -0.04 -0.03 -0.02 -0.07 -0.06 -0.05 -0.04 -0.03 -0.02 z’ (m) x (m) -0.04 -0.03 -0.02 -0.07 -0.06 -0.05 -0.04 -0.03 -0.02 z’ (m) x (m)
(b)
15 rpm
(a)
5 rpm
30 rpm
(c)
FIG. 20. Displacement vector map of the endwall recirculation cells for various rotation speeds: (a) 5 rpm, (b) 15 rpm and (c) 30 rpm, in a plane perpendicular to the free surface and including the rotation axis. The fill level is 30%. The dashed lines indicate the boundary between the endwall and the central recirculation cells. The blue curves show the free surface (boundary where particle volume concentration is 0.3) and the green curves show the boundary between the flowing layer and the static zone. To reduce vector overlap, the vector lengths are divided by 2.
that for streamwise rolls in a channel with laterally translating sidewalls [27] or an inclined channel with frictional sidewalls [28, 29]. In these cases, it appears that the particles near the sidewalls have a small downward component of velocity [27]. If this was indeed the case in a rotating tumbler, we might expect trajectories for three particles in the flowing layer at different distances from the endwall to look like those sketched in Fig 21(a) in a plane parallel to the endwall (y′− z′ plane) looking toward the left endwall. The particle nearest the wall (shown in red) would experience the greatest shift downward with respect to the flowing layer surface due to a streamwise roll as it traverses the flowing layer. Particles starting further from the endwall (black and blue) would experience a smaller shift downward with respect to the flowing layer surface related to a streamwise roll.
However, an alternate mechanism should be considered. In a rotating tumbler, a particle flowingnear an endwallexperiences a vertical drag due to the wall moving up in the first half of its trajectory in the flowing layer, and moving down in the second half. The amplitude of this velocity is ω r, where ω is the rotation speed and r is the radial position of the particle with respect to the tumbler axis of rotation. In a 0.07 m radius cylindrical tumbler rotating at 15 rpm, this gives a maximal velocity of 0.11 m/s, to be compared with 0.15 m/s, the maximal flowing velocity of particles down the slope near the wall measured in our simulations. Of course, while the particle is flowing along the wall it experiences an upward movement of the endwall in the upstream portion of the flowing layer, compensated by the downward movement in the downstream portion of the flowing layer. If the two effects were symmetrical, no net vertical shift is expected. However, as particle trajectories are curved (Fig. 21d), particles are also moving away from the endwall in the upstream portion of the flowing layer, and in the downstream portion they flow toward the endwall. We might expect that this axial asymmetry favors displacement downward at the endwall. Thus, the trajectories for three particles in the flowing layer at different distances from the sidewall would look like those sketched in Fig. 21(b) in a plane parallel to the endwall. That is, the particle closer to the endwall (red) moves up in the first part of its trajectory and then moves down in the downstream portion of the flowing layer. The particles farther from the endwall (black and blue) have an equivalent movement, but with lower amplitude. Of course, the mechanisms in Figs. 21(a) and 21(b) can be additive.
To explore these mechanisms, mean particles trajectories starting at the same y′ and z′ positions in the flowing layer, but at different distances from the left endwall (∆x = 2, 3
∆ free surface x=2 mm x=3 mm x=4 mm (a) (b) −0.032 −0.028 −0.024 −0.02 −0.04 −0.02 0 0.02 0.04 z’ (m) y’ (m) 0.04 y’ (m) −0.064 x (m) 0.02 0 −0.02 −0.04 −0.068 −0.066 (d) −0.032 −0.028 −0.024 −0.02 −0.04 −0.02 0 0.02 0.04 z’ (m) y’ (m) (c) (e) 15 rpm 5 rpm
FIG. 21. Mean particle trajectories (y′− z′ plane) starting at different distances (∆x) from the left endwall. (a) Sketch of the possible particle movements: the particles simply drift accordingly to their distance from the endwall. (b) The rotation of the wall induces an upward-downward asymmetrical movement inducing a net downward shift. Side view (c) and top view (d) of the mean particle trajectories in a 15 rpm rotating tumbler for 3 particles at increasing distances from the endwall (∆x = 2, 3 and 4 mm). y′ and z′ initial positions are identical. To facilitate visualization, the trajectories are shown in the y′ − z′ plane so that they are nearly horizontal, and the z′ axis is strongly stretched. (e) 3 particle trajectories at a rotation speed of 5 rpm. The arrows indicate the direction of the particle movement. The dotted line indicates the boundary between the flowing layer (solid trajectories) and the static zone (dashed trajectories).
and 4 mm) were determined (Figs. 21(c-e)). In all the cases, the initial position for the particles was slightly below the free surface of the flowing layer. Fig. 21(c) shows that the mean trajectory of a particle near the endwall (∆x = 2 mm = 1d, red) undergoes an upward displacement initially relative to the two particles starting a larger distances ∆x from the endwall and later crosses the two other trajectories (black and blue) indicating a downward movement toward the end of the trajectory. The vertical asymmetry of the trajectory near the endwall indicates that the rotation of the endwall has an influence on nearby particles. Note that the trajectories do not finish at the same point when they reach the bottom boundary of the flowing layer (dotted curve). Instead, the particle trajectory closer to the endwall is reinjected deeper in the static zone compared to the other two trajectories. There is a larger downward shift of the trajectory for the particle nearest the endwall, also visible when the trajectories leave the static zone to turn back in the flowing layer (dashed curves at the right side of Figs. 21(c, e)). For a lower rotation speed (5 rpm), shown in Fig. 21(e), the vertical asymmetry is less marked but still present, so clearly the trajectory of the particle flowing near the endwall is modified by the rotation of the endwall.
Nevertheless, it is not possible to discern from Fig. 21 the possible effect of roll induced secondary flows that produce a downward displacement at the endwall from the possible effect of the asymmetry of the trajectories due to the relative motion of the endwall. Both can induce a vertical displacement in the same direction observed in the vector displacement maps (Figs. 15 and 20). Further study is needed in which, for example, the endwall roughness or the endwall rotation speed are changed.
An attempt has been performed by simply changing the friction coefficient of the endwalls. Modifying the cylinder friction coefficient is not easy since reducing it will change the rolling regime of the granular flow to a slumping regime. Reducing the endwall friction coefficient to µ = 0.3 or increasing to µ = 1.4 instead of µ = 0.7 has only a very weak effect on the size of the recirculation cells and on the drift amplitude (see Fig. XX in supplementary materials). Nevertheless, an ongoing study on rough cylinder shows that using rough walls coated with particles strongly affects the size and the drift amplitude of the convection cells [50]
IV. CONCLUSIONS
In a partially filled rotating tumbler, the frictional lateral walls induce recirculation cells. Even if the endwalls are responsible for the recirculation (through friction and curved trajec-tories), these secondary flows are not localized near the endwalls but fill the entire cylindrical tumbler for tumbler having a length/diameter aspect ratio lower than 2.
Depending on the length of the tumbler, the recirculation flows organize in two or four side-by-side cells. The two endwall cells are essentially constant in size (for long enough tumbler), while the two central cells adapt their size and drift amplitude according to the remaining space, and eventually vanish for short tumblers. In the case of longer tumblers (length/diameter ratio larger than 2), a central zone with no drift appears between the two central cells. In the endwall cells, particles flowing near the surface drift toward the endwall. In the central cells, the surface particles drift toward the center of the tumbler. In both cells, particles deeper in the flowing layer drift in the opposite direction compared to surface particles. In the spherical or conical tumbler systems only two cells are obtained [25, 26], in which particles circulate in the same direction as those appearing at the endwall of a cylindrical tumbler.
Secondary recirculating flows have also been observed in shear flows [27] and in channel flows [28, 29] with particles always drifting downward at the wall for shear flows and drifting downward or upward in an inclined channel depending on the channel angle and the flow thickness. The mechanism of the downward displacement at the wall could be linked to a dilatancy effect [27]. In a cylindrical tumbler, another mechanism could also appear. Near the endwall, flowing particles experience a lateral friction on the wall as in a channel, but also up and down motion due to the endwall rotation. Moreover, particle trajectories are curved (moving away from and then toward the endwalls) leading to an asymmetry of the effects of rotation, as observed in spherical tumblers. All these mechanisms (friction, rotation, curvature) can be responsible for recirculation cells, and further study is necessary to explore these various components and their combination.
The influence of the fill level on particle trajectory drift and curvature as well as the size of the recirculation cells is weak, unlike the spherical tumbler case. This is likely due to the geometry of the tumbler. Indeed, in a cylindrical tumbler, particles flowing near a vertical endwall flow in a way that is largely independent of the fill level. However, in a spherical
tumbler, particles flow along a wall that is more and more angled with a decreasing fill level. Increasing rotation speed increases the particle trajectory drift and curvature and in-creases the size of the endwall recirculation cells. In the case of moderately short tumblers (L ≤ 0.14 m), when central cells are constrained in the space remaining between endwall cells, the rotation speed dereases the size and the maximal drift of the central cells. For longer tumblers, the central cells move away from the endwalls with increasing rotation speed without any further modification. Displacement vector maps show that the boundary between endwall and central cell is essentially vertical at a rotation speed of 15 rpm, but tilts away from the endwall with increasing rotation speed, inducing an increase in the region where particles at the free surface drift toward the endwalls.
One well known phenomenon in a cylindrical tumbler, is the axial segregation of bidis-perse mixtures of particles: the formation of alternate bands of large and small particles. Unlike the spherical tumbler case, in the cylindrical tumbler curvature and drift of the par-ticle trajectories will segregate the surface parpar-ticles toward the endwalls. This is consistent with the formation of bands composed of larger particles near the endwalls [20–23, 39, 40]. As the rotation speed increases the curvature, the drift, and the size of the endwalls recir-culation cells, this should favor axial segregation of larger particles near the endwalls. The decrease of all these parameters with rotation speed may also explain why bands do not form at low rotation speeds [20, 39, 51]. Clearly, further studies with bidisperse mixtures need to be performed to confirm the link between the recirculation cells and band formation for bidisperse mixtures.
ACKNOWLEDGMENTS
This work was granted access to the HPC resources of Aix-Marseille Universit´e fi-nanced by the project Equip@Meso (ANR-10-EQPX-29-01) of the program “Investissements d’Avenir” supervised by the Agence Nationale de la Recherche.
[1] A.W. Nienow, M.F Edwards and N. Harnby, Mixing in the process industries (Butterworth-Heinemann, London, 1997)
[2] A.A. Boateng, Rotary kilns : transport phenomena and transport processes, (Elsevier/Butterworth-Heinemann, Amsterdam; Boston, 2008)
[3] GDR MiDi, Eur. Phys. J. E 14, 341 (2004).
[4] J. M. Ottino and D. V. Khakhar, Annu. Rev. Fluid Mech. 32, 55 (2000). [5] S. W. Meier, R. M. Lueptow, and J. M. Ottino, Adv. Phys. 56, 757 (2007). [6] A. V. Orpe and D. V. Khakhar, Phys. Rev. Lett. 93, 068001 (2004). [7] N. Jain, J. M. Ottino, and R. M. Lueptow, Phys. Fluids 14, 572 (2002). [8] A. V. Orpe and D. V. Khakhar, J. Fluid Mech. 571, 1 (2007).
[9] E. Clement, J. Rajchenbach, and J. Duran, Europhys. Lett. 30, 7 (1995). [10] F. Cantelaube, D. Bideau, and S. Roux, Powder Technol. 93, 1 (1997). [11] G. H. Ristow, Europhys. Lett. 34, 263 (1996).
[12] G. F´elix, V. Falk, and U. D’Ortona, Powder Technol. 128(2), 314 (2002). [13] G. F´elix, V. Falk, and U. D’Ortona, Euro. Phys. J. E 22, 25 (2007).
[14] N. A. Pohlman, J. M. Ottino, and R. M. Lueptow, Phys. Rev. E 74, 031305 (2006). [15] A. Santomaso, M. Olivi, and P. Canu, Chem. Eng. Sci. 59, 3269 (2004).
[16] P. Chen, J. M. Ottino, and R. M. Lueptow, Phys. Rev. E 78, 021303 (2008).
[17] J. E. Maneval, K. M. Hill, B. E. Smith, A. Caprihan, and E. Fukushima, Granular Matter 7, 199 (2005).
[18] N. A. Pohlman, S. W. Meier, R. M. Lueptow, and J. M. Ottino, J. Fluid Mech. 560, 355 (2006).
[19] J. Bridgwater, Powder Technol. 15, 215 (1976).
[20] K. M. Hill and J. Kakalios, Phys. Rev. E 49, R3610 (1994). [21] S. J. Fiedor and J. M. Ottino, Phys. Rev. Lett. 91, 244301 (2003).
[22] P. Chen, J. M. Ottino, and R. M. Lueptow, Phys. Rev. Lett. 104, 188002 (2010). [23] P. Chen, J. M. Ottino, and R. M. Lueptow, New J. Phys. 13, 055021 (2011). [24] U. D’Ortona, N. Thomas, and R. M. Lueptow, Phys. Rev. E 93, 022906 (2016).
[25] Z. Zaman, U. D’Ortona, P. B. Umbanhowar, J. M. Ottino, and R. M. Lueptow, Phys. Rev. E 88, 012208 (2013).
[26] U. D’Ortona, N. Thomas, Z. Zaman, and R. M. Lueptow, Phys. Rev. E 92, 062202 (2015). [27] K.P. Krishnaraj and P. R Nott, Nature Comm. 7, 10630 (2016).
[29] N. Brodu, R. Delannay, A. Valance and P. Richard, J. Fluid Mech. 769, 218 (2015). [30] Y. Forterre and O. Pouliquen, Phys. Rev. Lett. 86, 5886 (2001).
[31] Y. Forterre and O. Pouliquen, J. Fluid Mech. 467, 361 (2002).
[32] T. B¨orzs¨onyi, R. E. Ecke, and J. N. McElwaine, Phys. Rev. Lett. 103, 178302 (2009). [33] P. A. Cundall and O. D. L. Strack, G´eotechnique 29, 47 (1979).
[34] G. H. Ristow, Pattern Formation in Granular Materials (Springer-Verlag, Berlin, 2000). [35] J. Sch¨afer, S. Dippel, and D. E. Wolf, J. Phys. I (France) 6, 5 (1996).
[36] M. B. Donald and B. Roseman, Br. Chem. Eng. 7, 749 (1962).
[37] S. Das Gupta, D. V. Khakhar, and S. K. Bhatia, Chem. Eng. Sci. 46, 1513 (1991). [38] M. Nakagawa, Chem. Eng. Sci. 49, 2540 (1994).
[39] K. M. Hill and J. Kakalios, Phys. Rev. E 52, 4393 (1995).
[40] K. M. Hill, A. Caprihan, and J. Kakalios, Phys. Rev. E 56, 4386 (1997). [41] D. C. Rapaport, Phys. Rev. E 65, 061306 (2002).
[42] M. P. Allen and D. J. Tildesley, Computer Simulation of Liquids (Oxford University Press, New York, 2002).
[43] T. G. Drake and R. L. Shreve, J. Rheol. 30, 981 (1986).
[44] S. F. Foerster, M. Y. Louge, H. Chang, and K. Allia, Phys. Fluids 6, 1108 (1994). [45] N. Taberlet, M. Newey, P. Richard, and W. Losert, J. Stat. Mech. (2006) P07013. [46] C. S. Campbell, J. Fluid Mech. 465, 261 (2002).
[47] L. E. Silbert, G. S. Grest, R. Brewster, and A. J. Levine, Phys. Rev. Lett. 99, 068002 (2007). [48] Boatang
[49] Maneval
[50] U. D’Ortona, N. Thomas and R. Lueptow, in preparation, to be submitted to Phys. Rev. E. [51] T. Arndt, T. Siegmann-Hegerfeld, S. J. Fiedor, J. M. Ottino, and R. M. Lueptow, Phys. Rev.