HAL Id: inria-00292575
https://hal.inria.fr/inria-00292575
Submitted on 2 Jul 2008
HAL is a multi-disciplinary open access
archive for the deposit and dissemination of
sci-entific research documents, whether they are
pub-lished or not. The documents may come from
teaching and research institutions in France or
abroad, or from public or private research centers.
L’archive ouverte pluridisciplinaire HAL, est
destinée au dépôt et à la diffusion de documents
scientifiques de niveau recherche, publiés ou non,
émanant des établissements d’enseignement et de
recherche français ou étrangers, des laboratoires
publics ou privés.
a GridRPC Middleware
Eddy Caron, Frédéric Desprez, David Loureiro
To cite this version:
Eddy Caron, Frédéric Desprez, David Loureiro. All in one Graphical Tool for the management of
DIET a GridRPC Middleware. [Research Report] Inria. 2008, pp.14. �inria-00292575�
a p p o r t
d e r e c h e r c h e
3 9 9 IS R N IN R IA /R R --? ? ? ? --F R + E N G Thème NUMAll in one Graphical Tool for the management of
DIET a GridRPC Middleware
Eddy Caron — Frédéric Desprez — David Loureiro
N° ????
a GridRPC Middleware
Eddy Caron , Fr´
ed´
eric Desprez , David Loureiro
Th`eme NUM — Syst`emes num´eriques Projet GRAAL
Rapport de recherche n°???? — July 1, 2008 —20pages
Abstract: Grid Middleware are the link between large scale (and distributed) platforms and applications. Managing such a software system and the Grid environment itself can be a hard task when no dedicated (and integrated) tool exist. Some can be used through nice graphical interfaces, but they are usually dedicated to one or some limited tasks. They do not fulfill all the needs of a Grid end-user who wants to deploy Grid applications easily and rapidly.
The aim of this paper is to present the case study of an all-in-one software system, designed for the management of a Grid Middleware and gathering user-friendly graphical interfaces answering to the various needs of end-users. Moreover the software system eases the use of the Grid by avoiding the scripting layer under a nice GUI enabling the user a faster and more efficient use of the Grid environment. By this means we demonstrate how the DIET Dashboard fulfills all the needs of a unified tool for Grid management. This paper gives a comparison with existing and well-known tools dedicated to some specific tasks such as Grid resources management, Grid monitoring, or Middleware management.
Key-words: Grid Middleware, Grid management, Grid monitoring, Deployment,
Work-flow management
This text is also available as a research report of the Laboratoire de l’Informatique du Parall´elisme http://www.ens-lyon.fr/LIP.
un Middleware de Grille
R´esum´e : Les intergiciels de grille sont le lien entre les ressources des plates-formes `a large
´echelle (et distribu´ees) et les applications. G´erer un tel syst`eme et l’environnement de grille
en lui-mˆeme est une tˆache compliqu´ee lorsqu’aucun outil d´edi´e est mis `a disposition. Des
outils avec des interfaces graphiques ergonomiques ont ´et´e con¸cus mais ils sont le plus souvent
d´edi´es `a une ou quelques tˆaches pr´ecises, ce qui limite la port´ee de tel outil. L’ensemble
des besoins d’un utilisateur d’un environnement grille ne sont pas couverts pour offrir un d´eploiement des applications port´ees sur la grille de fa¸con simple et efficace. L’objectif de ce rapport est de pr´esenter une ´etude de cas d’un logiciel tout-en-un con¸cu pour la gestion d’un intergiciel de grille comprenant des interfaces graphiques d´edi´ees aux utilisateurs. De plus ce logiciel facilite l’utilisation de la grille en rendant transparente la couche de scripts sous
une interface apportant `a l’utilisateur un usage plus efficace et rapide de l’environnement.
Nous d´ecrivons de quelle fa¸con le DIETDashbord remplit les conditions d’un outil unifi´e. Ce rapport offre ´egalement une comparaison avec des outils existants et reconnus d´edi´es `a
certaines tˆaches sp´ecifiques telles que la gestion des ressources, la surveillance de la
plate-forme ou la gestion de l’intergiciel.
Mots-cl´es : Intergiciel de grille, Gestion de grille, Monitoring de grille, D´eploiement,
1
Introduction
Large problems ranging from huge numerical simulations to large scale data processing can now be solved through the Internet using Grid Middleware software systems. Several approaches exist for porting applications to Grid platforms. Examples include classical message-passing, batch processing, web portals, and GridRPC systems. This last approach implements a Grid version of the classical Remote Procedure Call (RPC) model. A more sophisticated extension of this includes high level scheduling mechanisms and data manage-ment. Thus clients spread over the Internet submit computation requests to a scheduler that locates one or more servers available on the Grid using some performance measure.
The aim of the DIET1
(Distributed Interactive Engineering Toolbox) project is to de-velop a set of tools to build, deploy, and execute computational server daemons. It focuses on the development of scalable Middleware with initial efforts concentrated on distributing the scheduling problem across multiple agents. DIET consists of a set of elements that can be used together to build applications using the GridRPC paradigm. This Middleware is able to find an appropriate server according to the information given in the client’s request (e.g. problem to be solved, size of the data involved), the performance of the target platform (e.g. server load, available memory, communication performance) and the local availability of data stored during previous computations. The scheduler is distributed using several col-laborating hierarchies connected either statically or dynamically (in a peer-to-peer fashion). Data management is provided to allow persistent data to stay within the system for future re-use. This feature avoids unnecessary communications when dependencies exist between different requests.
In a Grid environment, we need several complex tools for the management of resources, Grid Middlewares, and client/server applications. Most Grid software systems use command-line interfaces without any Graphical User Interface (GUI). For the creation of a tool ded-icated to the management of Grid Middleware and Grid environments, different functions are mandatory. We can consider three main graphical interfaces for such framework: one for resource management, one for Grid monitoring, and one for the management of the Grid
Middleware. DIET Dashboard2
answers to the need of an unified set of tools providing the user with a complete, modular, portable, and powerful way to manage Grid resources of the applications that run on it.
The goal of this paper is to show the various aspects to be taken into account for the design of a graphical tool for Grid Middleware management and how it can ease the interac-tion with a Grid by avoiding the scripting layer. Thus we designed a tool to make the Grid as user-friendly as possible, in order to simplify its use. Many GUI tools dedicated to Grid management exist but they are all targeting one or two tasks. The aim of the DIET Dash-board is to provide an all-in-one and flexible software that gathers these tools in an efficient manner. We give a comparison with existing tools dedicated to some specific tasks such as Grid resources management, Grid monitoring, or Middleware management. By this way we
1
http://graal.ens-lyon.fr/DIET 2
demonstrate how the DIET Dashboard fulfilled all the needs of an unified tool making it easy to manage a Grid Middleware on Grid platforms.
The rest of the paper is organized as follows. In Section 2, we briefly review existing
works on graphical tools for the Grid. Sections3and4describes the architectures of DIET
and DIET Dashboard. Section4.1presents the features related to the Grid resources
man-agement of DIET Dashboard. Section4.2presents the features of DIET Dashboard related
to Grid monitoring. Section4.3 describes how it can manage the DIET Grid Middleware.
To illustrate the use the DIET Dashboard, we present an experiment in Section5. Finally,
Section6 concludes the paper.
2
Related Work
In this paper we focus on graphical tools designed for Grid environments. Here we will give a description of the three main families of tools dedicated to Grid Middleware software systems and Grid environments.
The first family concerns graphical tools for cluster resource management. They provide a Graphical User Interface (GUI) to check all information from batch schedulers. For example,
QMON [16], the GUI designed for N1 Grid Engine from SUN, can examine the properties
of any queue on the Grid (running, disabled, suspended, etc.). A second graphical menu provides a job submission interface with all the options available. A third interface monitors the jobs status (running, suspended, deleted, pending, etc.).
To illustrate the second family, we can consider Ganglia [12], the graphical tool designed
for Grid monitoring. Based on a protocol using announces, this tool monitors a cluster or a set of clusters using XML, XDR and RRDtool to represent, retrieve and display the data. For each node Ganglia provides instantaneous information and history about the load, memory, I/O, etc. through a web interface.
The third family concerns tools designed for Grid Middleware software systems. Many
tools exist for the visual specification and execution of scientific workflows as Kepler [1],
Taverna [14], SGSDesigner [10], ScyFlow [13], or GridNexus [4]. For example, GridNexus
is a graphical system for the creation and the execution of scientific workflows in a Grid environment. The user can assemble complex processes involving data retrieval, analysis and visualization by building a directed acyclic graph in a visual environment. Future works talk about the use of GridNexus to help creating and deploying new Grid services in addition to scripting existing services. This project plans to develop a generic module to provide interactive feedback while executing a workflow.
Graphical tools mentioned here are all designed with a specific aim. DIET Dashboard combines workflow management, resources reservation, resources mapping, automatic con-figuration, visualization, and deployment tools in one integrated graphical application.
3
DIET Architecture
The DIET component architecture is structured hierarchically for an improved scalability. Such an architecture is flexible and can be adapted to diverse environments including
arbi-trary heterogeneous computing platforms. The DIET toolkit [7] is implemented in CORBA
and thus benefits from the many standardized, stable services provided by freely-available and high performance CORBA implementations. CORBA systems provide a remote method invocation facility with a high level of transparency. This transparency should not affect the performance substantially, as the communication layers in most CORBA
implementa-tions are highly optimized [8]. These factors motivate their decision to use CORBA as the
communication and remote invocation fabric in DIET.
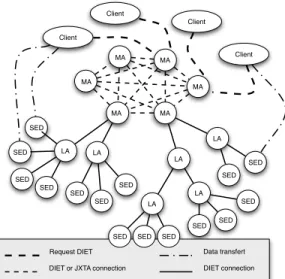
The DIET framework comprises several components. A Client is an application that uses the DIET infrastructure to solve problems using an RPC approach. Clients access DIET through various interfaces: web portals or programs using C, C++, or Java APIs. A SeD, or server daemon, acts as the service provider, exporting a functionality through a standardized computational service interface. A single SeD can offer any number of compu-tational services (depending on the capacity of the machine). A SeD can also serve as the interface and execution mechanism for either a stand-alone interactive machine or a parallel supercomputer (or cluster) using an interface with a batch scheduler. The third component of the DIET architecture, agents, facilitate the service location and invocation interactions between clients and SeDs. Collectively, a hierarchy of agents provides higher-level services such as scheduling and data management. These services are made scalable by distributing them across a hierarchy of agents composed of a single Master Agent (MA) and several
Local Agents (LA). Figure1 shows an example of a DIET hierarchy.
4
DIET Dashboard
When the goal is to monitor a Grid, or deploy a Grid Middleware on it, several tasks are involved.
Managing the resources of a Grid: allocating resources, deploying nodes with several
operating systems, etc.
Monitoring the Grid: getting the status of the clusters (number of available nodes
in each state, number and main properties of each job, Gantt chart of the jobs his-tory), the status of the jobs (number, status, owner, walltime, scheduled start, Ganglia information of the nodes) running on the platform, etc.
Managing the Grid Middleware software system within a Grid environment: designing
hierarchies (manually or automatically by matching resources on patterns), deploying them directly or through workflows of applications, etc.
DIET or JXTA connection Data transfert DIET connection Request DIET Client MA MA MA MA SED LA Client Client Client SED SED SED SED SED LA SED SED LA LA SED SED SED MA MA LA SED LA SED SED SED
Figure 1: DIET hierarchical organization.
The DIET Dashboard provides tools trying to answer these needs with an environment dedicated to the DIET GridRPC Middleware. It consists of a set of graphical tools that can be used separately or together. These tools can be divided in three categories:
1. Workflow tools: including workflow designer and workflow log service. 2. DIET tools: including tools to design and deploy DIET applications.
3. Grid tools (aka GRUDU3
): these tools are used to manage, monitor and access user Grid resources.
4.1
Grid Resources Management
When deploying an application over a Grid a user should be able to allocate resources for computation tasks by specifying the number of nodes needed, the duration of the jobs (also called walltime), the date when each job will start, their priority, etc. But they should have the possibility to choose between the default environment of the node and a user-defined one if the parallel implementation or even the default operating system provided (for example) does not fit the application needs. This management should be easy to realize in order to improve the Grid usage.
The following sections present how the Grid resources management was designed in the DIET Dashboard and an existing software dedicated to Sun Grid Engine called QMON.
3
4.1.1 DIET Dashboard functionalities
The Grid resources management is realized inside GRUDU, the Grid resources module of DIET Dashboard. GRUDU can be easily configured to use different batch schedulers, or different Grids. GRUDU can be used inside DIET Dashboard, but also in a standalone mode for users that just want to monitor, manage, or realize reservations on the Grid.
Grid’5000 4
[3] project aims at building a highly reconfigurable, controlable and
mon-itorable experimental Grid platform gathering 9 sites geographically distributed in France featuring a total of 5000 processors. The main purpose of this platform is to serve as an experimental testbed for research in Grid Computing.
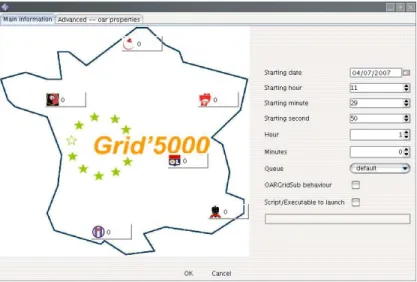
To allocate resources on Grid’5000, the resource tool offers a user-friendly interface al-lowing the selection of the number of nodes needed at each site, and the definition of the date, walltime of reservation and the queue where the job will be started. The user can select a job type (for example, deploy if you plan to change the operating system) for the
reservation itself and launch a script on the reserved resources (see Figure2). Concerning
the clusters, the OAR batch scheduler5
[5] uses properties for the reservations (for example,
to select nodes with Myrinet interfaces) and the allocation tool provides an interface for the definition of these properties.
Figure 2: Resources allocation
To manage resources, the user can deploy images on nodes with the operating system needed for the computations. The resources tool also provides a GUI for the deployment of
4
https://www.grid5000.fr 5
images over Grid’5000 clusters through Kadeploy6
[9]. (The deployment through Kadeploy
allows the user to have its own operating system that he/she can tune and configure as he/she wants.) The nodes and the images (if the user plans to deploy on different clusters,
one image per cluster) needed for the experiment (see Figure3).
Figure 3: Image deployment through KaDeploy.
4.1.2 Comparison with QMON
QMON is the GUI to the N1 Sun Grid Engine (SGE) [16]. It provides an interface for the
job submission and the resources management of a Grid and the SGE batch scheduler.
QMON allows the user to submit either simple or parallel jobs on queues7
that are run in a passive and non interactive mode. The users can then monitor the jobs and the Grid status. But QMON does not provide an access to the computation nodes for interactive work, and a specific system can not deployed to get a user-defined system for the duration of the reservation. Moreover, to use different queues, the user must use a parallel job with a defined parallel environment such as MPI or PVM, whereas different nodes can be used on different clusters without the mandatory use of some parallel environment with OAR and the DIET Dashboard.
6
http://kadeploy.imag.fr/ 7
4.2
Grid Monitoring
Grid monitoring is important for a default user before he reserved resources, but also after he has reserved resources. Before submitting any job to a Grid, the user should be aware of the available nodes considering their states (free/already used/dead). Whenever there is not not enough resources, the user should be able to know when these will available for computation. After having successfully submitted some jobs, the user should have some interface to get the information about his jobs but also the other jobs running on the Grid. Even if sometimes more information could be interesting for expert users, too lower level information could be unusable for the default user who only wants to perform computations on some resources for a given period of time.
The following sections will present how the Grid monitoring is implemented within the DIET Dashboard and an existing software dealing with the monitoring called Ganglia.
4.2.1 Functionalities of DIET Dashboard
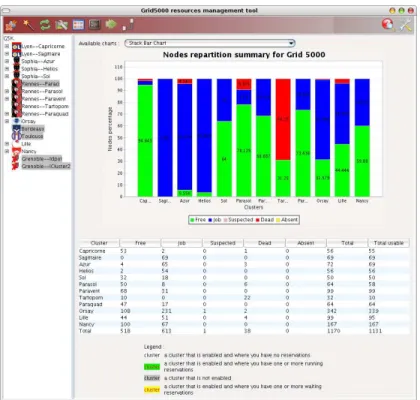
Thanks to the resource tool we can monitor the state of the platform with charts presenting the load of the different clusters, the state of all clusters and all the users’ jobs on the Grid
(see Figure4).
We are also able to monitor the status of a particular cluster with charts summarizing the nodes states and a table composed of the jobs (running or waiting) on that cluster. A Gantt chart is also available helping the user to define when he can reserve some resources. The resource tool also provides the user with all necessary information about every job that are present on a cluster, with, among others, the job Name, the job State, the job hosts, etc.
Finally a plugin generates instantaneous data and history concerning the main metrics (the CPU load, the disk/memory/swap used, the in/out bytes, etc.) of the user reserved nodes with information taken from the Ganglia data.
4.2.2 Comparison with Ganglia
Ganglia is a scalable distributed monitoring system for high-performance computing systems such as clusters and Grids. Ganglia provides resources usage metrics (memory, CPU, jobs...) for individual sites or whole Grids. These are low level and can be used to monitor the hardware of sites of whole Grids.
But Ganglia does not provide information of higher level such as the node states, the available resources of clusters or the information about the jobs existing in the clusters. From an user point of view that needs to reserve resources and realize some computations on that nodes, the information about the jobs and the clusters in DIET Dashboard can be sufficient, whereas the ones from Ganglia can be useless because of a too lower level for a standard use. These informations are to be considered as a complement to the monitoring part of the DIET Dashboard (and it is moreover the purpose of a plugin as described in
Figure 4: Grid’5000 Grid status.
4.3
Grid Middleware Management
When using a tool managing Grids and Grid Middleware such as DIET, a user expects features such as the design a hierarchy of Middleware elements, the remote deployment of locally created hierarchies, or the discovery of online existing and usable services for further use in workflows. Others functionalities can also be offered like log service or real-time execution for running workflows, or resources dependent generation of hierarchies according to predefined existing models. The following sections present how the Grid Middleware management is implemented in the DIET Dashboard as well as an existing software with monitoring features called GridNexus.
4.3.1 Workflow tools
Workflow designer A large number of scientific applications are represented by graphs of tasks which are connected based on their control and data dependencies. The workflow paradigm on Grids is well adapted for representing such applications and the
interest in workflow management within the Grid community. The success of this paradigm in complex scientific applications can be explained by the ability to describe such applications in high levels of abstraction and in a way that makes it easy to understand, change, and execute them.
Several techniques have been established in the Grid community to define workflows. The most commonly used model is the graph and especially the Directed Acyclic Graph (DAG). Since there is no standard language to describe scientific workflows, the description language is environment dependent and usually XML based, though some environments use scripts. In order to support workflow applications in the DIET environment, we have developed and integrated a workflow engine. Our approach has a simple and a high level API, the ability to use different advanced scheduling algorithms, and it should allow the management of multi-workflows sent concurrently to the DIET platform.
In this context, a workflow designer was developed to help users to design workflow
applications but also to execute them. Figure 5(a) shows an overview of this tool,
where they can have a description of the available services (discovered with online mode) and design a workflow by a drag and drop mechanism. The user does not need to know details about the requested services neither to define them. Once the workflow designed, one can either save it to an XML format supported by the DIET workflow engine or execute it directly. In the second case, the workflow input must be defined. The XML representation of designed workflows describes required tasks and data de-pendencies. A task is a DIET service and a data dependency is a link between two parameters. The workflow designer checks and guarantees data type compatibility between source and target ports of each created link.
The workflow description level used here is known as “abstract description”. This level of description does not include any runtime information but is sufficient for the workflow execution. DIET hierarchy and workflow engine manage automatically and transparently the user tasks scheduling and execution.
Workflow log service To improve workflow monitoring, we propose a tool dedicated to workflow monitoring that displays the real-time execution processes of different work-flows. This graphical tool has two major roles: first it is a central event service that receives and handles the events related to tasks execution progression. Secondly it
provides a graphical representation of workflow state. This tool, shown in Figure5(b),
displays the different workflows after they start their execution. Each node of the workflow can be in one of the following states: “waiting”, “running”, or “done”.
4.3.2 DIET tools
A DIET platform can be represented by a hierarchy of agents and servers. Designing and deploying such a hierarchy of distributed and heterogeneous elements can be a hard task for
(a) Workflow designer (b) Workflow log service
Figure 5: Workflow tools.
platforms. This format describes a DIET hierarchy but also the information about used resources and environments.
Figure 6: DIET designer.
To deploy DIET hierarchies on a Grid environment the DIET Dashboard provides two methods:
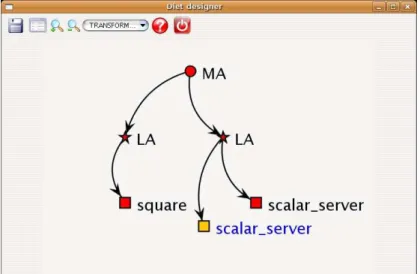
In two steps: First the user creates by hand his DIET hierarchy with the DIET designer. Instead of manipulating complex XML files, the user simply adds Local Agents or Server Daemons to the Master Agent or already added Local Agents. Concerning
the Server Daemons you can define the binary to launch, the input parameters etc. This level describes only the application level, and the obtained application description can be extended with runtime information. The main frame of the DIET designer is
presented in Figure 6.
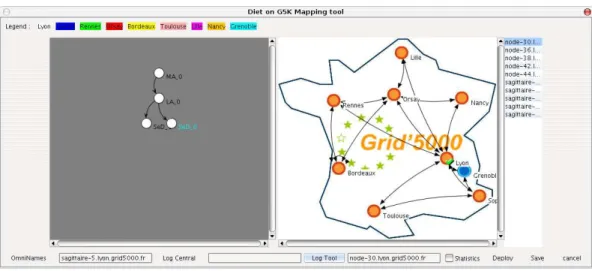
To extend this application level hierarchy the user should use the DIET mapping tool
(see Figure 7). This tool allows the user to map the allocated Grid’5000 resources
to a DIET application. For each Grid’5000 site, the nodes (or hosts) are used in a homogeneous manner but the user can select a particular host if needed.
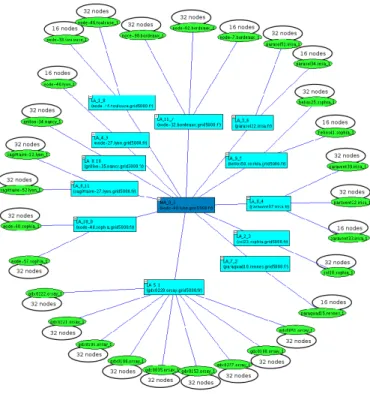
in one step: The XMLGoDIETGenerator builds a GoDIET XML file that can be used with the DIET deployment tool from a compact description and a reservation directory. For large experiments, writing the GoDIET file by hand is time consuming and if the user should redo this experiment with a different set of machines, the GoDIET file will be generated according to the available resources.
The way hierarchies are described (through a framework from which their are created according to the available resources) have also to be the most flexible to let the user write all possible hierarchies. One should notice that the XMLGoDIETGenerator is “resources driven” because the final hierarchy will directly depend on the available resources provided, whereas the ones created with the DIET designer and mapping tools will not change if there is more or less available resources.
Figure 7: DIET mapping Tool.
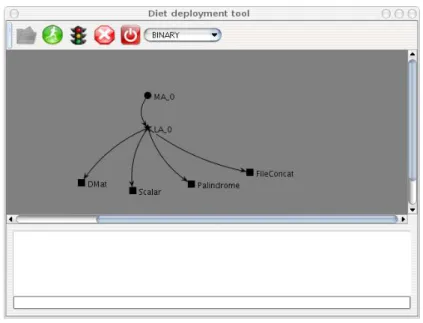
When the DIET hierarchies are generated the user can deploy these hierarchies on the
GoDIET. It provides the basic GoDIET operations: open, launch, stop, and also a monitor-ing mechanism to check if DIET application elements are still alive (the states are the same as for the workflow log service). As the workflow log service, the DIET deployment tool can be used in a local or a remote mode.
Figure 8: DIET deployment tool.
4.3.3 Comparison with GridNexus
GridNexus provides a GUI for the workflow construction and execution. This interface is a “Drag and Drop” environment that can be used to build workflows from generic Grid and web services. The output is XML-based and easy to modify or use from specialized tools around GridNexus. The user designs the workflow by linking elements as for the workflow designer of DIET Dashboard. After having designed the workflow it can be run and the user can see the results of the workflow or get the corresponding script of the workflow. The workflows can be abstracted to simplify the workflow design. These “composites” can then be used as elements of other workflows. GridNexus comes with a library of pre-defined elements that can be used from the GUI, but we can also generate workflows from URL of WSDL that define services.
However GridNexus does not show the evolution of the workflow execution, and it does not provide some log functions in order to prevent from services failures or anything else. Moreover GridNexus does not discover online services but the user should provide him the services which could be complicated for the end-user that might not know where those
services are located. Finally GridNexus only manages workflows of tasks, and does not allow the user to design and execute her/his own hierarchies of elements, in order to later execute clients (the ones that are not workflows of executions) on computations nodes.
5
Experiments
An experiment has been realized to test the capabilities of DIET and DIET Dashboard for a large number of machines. This experiment has been realized on Grid’5000, and the chosen application was cosmological computations. For this experiment, the entire Grid’5000
platform was reserved8
which gave us 12 clusters used on 7 sites for a duration of 48 hours. Finally 979 machines were used with an user-defined environment containing all the needed
software for the experiment. Figure 9 gives a bar chart representing the occupation of
the cluster with the jobs for the experiment, taken from the resources tool of the DIET Dashboard.
The aim of the experiment was also to start the largest machines reservation over the Grid, for the deployment of the largest DIET hierarchy in order to execute the maximum number of cosmological application jobs. The MPI code executed by the DIET servers called
RAMSES9
[17] was developed in Saclay (DAPNIA/CEA) to study large scale structures and
galaxies formation. This code is a Grid-based hydro solver with adaptive mesh refinement.
Figure 9: Chart representing the occupation of the different clusters and the node repartition between the different job states (Free/Job/Dead/Absent).
8
among the uncrashed nodes.
9
Thanks to GRUDU, reservations were done at the Grid level and not on each cluster in 20 seconds. To get an user-defined environment on each machine, GRUDU was able to realize the deployment of every machines of the 12 clusters involved at the same time in roughly 25 minutes. Finally the DIET hierarchy was created through the use of the XML-GoDIETGenerator in 5 seconds and deployed through the DIET Deploy tool and GoDIET in 23 seconds.
If theses tasks would have been done without GRUDU:
the reservation would have been realized with oargridsub (a non-graphical utility
dedicated to OAR) by hand by reserving every nodes of each cluster at a time. Here is a dummy example of oargridsub command:
oargridsub cluster1:rdef="nodes=2",cluster2:rdef"nodes=1",cluster3:rdef="nodes=1", cluster4:rdef="nodes=2",cluster5:rdef"nodes=1",cluster6:rdef="nodes=1", cluster7:rdef="nodes=2",cluster8:rdef"nodes=1",cluster9:rdef="nodes=1", cluster10:rdef="nodes=2",cluster11:rdef"nodes=1",cluster12:rdef="nodes=1", -s ’2007-09-07 16:00:00’ -w ’0:10:00’ -p ~/runhpl/runhpl
The use of an user-defined environment would have been impossible without KaDeploy,
it would have taken the same amount of time per cluster and not for all of them, and the configuration of the deployment would have been more difficult because of several conditional choices.
The DIET hierarchy would have been written by hand and not easily readable because
of the resources-dependency of the hierarchy description file avoided by the pattern-matching realized by the XMLGoDIETGenerator.
The DIET platform deployed was composed of one Master Agent, 12 Local Agents, and 29 Server Daemons. One job can be executed on each SeD at a given time. 816 nodes were used for the application jobs. As far as the different clusters do not provide the same compilation environment, an image of an environment specially created has been deployed on every reserved nodes.
During the experiments, the main difficulties came from the hardware limitations (typ-ically the disk space which was not large enough to backup data, or some no well defined permissions of /tmp directories on some clusters), and not from DIET or the DIET Dash-board that allowed a good dispatching of the Middleware requests and the fast and efficient management of these hardware problems.
6
Conclusion
With the development of Grid technologies and the availability of large scale platforms, it becomes mandatory to manage Grid applications efficiently and easily. In this paper, they
have presented the DIET Dashboard environment which is a complete, modular, portable, and powerful set of tools dedicated to a Grid Middleware. With this tool, a non-expert user can manage Grid resources, monitor the Grid itself and manage the Grid Middleware by designing its Grid applications or using workflows and then deploying these Grid applications over the Grid platform.
The DIET Dashboard offers a large number of modules, created to answer the different needs of tools appearing in a Grid context. The software architecture design of DIET Dashboard makes its extensible (modules can easily be added to the core of the application). The performance of the DIET Dashboard and GRUDU (the tool dedicated to the Grid management) have been tested through the experiment realized on Grid’5000. This experi-ment showed that the resources tool is able to monitor the entire Grid, and reserve resources on a large number of sites and clusters.
GRUDU is one answer to the need of an efficient tool for the management of both hard-ware and softhard-ware part of the Grid. GRUDU abstracts the scripting part of the management of a Grid, in order to provide to the user a easy-to-use GUI where all the necessary opera-tions are available. Users do not need to write obscure and complex command lines for the management of their resources anymore, which is often one of the main barriers in the use of Grid environments.
All these elements prove that the DIET Dashboard is as stable and efficient tool that unifies different tools into one single modular graphical application.
7
Acknowledgments
DIET was developed with financial support from the French Ministry of Research (RNTL GASP and ACI ASP) and the ANR (Agence Nationale de la Recherche) through the LEGO project referenced ANR-05-CIGC-11 and Gwendia project (ANR-06-MDCA-009). All ex-periments were done over the Grid’5000 platform.
We would like to thank the developers of the DIET Middleware and in particular Ab-delkader Amar for his work around DIET Dashboard.
References
[1] I. Altintas, C. Berkley, E. Jaeger, M. Jones, B. Ludascher, and S. Mock. Kepler: An extensible system for design and execution of scientific workflows. In Proceedings of the 16th Intl. Conference on Scientific and Statistical Database Management(SSDBM), Santorini Island, Greece, June 2004.
[2] K. Amin, G. von Laszewski, M. Hategan, N.J. Zaluzec, S. Hampton, and A. Rossi. GridAnt: A Client-Controllable Grid Workflow System. hicss, 07:70210c, 2004. [3] R. Bolze, F. Cappello, E. Caron, M. Dayd´e, F. Desprez, E. Jeannot, Y. J´egou, S. Lanteri,
E. Talbi, and I. Touch´e. Grid’5000: a large scale and highly reconfigurable experimen-tal grid testbed. International Journal of High Performance Computing Applications, 20(4):481–494, November 2006.
[4] J.L. Brown, C.S. Ferner, T.C. Hudson, A.E. Stapleton, R.J. Vetter, T. Carland, A. Mar-tin, J. MarMar-tin, A. Rawls, W. J. Shipman, and M. Wood. Gridnexus: A grid services scientific workflow system. International Journal of Computer Information Science (IJCIS), 6(2):77–82, June 2005.
[5] Nicolas Capit, Georges Da Costa, Yiannis Georgiou, Guillaume Huard, Cyrille Martin, Gr´egory Mouni´e, Pierre Neyron, and Olivier Richard. A batch scheduler with high level components. In Cluster computing and Grid 2005 (CCGrid05), 2005.
[6] E. Caron, P.K. Chouhan, and H. Dail. GoDIET: A deployment tool for distributed middleware on grid’5000. In IEEE, editor, EXPGRID workshop. Experimental Grid Testbeds for the Assessment of Large-Scale Distributed Apllications and Tools. In con-junction with HPDC-15., pages 1–8, Paris, France, June 19th 2006.
[7] E. Caron and F. Desprez. DIET: A Scalable Toolbox to Build Network Enabled Servers
on the Grid. International Journal of High Performance Computing Applications,
20(3):335–352, 2006.
[8] A. Denis, C. Perez, and T. Priol. Towards high performance CORBA and MPI mid-dlewares for grid computing. In Craig A. Lee, editor, Proc. of the 2nd International Workshop on Grid Computing, number 2242 in LNCS, pages 14–25, Denver, Colorado, USA, November 2001. Springer-Verlag.
[9] Y. Georgiou, J. Leduc, B. Videau, J. Peyrard, and O. Richard. A tool for environment deployment in clusters and light grids. In Second Workshop on System Management Tools for Large-Scale Parallel Systems (SMTPS’06), Rhodes Island, Greece, 4 2006.
[10] A. G´omez-P´erez and R. Gonz´alez-Cabero. SGSdesigner: a graphical interface for
an-notating and designing semantic grid services. In WWW ’06: Proceedings of the 15th international conference on World Wide Web, pages 867–868, New York, NY, USA, 2006. ACM Press.
[11] D. Hull, K. Wolstencroft, R. Stevens, C. Goble, M. R. Pocock, P. Li, and T. Oinn. Taverna: a tool for building and running workflows of services. Nucleic Acids Res, 34(Web Server issue), July 2006.
[12] M. L. Massie, B. N. Chun, and D. E. Culler. The ganglia distributed monitoring system: design, implementation, and experience. Parallel Computing, 30(7):817–840, July 2004. [13] K.M. McCann, M. Yarrow, A. De Vivo, and Piyush Mehrotra. Scyflow: an environment for the visual specification and execution of scientific workflows. Concurrency and Computation: Practice and Experience, 18(10):1155–1167, 2006.
[14] T.M. Oinn, M. Addis, J. Ferris, D. Marvin, M. Senger, R. M. Greenwood, T. Carver, K. Glover, M.R. Pocock, A. Wipat, and P. Li. Taverna: a tool for the composition and enactment of bioinformatics workflows. Bioinformatics, 20(17):3045–3054, 2004. [15] Gurmeet Singh, Ewa Deelman, Gaurang Mehta, Karan Vahi, Mei-Hui Su, Bruce G.
Berriman, John Good, Joseph C. Jacob, Daniel S. Katz, Albert Lazzarini, Kent Black-burn, and Scott Koranda. The pegasus portal: web based grid computing. In SAC ’05: Proceedings of the 2005 ACM symposium on Applied computing, pages 680–686, New York, NY, USA, 2005. ACM Press.
[16] Sun Microsystems. Sun Grid Engine — Administration and User’s guide, 2002. Version 5.3.
[17] Romain Teyssier. Cosmological hydrodynamics with adaptive mesh refinement: a new high resolution code called ramses, 2001.
Unité de recherche INRIA Futurs : Parc Club Orsay Université - ZAC des Vignes 4, rue Jacques Monod - 91893 ORSAY Cedex (France)
Unité de recherche INRIA Lorraine : LORIA, Technopôle de Nancy-Brabois - Campus scientifique 615, rue du Jardin Botanique - BP 101 - 54602 Villers-lès-Nancy Cedex (France)
Unité de recherche INRIA Rennes : IRISA, Campus universitaire de Beaulieu - 35042 Rennes Cedex (France) Unité de recherche INRIA Rocquencourt : Domaine de Voluceau - Rocquencourt - BP 105 - 78153 Le Chesnay Cedex (France)