Publisher’s version / Version de l'éditeur:
Journal of the Audio Engineering Society, 45, April 4, pp. 253-259, 1997-04-01
READ THESE TERMS AND CONDITIONS CAREFULLY BEFORE USING THIS WEBSITE. https://nrc-publications.canada.ca/eng/copyright
Vous avez des questions? Nous pouvons vous aider. Pour communiquer directement avec un auteur, consultez la première page de la revue dans laquelle son article a été publié afin de trouver ses coordonnées. Si vous n’arrivez pas à les repérer, communiquez avec nous à PublicationsArchive-ArchivesPublications@nrc-cnrc.gc.ca.
Questions? Contact the NRC Publications Archive team at
PublicationsArchive-ArchivesPublications@nrc-cnrc.gc.ca. If you wish to email the authors directly, please see the first page of the publication for their contact information.
NRC Publications Archive
Archives des publications du CNRC
This publication could be one of several versions: author’s original, accepted manuscript or the publisher’s version. / La version de cette publication peut être l’une des suivantes : la version prépublication de l’auteur, la version acceptée du manuscrit ou la version de l’éditeur.
Access and use of this website and the material on it are subject to the Terms and Conditions set forth at
Sound absorption of gypsum board cavity walls
Bradley, J. S.
https://publications-cnrc.canada.ca/fra/droits
L’accès à ce site Web et l’utilisation de son contenu sont assujettis aux conditions présentées dans le site LISEZ CES CONDITIONS ATTENTIVEMENT AVANT D’UTILISER CE SITE WEB.
NRC Publications Record / Notice d'Archives des publications de CNRC:
https://nrc-publications.canada.ca/eng/view/object/?id=01ca5044-581d-489a-9d43-6feb2eded212 https://publications-cnrc.canada.ca/fra/voir/objet/?id=01ca5044-581d-489a-9d43-6feb2eded212
http://www.nrc-cnrc.gc.ca/irc
Sound a bsorpt ion of gypsum boa rd c a vit y w a lls
N R C C - 4 0 6 0 8
B r a d l e y , J . S .
A p r i l 1 9 9 7
A version of this document is published in / Une version de ce document se trouve dans:
Journal of the Audio Engineering Society, 45, (4), April, pp. 253-259, April 01,
1997
The material in this document is covered by the provisions of the Copyright Act, by Canadian laws, policies, regulations and international agreements. Such provisions serve to identify the information source and, in specific instances, to prohibit reproduction of materials without written permission. For more information visit http://laws.justice.gc.ca/en/showtdm/cs/C-42
Les renseignements dans ce document sont protégés par la Loi sur le droit d'auteur, par les lois, les politiques et les règlements du Canada et des accords internationaux. Ces dispositions permettent d'identifier la source de l'information et, dans certains cas, d'interdire la copie de documents sans permission écrite. Pour obtenir de plus amples renseignements : http://lois.justice.gc.ca/fr/showtdm/cs/C-42
PAPERS
Sound Absorption of Gypsum Board Cavity Walls*
J. S. BRADLEY, AES Member
Institute for Research in Construction, National Research Council, Ottawa, Ont., Canada, KIA OR6
Although gypsum board is probably the most common interior surface treatment in use
in the United States and Canada today, the sound-absorbing prnperties of many common
wallconstructions are not well known. The results of sound absorption tests performed on several gypsum board cavity walls are reported. A calculation model was developed that accurately fits the measured data. The increased low-frequency absorption is related to the mass-air-mass resonanceof thewallconstruction. The model also includes a residual high-frequency sound abs01ption component related to the properties of the exposed surface of thewall. This model can nowbe used to conveniently predict the sound absorption of other similar gypsum board wall constructions and to design walls with some specifiedminimal amount of low-frequency absorption.
1 CALCULATION MODEL
tests were used to extend the validation of the model. The validated model can be used to predict the absorp-tion versus frequency characteristics of a range of gyp-sum board cavity walls.
The sound-absorbing characteristics of gypsum board walls vary considerably with frequency. Typically sound absorption coefficients are much larger at low frequencies than at medium and higher frequencies. These properties are generally assumed to be due to the resonant low-frequency sound absorption of the wall construction. The mass of the gypsum board surface layers and the stiffness of the contained air produce a simple mass-aIr-mass (MAM) resonance frequency. The MAM resonance fre-quency can be calculated as follows [l]. [2]:
(I) [Hz]
IMAM
=
1900where m 1and m2 are the surface densities of the two gypsum board layers in kilograms per square meter, dis the depth of space between the two layers in millimeters. When the wall cavity is filled with porous sound-absorbing material, such as glass fiber batts, the constant changes from 1900 to 1362 because the behavior of the air in the cavity changes from adiabatic to isothermal [2]. The calculation model assumes that the sound absorp-tion of the wall construcabsorp-tion peaks at the MAM reso-nance frequency IMAM and decreases above this
fre-o
INTRODUCTION'" Manuscript received 1996 December 17; revised 1997 Jan·
uary 27.
Gypsum board is the Ubiquitous interior surface treat-ment in modern North American buildings. While it is a very commonly used material, its sound-absoring properties are not precisely known. Sometimes its prop-erties are dismissed as "so small it can be ignored," while on other occasions many layers of gypsum board are recommended to minimize low-frequency sound ab-sorption. In many rooms gypsum board provides the built-in low-frequency absorption that prevents them from having an unpleasant "boomy" sound. However, it is not clear how one should design a gypsum board cavity wall to minimize or provide a known amount of low-frequency sound absorption.
This paper presents the results of sound absorption measurements of several gypsum board walls and a cal-culation model for estimating the properties of other similar walls. Sound absorption tests were performed in a large reverberation chamber on four basic wall con-structions. Further sound absorption tests were per-formed on gypsum board walls with different surface treatments. The calculation model was fitted to the mea-surement data assuming the properties of a simple single-degree-of-freedom system to model the resonant low-frequency absorption characteristics. Further sound absorption data obtained from the reverberation time measurements associated with sound transmission loss
BRADLEY PAPERS
2 TEST PROCEDURES
where aMAM is the maximum absorption at the MAM
resonance frequency, a, is the residual high-frequency
surface absorption, and
I
is frequency. The values ofa MAM and a, were determined by fitting Eq. (2) to the
measured data as will be discussed. The MAM resonance frequencyIMAM is calculated using Eq. (I).
quency inversely proportional to the frequency squared. (Of course, the absorption would also be expected to decrease below the MAM resonance frequency. How-ever, it is usually not possible to make accurate absorp-tion measurements at these very low frequencies.) The model further aSsumes that the high-frequency sound absorption has some limiting small value due to the prop-erties of the exposed surface of the gypsum board. This would be modified by paint or other surface treatments. With these assumptions the form of the model of sound absorption versus frequency is
2
a(f)
=
aMAMセm[mI
+
a, (2)sample case was then subtracted and the result corrected for differences in air absorption. Reverberation times with a painted concrete block wall in place were used as the no-sample case.
Itwas not always possible to determine the absorbing characteristics of the gypsum board walls accurately. Frequently the high-frequency absorption was much greater than occurs normally for gypsum board. Errors occurred because many wall constructions included the addition of other materials that changed the total absorp-tion in the reverberaabsorp-tion chamber by an unknown amount. (For example, fianking strips that include po-rous absorbing material are added to reduce sound trans-mission via the frame in which the test walls are mounted.) Also, in the sound transmission loss tests the walls were usually positioned midway between the two reverberation chambers and not fiush with the interior surface of the large chamber. There were further possible sources of error related to attempts to correct for differ-ences in air absorption. In spite of these problems, some sound absorption data were obtained from transmission loss tests. While they provide less accurate measure-ments of absorption coefficients, they allow validation of the calculation model for a wider range of wall
constructions.
Sound absorption measurements were made in a 250-m' reverberation chamber according to the ASTM C423 standard [3]. The chamber includes several fixed diffus-ing panels as well as a large rotatdiffus-ing vane to ensure diffuse conditions. The measurement frequency range was extended down to 80 Hz to better describe the low-frequency properties of the walls. However, the mea-surement uncertainty of the lowest frequency results is quite large. The tests were conducted using four inde-pendent pink noise sources and measuring ten repeats of sound decays at nine different microphone positions. The tests are completely computer controlled and use a Norwegian Electronics type 830 one-third-octave real-time analyzer for data acquisition.
The large reverberation chamber is part of a wall trans-mission loss suite, and the test walls were built in the wall opening between the two reverberation chambers. The dimensions of the opening and the test walls are 2.44 by 3.05 m. The test wall was positioned so that its surface facing into the large reverberation chamber was as close as possible to being fiush with the reverberation chamber interior surface. A massive lead-loaded door could be closed across the test wall for measurement of the "no-sample"」ッョ、ゥセゥッョウ in the chamber.
Some further sound absorption data were obtained from previous sound transmission loss tests of several walls according to the ASTM E90 procedure.
Transmis-sion loss tests include reverberation time measurements
in the receiving room, which was the same large rever-beration chamber used in the absorption tests. These reverberation time data were used to estimate the sound absorption of the walls. Using the Sabine reverberation time equation, the total sound absorption in the large reverberation chamber was calculated from the measured reverberation times. The sound absorption of the
no-254
3 GYPSUM BOARD ON STEEL STUDS WITH EMPTY CAVITY
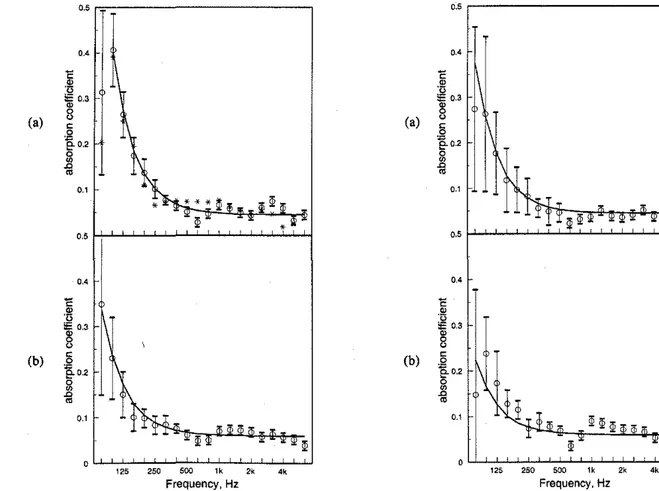
Sound absorption tests were performed on wall con-structions using 90- and l50-mm lightweight steel studs. Fig. I shows the measured sound absorption coefficients and 95% confidence limits for gypsum board cavity walls on 90-mm steel studs. While the confidence limits are very small at higher frequencies (±O.OI), they increase to as much as ±0.2 at low frequencies.
Fig. I(a) gives results for one layer of 13-mm type-X gypsum board on each side of 90-mm lightweight steel studs and with an empty cavity. The calculated MAM resonance frequency for this case is 90 Hz. The
solid line shows the calculated values using aMAM
=
0.44 anda,
=
0.045 in Eq. (2). The calculated resultsare seen to be a good fit to the measurements above the MAM resonance frequency. The second set of measured absorption coefficients shown on this plot was obtained from a transmission loss measurement and agrees quite well with the calculated values and the absorption test results above the MAM resonance frequency.
Fig. I(b) shows results for two layers of 13-mm type-X gypsum board on each side of 90-mm lightweight steel studs. The calculated MAM resonance frequency for this case is 63 Hz, and the calculated values were
obtained using aMAM = 0.44 and a, = 0.06. These
results again show good agreement between measured and calculated values and describe well the rise in ab-sorption at low frequencies. The results in Fig. I suggest that the residual high-frequency absorption is slightly greater for a double layer than for a single layer, that
is, a,
=
0.006 for a double layer anda,=
0.045 fora single layer. This additional absorption for the double
PAPERS
layer may be due to friction between double layers of gypsum board.
Fig. 2 shows results similar to those of Fig. I, but for constructions using 150-mm lightweight steel studs and again with empty cavities. The results in Fig. 2(a) are for a construction with one layer of 13·mm type-X gypsum board on each side of 150-mm steel studs. The calculated MAM resonance frequency is 69 Hz. The calculated results (solid lines) were obtained usingaMAM
=
0.44 and a, = 0.045. Fig. 2(b) shows the sound
absorp-tion coefficients of a wall consisting of two layers of 13-mm type-X gypsum board on each side of 150-mm steel studs. For this case the calculated MAM resonance frequency is 49 Hz. The calculated reslts were obtained
usingaMAM
=
0.44 and a, = 0.06. Thus for the foursets of data in Figs. I and 2 all calculated results used
aMAM
=
0.44. For both stud sizes calculations weresuccessfully performed using a, = 0.045 for single
lay-ers of gypsum board and a, = 0.06 for double layers.
Although it was not possible to perform further sound absorption tests of other gypsum board cavity walls, additional data were obtained from wall transmission loss tests for walls using 65-mm lightweight steelウエオ、ウセ
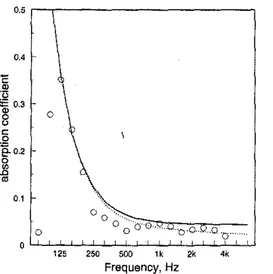
Fig. 3 plots the sound absorption coefficients from these measurements and the corresponding calculated values. This wall construction consisted of one layer of 13-mm gypsum board on each side of 65-mm steel studs. The
0.5
r T : : - - - ,
SOUND ABSORPTION OF GYPSUM BOARD
calculated MAM resonance frequency is 105 Hz. The calculated results (solid line) were obtained usingaMAM
=
0.44 and a,
=
0.045. The dotted line shows a possiblefurther correction to the calculated results to account for the nonporous surface of this wall. (The gypsum board was vinyl coated in this case). This is discussed further in relation to surface treatments in Section 5.
The measurements from gypsum board cavity walls using 65-, 90-, and 150-mm steel studs and with empty cavities show how the low-frequency absorption varies with the tuning of the MAM resonance, and all agree well with the calculations using Eq. (2).
4 GYPSUM BOARD ON STEEL STUDS WITH ABSORBING MATERIAL IN CAVITY
Eq. (I) predicts lower MAM resonance frequencies when the wall cavities are filled with porous sound· absorbing material. This is because the behavior of air in the cavity changes from adiabatic to isothermal when the cavity is filled with absorbing material. Lowering the resonance frequency would tend to reduce the sound absorption of the gypsum board wall at low frequencies
above the MAM resonance frequency. Itwas
unfortu-nately not possible to perform sound absorption tests on gypsum board walls where the cavities are filled with sound-absorbing material, but some data were obtained
0.5 , . . . . - - - ,
-0.' 0.' E E Nセ Nセ セ 0.3 :=:0.3 08
(a) u0 (a)セ
0"
e-
0.2e-
0.2 0 0 jg 00 m f,j 0.• 0.' !iii ii•
0.5 0.5 0.' E セ '0 セ 0' u (b)2
e-
0.2E
m 0.• o. E セ '0 ==セ 0,3 8 (b) Jl05-°.
2 00 .0 m 0.• 4k PQNNjMwZMBGMBMセ⦅⦅G⦅ZZZB⦅⦅G⦅ZcMwG⦅ZlNNキNNMGMGMw 125 250 500 lk 2k 4k Frequency, Hz Fig. 1. Sound absorption coefficients versus ッョ・Mエィゥイ、セッ」エ。カ・band frequency, 13-mm gypsum board on each side of
90-rom steel studs. Open」ゥイ」ャ・ウMュ・。ウオイ・、セ vertical bars-95% confidence limits; solid line-calculated. (a) One layer.
(b) Two layers.
J.Audio Eng. Soc.• Vol. 45. No.4, 1997 April
125 250 500 lk 2k
Frequency, Hz
Fig. 2. Sound absorption coefficient versus one-third-octave
band frequency, 13-mm gypsum board on each side of
150-mm steel studs. Open circles-measured; vertical bars-95% confidence limits; solid line-calculated. (a) One layer.
(b) Two layers.
o o o 0.1 0.4 01 E
•
セ 0.38
5e.
0,2-セ
125 250 500 1k 2k 4k Frequency, HzFig. 5. Sound absorption coefficient versus one-third-octave band frequency, one layer of 13-mm gypsum board on each side of 65-mm steel studs with glass fiber insulation in cavity. Open circles-measured: solid line-calculated.
J. Audio Eng.Soc.,Vol. 45, No.4, 1997 April
0.4
0.5,---....,
reduce the measured high-frequency absorption associ-ated with the surface.
Three different gypsum board walls were tested for the effects of painting the exposed surface. In all cases two layers of oil-based paint were added to the gypsum board surface. One wall consisted of one layer of 13-mm gypsum board on each side of 90-13-mm lightweight steel studs. The second wall consisted of two layers of 13-mm gypsum board on each side of 150-mm light-weight steel studs. The third wall construction was a single layer of l3-mm gypsum board on only one side of90-mm lightweight steel studs. Sound absorption tests were performed for the painted and the corresponding unpainted walls. The changes in absorption coefficients when paint was added were then calculated and are plot-ted in Fig. 6. While the results in the lowest frequency bands are not as reliable because of larger experimental errors, the medium and higher frequency results show a systematic trend with increasing frequency. The straight-line fit to these changes in absorption coefficients
de-05,---....,
PAPERS
oU-.""--,J....LlJ....LlJ....LlJ....LlJ....LlJ...l.J 125 250 500 1k 2k 4k
Frequency, Hz
Fig. 4. Sound absorption coefficient versus one-third-octave
band frequency, one layer of 13-mm gypsum board on each
side of 90-mm steel studs with glass fiber insulation in cavity. Open circles-measured; solid line-calculated.
o "0"0....0'0'" o o o 01
0.5
r - - r - - - , 256In actual buildings gypsum board walls almost always have some surface treatment. This may be paint, vinyl covering, or even added layers of materials such as ce-ramic tiles. These surface treatments are expected to reduce the high-frequency residual absorption of the gypsum board surface slightly, that is, untreated gypsum board is a little porous and will tend to absorb sound at higher frequencies. Painting or some similar surface treatment will largely eliminate this porosity and hence
from previous transmission loss test results.
Fig. 4 shows absorption coefficients for a wall consist-ing of one layer of 13-mm gypsum board on each side of 90-mm lightweight steel studs and with glass fiber material in the cavity. The MAM resonance frequency was calculated to be 64 Hz for this construction. Again the solid line in Fig. 4 gives the calculated absorption coefficients using Eq. (2). These calculated results were
obtained with otMAM
=
0.44 andot,=
0.06.One other example of an absorbant-filled cavity wall was obtained for a construction based on 65-mm light-weight steel studs. Fig. 5 illustrates the absorption coef-ficients for a construction of one layer of gypsum board on each side of 65-mm steel studs and with glass fiber in the cavity. The MAM resonance frequency was calcu-lated to be 76 Hz for this construction. As for the previ-ous results, the calculated absorption coefficients were
obtained withotMAM
=
0.44 and ot,=
0.06.These data for absorb ant-filled cavities obtained from transmission loss tests show inferior agreement with the calculated values than the data from absorption tests. There is more uncertainty as to the high-frequency resid-ual absorptionot"and apparently some error in the MAM
resonance frequency for the 65-mm wall results in Fig. 5. However, the results are probably satisfactory to vali-date the calculation procedure for absorbant-filled cav-ity walls.
5 SURFACE TREATMENTS BRADLEY
125 250 500 lk 2k 4k
Frequency, Hz
Fig. 3. Sound absorption coefficient versus one-third-octave
band frequency, one layer of 13-mmgypsum board on each
side of 65-rnm steel studs. Open circles-measured; solid ャゥョ・セ」。ャ」オャ。エ・、[ dotted line-calculated withcorrection for nonporous surface.
PAPERS SOUND ABSORPTION OF GYPSUM BOARD
0.1
creases at 0.0036 per octave above 100 Hz. Although there is significant scatter about this line, the overall effects are small, and this relationship seems practically adequate to predict the effect of painting a gypsum board surface.
Itis assumed that this same correction will be satisfac-tory to explain the effect of other surface treatments that eliminate the porous gypsum board surface. For example, vinyl-surfaced gypsum board is expected to have similar properties to painted gypsum board. Ac-cordingly Fig. 3 includes a second calculated result (dot-ted line) that adds the expec(dot-ted effect of a nonporous surface treatment to the calculation of Eq. (2). That is, the absorption coefficients calculated from Eq. (2) are reduced a further 0.0036 per octave above 100 Hz. The correction is quite small and is only larger than the mea-surement confidence limits at higher frequencies.Itdoes seem to improve the prediction of the absorbing proper-ties of gypsum board walls with nonporous surface treatments.
As a further example of a surface treatment, heavy quarry tiles were added to a wall to demonstrate the possible improvements in terms of decreased sound
ab-sorption coefficients. It was expected that the added
weight of the tiles would lower the MAM resonance frequency and hence reduce low-frequency absorption above this frequency and that the nonporous surface of the tiles would also reduce the high-frequency absorp-tion of the wall. The wall construcabsorp-tion consisted of two layers of 13-mm gypsum board on each side of 150-mm steel studs with an empty cavity. The quarry tiles were approximately 13 mm thick and had a surface density of 28 kglm'. The MAM resonance frequency for this construction was calculated to be 41 Hz. Calculated
ab-sorption coefficients were obtained using aMAM
=
0.44anda, = 0.06, as for other cases with double layers of
gypsum board. The calculations were further modified by adding the -0.0036 per octave correction from Fig. 6 for nonporous surfaces. Fig. 7 compares measured absorption coefficients with calculated values for this construction. Measured and calculated absorption
coef-ficients agree well, and these results validate both the calculations based on Eq. (2) and the nonporous sur-face correction.
6 SINGLE LAYER OF GYPSUM BOARD
In some cases a single layer of gypsum board may exist without a second layer on the other side of the supporting studs. For example, many gypsum board ceil-ings would approximate this case. Two sets of measure-ments of single gypsum board layers were made, and the results are shown in Fig. 8. The absorption coeffi-cients were obtained from sound absorption tests of sin-gle layers of 13-mm type-X gypsum board on one side of 90-mm and 150-mm lightweight steel studs. The two wall constructions led to almost identical results, and one must conclude that the different stud sizes have no effect.
Some further tests were performed to determine the cause of the slightly increased absorption at lower
fre-0.5 セMMMMMMMMMMMMM 0.4
125 250 500 lk 2k 4k
Frequency, Hz
Fig. 7. Sound absorption coefficients versus one-third-octave
band frequency, two layers of 13-nun gyp-sum board on each side of ISO-nun steel studs with quarry tlles on exposed
sur-face. Open circles-measured; solid line-calculated.
90mm .• Q •• 150mm --+-0.1 0.4 \25 250 500 1k 2k 4k Frequency, Hz
Fig. 8. Measured sound absorption coefficients versus one·
エィゥイ、セッ」エ。カ・ band frequency for one layer of 13-mm gypsum board on one side of 90- and 150·mm steel studs.
0.5セMMMMMMMMMMMMM 1 150mm studs 0 0 90mm sluds
•
5 Xゥョァャセ。ケ・イ \e..
•
•
·I,e..
...
•
.. ..
e"e
•
• 0 Nセ....
..
0•
0 0 •..
0•
0 1 \j セ 0.0t
.S ill, c -0.05セ
·0 o 125 250 500 1k 2k 4k Frequency, HzFig. 6. Change in sound absorption 」ッ・セヲゥ」ゥ・ョエウ versus ッョ・セ
third-octave band frequency because of pamt added to exposed gypsum board surface.
-,.
I PAPERS 8 CONCLUSIONS (3) 1'111111111'"2 layers each side with absorbent cavity
0.4 Layers each side
u(l25) = 0.44(fMAMIl25)'
+ "'•.
0,1
0,5,..---,
For example, an MAM resonance frequency of 100 Hz would lead to 34% absorption at 125 Hz, but a 40-Hz MAM resonance frequency would reduce the 125-Hz absorption to about 10%. After deciding on a required MAM resonance frequency, one must determine the wall construction required to produce this MAM resonance frequency. Then one can calculate the absorption charac-teristics using Eq. (2) and the procedures outlined in this paper, knowing that the required minimum low-frequency absorption will be achieved.
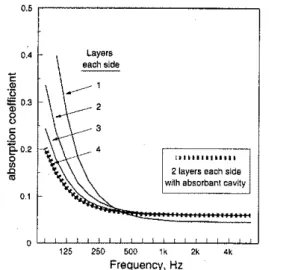
The measured sound absorption coefficients presented in this paper give accurate descriptions of the sound-absorbing properties of several gypsum board wall con-structions. A simple calculation model was presented that accurately fits the measured data and is a convenient means of estimating the sound-absorbing properties of other similar gypsum board walls at frequencies above the MAM resonance frequency. The model takes into account the MAM resonance that normally determines gypsum board are added and the MAM resonance fre-quency is lowered. Thus while a single layer of gypsum board on each side of the 90-mm studs would lead to almost 40% absorption at 100 Hz, four layers would reduce this to about 13%. However, this figure also illustrates that the same reduced absorption could be achieved using only two layers of gypsum board on each side of the studs with an absorbant·filled cavity. Thus, adding sound·absorbing material in the cavity can reduce the low-frequency absorption of a gypsum board wall significantly.
As a final design aid it is useful to relate the low-frequency sound absorption to the MAM resonance fre-quency. One can calculate the expected 125-Hz absorp-tion coefficient from the following equaabsorp-tion:
OLL-'-'-...LLL-'-'-L-'-'-...LLL-'-'-L.L.L..LJ
125 250 500 1k 2k 4k
Frequency, Hz
Fig. 9. Calculated absorption coefficients for various numbers of layers of 13-mm gypsum board on both sides of 90-mm
steel studs. Solid lines-empty cavity; dashed line-glass fiber insulation in cavity.
7 DESIGNING FOR MINIMAL LOW-FREQUENCY ABSORPTION
The procedures used to calculate the sound absorption of gypsum board walls have been shown to agree well with a varicly of measured results for walls built on lightweight slcc! studs. Ittherefore seems reasonable to base a design procedure for predicting the sound
absorp-lion of these Iypes of walls on this same calculation
method. Where low-frequency absorption is needed at a particular frequency, one could use a wall construction with an appropriately tuned MAM resonance frequency. Where it is desired to design for some particular reduced low-frequency absorption, one could use the complete calculation procedure to predict the absorption
coeffi-cients as 11 function of frequency for the desired
construction.
To estimlllc the complete absorption characteristics of a gypsum bOllrd wall, one must first calculate the MAM
resonance frequency using Eq.(I). As examples of this
calculation, Ihe calculated MAM resonance frequencies
have been given in this paper for each of the measured test consll'll,,1 ions. The absorption coefficients versus frequency "hlll'llcteristics can then be calculated using Eq. (2). Vnlues of the parameters "'MAM and "'. have
been determilled from the measurements reported in this
paper. The vlIlue of 、maセ = 0.44 was found to be
acceptable for nil」ッョウエイオ」セャoョウN Two values ofO::swere
used. For sillgle layers wIthout a surface treatment a value of u, セ 0,045 was found to be suitable. For double layers of ulllrellied gypsu.m board a?d for constructions with absllrhillg mlltenal m the cavIty a value of "'. =
0.06 was used, Where the exposed surface of the gypsum board is Irellle,1 with some nonporous material, a further correctioll"I' 0.0036 per octave above 100 Hz should also be lIdde,1.
Fig. 9 illusll'lItes example calculations for walls built on 90.mm lighl\voighl sleel studs. The gradual reduction in low-frC'l1HC'IH:Y ubsorption is seen as more layers of
BRADLEY
quencies for the twO results in Fig. 8. In one test a large amount of sour,.1-absorbing material was added to the reverberation chamber behind the test wall. Because the
transmission 1M' of a single layer of gypsum board is
quite small at lower frequc:ncies, it was thought that the reverberation of the backmg chamber mIght mfluence the results. The addition of the absorption material to the backing chamber reduced the sound absorption in the 100- and 125-Hz one-third-octave bands by a small amount. A second test was performed after removing the supporting steel studs from the construction. The gypsum board panels were held together with aluminum tape and supported only at the periphery. Removing the supporting studs reduced the sound absorption coeffi-cients in the one-third-octave bands between 200 and 400 Hz by a small amount. Thus much of the measured low-frequency absorption for a wall consisting of a sin-gle layer of gypsum board on steel studs is due to the vibrational properties of the construction and was only slightly influenced by the measurement technique.
PAPERS
the low-frequency sound absorption of gypsum board cavity walls. The model also estimates the residual high-frequency sound absorption of several types of surface treatments. The model has been validated for a range of constructions consisting of gypsum board on lightweight steel studs both with and without sound absorbing mate-rial in the cavity.
There are several possible sources of error in the mea-sured sound absorption results. Precise measurements at low frequencies in a reverberation chamber are difficult to obtain. The increased confidence limits at lower fre-quencies associated with the measured values in Figs. I and 2 indicate the possible magnitude of this source of errors. Further small errors are possible at medium and higher frequencies due to the procedure used to obtain a no-sample case. When the heavy sliding door was opened, it hung approximately 10 mm from the reverberation chamber wall. Tests suggested that this small gap could add a small amount of absorption at medium and higher frequencies equivalent to a wall ab-sorption coefficient of 0.01-0.03. This would tend to increase the measured medium- and high-frequency wall absorption values incorrectly. However, similar effects are possible when the heavy door was closed to cover the sample wall, which would tend to decrease the measured
sound absorption coefficients. Itis not possible to be
SOUND ABSORPTION OF GYPSUM BOARD
sure of the net magnitude of these types of errors in the measured absorption coefficients, but they are unlikely to be greater than 0.01-0.03.
There are a number of other types of wall construc-tions that were not tested. Further work is suggested to determine the validity of the calculation model for these other constructions. They would include gypsum board walls built on wood studs and concrete block walls with gypsum board surfaces separated from the block by rela-tively small air spaces. Some construction details might also influence the sound absorption of the gypsum board walls and should be investigated. These would include the stud spacing and the type of bonding between multi-ple layers of gypsum board.
9 REFERENCES
[I] A. London, "Transmission of Reverberant Sound through Double Walls,"J. Res. Nat. Bur. Stand., vol.
44, pp. 77-88 (1950).
[2] F.J. Fahy, Sound and Structural Vibration
(Aca-demic Press, New York, 1985), p. 169.
[3] ASTM C423-90a, "Standard Test Method for Sound Absorption Coefficients by the Reverberation Room Method," American Society for Testing and Ma-terials, Philadelphia, PA (1990).
THE AUTHOR
John Bradley is a senior research officer in thea」ッオウセ
tics Laboratory of the Institute for Research in Construc-tion at the NaConstruc-tional Research Council of Canada. His undergraduate degree was in physics and was obtained from the University of Western Ontario. His masters degree, received from the same university, involved re-search on violin acoustics. He obtained his Ph.D. at
Imperial College of the University of London on a
proj-ect concerning elproj-ectroacoustic enhancement systems in rooms.
J. Audio Eng.Soc..Vol. 45, NO.4, 1997 April
After teaching。」ッオウエゥ」セ and noise control for several
years in the Faculty of Engineering at the University of Western Ontario, he joined the National Research
Council. His work has concentrated on both room acous-tics and subjective stUdies. He has completed studies on the annoyance of various types of noises as well as
measurement studies in various rooms. Most recently
he has been concerned with the accuracy of various
room acoustics measurements as well as the subjective importance of these quantities.