INTRODUCTION
Bioacoustic studies of crustaceans have recently been receiving more attention in marine ecology (e.g. Edmonds et al. 2016). This has been driven partly by the commercial value, ubiquitous distribu-tion and apparent ease of study of crustaceans com-pared with larger, highly mobile mammals. However, while the purpose of sounds emitted by whales and dolphins has been investigated for decades (Tyack & Clark 2000), little is known about the ecological © The authors 2018. Open Access under Creative Commons by Attribution Licence. Use, distribution and reproduction are un -restricted. Authors and original publication must be credited. Publisher: Inter-Research · www.int-res.com
*Corresponding author: youenn.jezequel@univ-brest.fr
FEATURE ARTICLE
Sound characterization of the European lobster
Homarus gammarus in tanks
Youenn Jézéquel
1,*, Julien Bonnel
2, Jennifer Coston-Guarini
1, Jean-Marc Guarini
3,
Laurent Chauvaud
11Laboratoire des Sciences de l’Environnement Marin, UBO, CNRS, IRD, Ifremer, LIA BeBEST, UMR 6539,
rue Dumont D’Urville, 29280 Plouzané, France
2Woods Hole Oceanographic Institution, Woods Hole, Massachusetts 02543, USA
3UPMC (Paris-6), UMR 8222 LECOB, Observatoire Océanologique de Banyuls sur Mer, 66650 Banyuls sur Mer, France
ABSTRACT: Experiments in marine behavioural ecol-ogy rely heavily on observations made in tanks. How-ever, when studying acoustic behaviours of marine animals in confined volumes, the effects of reverbera-tion must be characterized, something that has been overlooked in parts of the marine ecology literature. In this study, we characterized reverberation in tanks using an artificial sound source and examined the impli cations for bioacoustic studies using sounds emitted by the European lobster Homarus gammarus during feeding and in response to stress. Broadband and transient sounds commonly produced by crusta -ceans were severely impacted by reverberation such that their spectral characteristics and pulse width durations could not be assessed. In contrast, low-frequency sounds could be characterized in tanks, but not their source level. Based on these observations, we describe a simple methodology to identify which sound characteristics can be measured in tanks. When feeding, the lobsters produced broadband and transient sounds called ‘rattles’, similar to sounds re-ported for tropical spiny lobsters Palinurus longipes and P. argus. When stressed, H. gammarus vibrated its carapace, producing a low-frequency sound analo-gous to the ‘buzzing’ sound of the American lobster
H. americanus. The potential role of species-specific
sound is discussed; however, although our observa-tions represent the first bioacoustic characterization of H. gammarus, additional behavioural studies are necessary to understand their ecological meaning. KEY WORDS: European lobster · Passive acoustics · Tanks · Reverberation · Rattle · Buzzing sound · Spectral analysis
Bioacoustic experiment conducted in the Bay of Brest (Brit-tany, France) with European lobsters Homarus gammarus.
Painting:
Nathalie Bihan (redrawn from a photo by Erwan Amice)
OPEN
PEN
ACCESS
CCESS
roles of sounds made by crustaceans (Coquereau et al. 2016a,b, Edmonds et al. 2016). Recent studies have suggested that the sounds emitted by temper-ate marine deca pods have properties suitable for in
situ bio acoustic studies (e.g. Maja brachydactyla,
Coquereau et al. 2016a).
Generally, marine crustaceans are known to pro-duce a variety of sounds through different mecha-nisms, ranging from ‘stridulation’ in crabs (Guinot-Dumortier & (Guinot-Dumortier 1960, Boon et al. 2009) to ‘cavitation bubble collapse’ in snapping shrimps (Knowlton & Moulton 1963, Versluis et al. 2000), ‘stick and slide friction’ in palinurids (Meyer-Rochow & Penrose 1976, Patek 2001) and ‘carapace vibration’ in nephropids and stomatopods (Hen-ninger & Watson 2005, Patek & Caldwell 2006). Most reported sounds in the bioacoustic literature on crustaceans are broadband and transient (Au & Banks 1998, Patek et al. 2009, Coquereau et al. 2016a,b). Authors have suggested many hypotheses about the roles of these sounds, including anti -predator defence in p alinurids (Bouwma & Her-rnkind 2009, Buscaino et al. 2011) and intraspecific communication in paddle crabs (Buscaino et al. 2015). Some sounds are de scribed as a consequence of identifiable activities, such as the ‘rattles’ emit-ted while feeding in palinurids (Moulton 1957, Meyer-Rochow & Penrose 1976). A few crustacean species, including the American lobster Homarus
americanus (Milne Edwards 1837), have been re -ported to emit low-frequency and narrowband sounds (Fish 1966, Henninger & Watson 2005). When threatened or handled, the carapace of H.
americanus vibrates and leads to a ‘buzzing sound’,
due to the contraction of internal muscles located at the base of the second antenna (Fish 1966, Mendelson 1969, Henninger & Watson 2005). The European lobster H. gammarus (Linnaeus 1758), which is closely related to the American lobster, has a similar anatomical morphology (Holthuis 1991), but no studies have yet reported on the sounds emitted by this species.
Most of the bioacoustic studies mentioned above have been performed in tanks because this permits the visual observations necessary to associate sounds with precise behaviours (Hazlett & Winn 1962a,b, Meyer-Rochow & Penrose 1974, 1976, Mul-ligan & Fischer 1977, Patek & Caldwell 2006, Patek & Baio 2007, Patek et al. 2009, Buscaino et al. 2011, 2015, Coquereau et al. 2016a,b). However, the sound field in a tank is highly complex because of the interference caused by multiple reflections on the tank walls. Usually there are so many reflections
that individual echoes cannot be re solved. This phe-nomenon is called reverberation and can be seen in data as the persistence of sound after its emission stops. It can prevent animal sounds from being properly characterized in tanks (Parvulescu 1964, 1967, Akamatsu et al. 2002). When reverberation occurs, standing waves may be generated by the superposition of reflected sound waves. Thus, what is re corded may correspond to the resonant fre-quencies of the standing wave because of its longer duration relative to the biological sound that was emitted (Akamatsu et al. 2002). The recorded spec-trum becomes distorted and difficult to characterize. A large body of acoustic literature exists on the effects of reverberation when measuring broadband sounds (e.g. Pierce 1981, Schroeder 1996) but ap -pears to have been largely overlooked within the bioacoustic community, although highlighted in the 1960s (Parvulescu 1964, 1967). However, the prob-lem with reverbration has recently gained interest in this field in acoustic pressure (Akamatsu et al. 2002) and particle motion measurements (Duncan et al. 2016, Popper & Hawkins 2018).
Nevertheless, bioacoustic studies in small tanks can still provide reliable information. Recently, Akamatsu et al. (2002) described for the first time the sound distortions produced in small tanks by combining empirical approaches with calculations from acoustic theory. This important, fundamental article focused on low-frequency and narrowband sounds emitted by fish. As reverberation is highly dependent on the frequency of interest with re -spect to the tank’s resonant frequencies (which in turn depends on the tank’s dimensions), the fol-lowing applies: if the considered sound has a fre-quency on the order of, or higher than, the tank minimum resonant frequency, it will be affected by reverberation. The sound’s duration is extended and its frequency content may be altered. On the contrary, if the considered sound has a frequency largely below the tank minimum resonant fre-quency, then the recorded sound is not impacted by reverberation (its duration and frequency con-tent not being altered).
The purpose of this study was to characterize sounds produced by H. gammarus individuals dur-ing different activities and compare them with published information on H. americanus and other decapods. But, considering the limits of small tanks for bioacoustic studies, the first step was to determine the conditions under which reliable information on sounds emitted by this species can be collected.
MATERIALS AND METHODS
All laboratory experiments were carried out at the Océanopolis public aquarium in Brest (Brittany, France).
The lobster Homarus gammarus (Crustacea, Mala-costraca, Nephropidae) is a large (up to 6 kg), mobile, nocturnal and commercially important crustacean in European coastal waters (Smith et al. 1998). Its life cycle is typical for a benthic crustacean, with a pe -lagic larval stage followed by benthic juvenile and adult stages and growth occurring through succes-sive periods of molts (Cobb & Wahle 1994, Sheehy et al. 1999, Agnalt et al. 2007).
Animal collection, housing and care
Seventeen H. gammarus individuals (10 females and 7 males) with a carapace length (CL) between 8.7 and 12 cm were collected through snorkeling in the Bay of Plougonvelin (Brittany, France) at depths between 1 and 10 m during January and February 2017. All individuals were transferred to a shaded, outdoor polyester circular tank (radius = 4 m, effec-tive height = 1.13 m; seawater volume = 14.2 m3) for holding. The tank was continuously supplied with sand-filtered, UV-sterilized seawater pumped from the Bay of Brest. Temperature, salinity and animal conditions were controlled daily. During experi-ments, temperature varied between 9 and 12.5°C and salinity was between 32.8 and 34.6. Animals were fed with frozen squid, frozen mackerel and fresh mussels ad libitum and were kept under the natural photoperiod in this tank. Abundant sections of rigid PVC drainage pipes were provided as shelters. Lob-sters were held together in the tank during the entire period of the study (around 4 mo, depending on the date of capture) when they were not being used for the experiments. No lobsters were harmed during the study. At the end of the study, all lobsters were transferred to the Océanopolis public aquarium.
Experimental tanks
Three types of rectangular tanks were used: 6 identical glass tanks (0.60 × 0.50 × 0.35 m, length × width × effective height; 0.105 m3), 1 plastic tank (1.14 × 0.92 × 0.45 m; 0.47 m3) and 1 larger polyester tank (2.10 × 2.10 × 0.53 m; 2.34 m3). During experi-ments, tanks were continuously supplied with the same seawater flow as for the holding tank. The 6
glass tanks and the plastic tank were in a slightly warmer room than the polyester tank, which resulted in somewhat warmer water conditions in the glass and plastic tanks (13.9–14.5°C) than in the polyester tank (9.0–12.5°C) during the study.
Recordings
Sounds were recorded using a preamplified hydro -phone (HTI-92-WB, High Tech) with a sensitivity (SH) of −155 dB re 1 V µPa−1and a flat response from 2 to 50 kHz. The hydrophone was connected to a compact autonomous recorder (EA-SDA14, RTSys) powered by battery to limit electronic self-noise. Recordings were made with a sampling frequency
(Fs) of 156 kHz at 32-bit resolution. Sounds, S (t), were recorded in volts and then converted to pressure, p(t) in µPa, in the time-domain (t), using the following equation:
(1) where G (dB) is the recorder gain (here G = 14.7 dB),
D is a constant for the dynamic response of the
recorder (2 V for this model) and SH is the sensitivity of the hydrophone.
Finally, to associate a sound with a particular be -havioural event, both visual observations and video recordings (GoPro® HERO3 camera) were made during experiments.
Reverberation in the experimental tanks To quantify distortion in the 3 types of experimen-tal tanks (0.105 m3 glass tank, 0.47 m3 plastic tank and 2.34 m3polyester tank), an artificial sound was emitted into each one with an omnidirectional un -derwater speaker (AQUA 30, DNH, 8 Ohms, 20− 20 000 Hz) associated with an amplifier (Plug and Play 12 W) connected to a computer. During record-ings in the tanks, the water pumps were switched off to reduce the background noise to a minimum. No animals were present in the tanks during these measurements. Sound was emitted for 2.5 s, with an intensity spread equally over a wide band of fre-quencies (between 0 Hz and 24 kHz) to simulate white noise. The sound was emitted 5 times at differ-ent distances from the hydrophone, from 0.1 to 1.5 m. Where peak frequencies appeared in the re corded white noise and had the same power spectrum level at different distances in a particular tank, these corresponded to the tank’s resonant frequencies
( ) ( ) 10–20 10
– SH 20
= × × ×
(Akamatsu et al. 2002). Recorded peaks were then compared to the theoretical resonant frequencies
(frectangular, Hz) of a rectangular glass tank with the dimensions L, W and H (after Akamatsu et al. 2002): (2)
where c is the sound velocity in the seawater (ap -proximated at 1500 m s−1 in our case), l, m and n represent integers (≥1), and the combination of these is called the ‘mode number’. The minimum resonant frequency is then defined at mode (1, 1, 1) for a particular tank dimension (Akamatsu et al. 2002).
Experiments
Sounds produced by individual lobsters during 2 dif ferent behaviours — feeding and response to stress — were recorded between March and May 2017 in the 8 tanks described above. During this period, 3 male lobsters molted within 1 wk of each other. We took advantage of this to compare sounds emitted between intermolt (i.e. hard shell) and postmolt (i.e. soft shell) lobsters under the same conditions.
Feeding
Rattles were emitted when lobsters were feeding. Six lobsters (3 postmolt males, 3 intermolt males) were used in each tank type, and sound re cordings were made with all 3 dif ferent food types: frozen squid, frozen mackerel and fresh mussels. Sound re -cordings started at least 10 min after the introduction of the hydrophone in the tanks, and food was intro-duced into the tank below the hydrophone. Record-ings ended when all added food had been consumed; the sessions lasted from 10 min to several hours.
Response to stress
Buzzing sounds were provoked by handling organ-isms as described in the literature for American lob-sters (Fish 1966, Henninger & Watson 2005). All 17 lobsters were tested in each tank type. Individuals were gently lifted and maintained above the bot-tom of the tank for 20 s to 1 min in front of the hydrophone at distances between 10 and 20 cm for each recording.
Conditions of tank recordings
The hydrophone was suspended at the center of each tank, 20 cm above the bottom. Silicone mats (0.5 cm thick) were placed on the bottom of the glass-sided tanks to prevent sounds caused by the hard body parts of lobsters striking, or moving across, the glass. The ‘daylight’ conditions for experimental tanks were simulated using fluorescent light tubes above the tanks. The top of each tank was partially covered (25% of the total surface) by a polystyrene sheet above, but not touching the water surface, to create a shaded zone.
During sound recordings, the water pumps were switched off to reduce the background noise to a minimum. The background noise in the experimental tanks was recorded prior to each recording experi-ment without lobsters. Spectra for the background noise were flat (around 40 dB re 1 µPa2 Hz−1), be -tween 50 Hz and 75 kHz, with no typical peak fre-quencies compared to those that were present during experimental recordings with lobsters. At frequen-cies below 50 Hz, peaks were present (up to 90 dB re 1 µPa2Hz−1) and corresponded to instrumental self-noise from the recorder. These were excluded from the biological sounds analysis.
Then, an individual lobster was carefully trans-ferred to the experimental tank from the separate holding tank. Acclimatization lasted at least 2 d before recordings began, and animals continued to be fed ad libitum during this period. Recording ses-sions started after the individuals were considered acclimatized to the presence of the hydrophone in their tanks (i.e. when attacks on the hydrophone stopped). After recordings, individuals were returned to the separate holding tank, and sound files were archived for analysis.
Sound analyses
Acoustic characteristics of recorded sounds Recordings of raw sounds (files in .wav format) and videos were analyzed simultaneously to associate particular sounds with behavioural events. Based on this file annotation, each sound type from the differ-ent recordings was extracted manually using Audac-ity®(Version 2.1.1; Audacity Team 2015). Then, sub-sampled data from the converted recordings were analyzed between 1 and 78 kHz for the identified rat-tle sequences and between 60 and 500 Hz for identi-fied buzzing sound sequences. All sequences were
2 rectangular 2 2 2 f c l L m W n H
( )
( ) ( )
= + +processed using custom-made MATLAB (Version 9.1; 2016b) scripts. The following characteristics were calculated.
The sound pressure level (SPL, in dB re 1 µPa) was calculated for a time window equal to the length (T ) of the selected sound (Erbe 2010). For characterizing broadband and transient rattles, the peak-to-peak SPL, SPLpp, was calculated as:
SPLpp= 20log[max(p(t)) – min(p(t))] (3) where max( p(t)) is the maximum value and min( p(t)) the minimum value for the period, T. For continuous and narrowband buzzing sounds, the root-mean-square SPL, SPLrms, was calculated as:
(4)
The power spectral density was estimated by the periodogram, γ (in dB re 1 µPa2Hz−1):
(5) with P(f ) being the Fourier transformation at fre-quency f of the time-domain signal p(t):
(6) The peak frequency (fp, in Hz) is defined as the fre-quency at which the power spectral density is maxi-mal. If the power spectral density contains several peaks, the frequency of the largest peak is called the first peak frequency.
Frequency bandwidth (B, Hz), was estimated as the measurement of the spread of the power spectral density (standard error) around the first peak fre-quency:
(7)
Finally, in addition to rattles composed of trains of pulses (Fig. 1), we also calculated: (a) the duration of the entire sound (T1, in ms); (b) the pulse-to-pulse time interval (T2, in ms); (c) the total number of pulses per train (n); and (d) the pulse rate (R, in Hz), defined as the number of pulses per train (n) divided by the sound duration (T1). Time character-istics were calculated using the first attack of each pulse (Fig. 1).
Statistical analysis
Characteristics of postmolt and intermolt lobsters’ buzzing sounds were tested to determine whether differences between groups were significant. Con-sidering the small number of samples, and as suming that calculated variables for each individual can be assimilated to a random distribution, the non-para-metric Mann-Whitney (MW) test was used to de -termine whether their probability distributions were identical (significance level, α = 0.05).
SPLrms=20 log⎛⎝ 1
∫
( )2 ⎞⎠ T Tp t dt ( )f | ( )|P f 2 γ = ( ) ( ) –2 P f p t e j fdt T∫
= π ( ) ( ) ( ) 2 B f fp f dt f df∫
∫
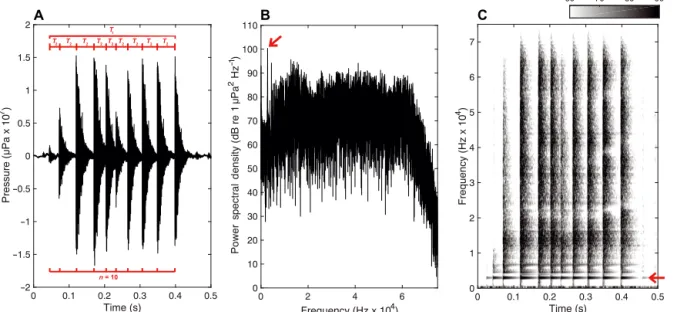
= − γ γFig. 1. Example of a typical rattle emitted in a 0.105 m3glass tank by a European lobster (10.6 cm carapace length) plotted
us-ing 3 different time-series analyses. (A) Oscillogram, showus-ing how the followus-ing characteristics were measured: the number of pulses per train (n), the duration of the entire sound (T1) and the pulse-to-pulse time interval (T2). Time characteristics were
calculated using the first attack of each pulse. (B) Acoustic spectrum (FFT size: 78126). (C) Spectrogram (FFT size: 1024; Ham-ming window: 501 points; 99% overlap). The red arrow indicates the first peak frequency (2.8 kHz) and corresponded to the
RESULTS
Distortion of a known sound through tank reverberation
From a white noise emitted, i.e. with the power spectral density being constant over a wide band of frequencies, signals recorded in different types of tanks were not flat and showed several peaks (Table 1). The first peak frequencies decreased as the dimensions of the tanks increased, ranging from 2.8 kHz for a 0.105 m3 tank to 1.8 kHz for the 2.34 m3 tank. These peaks occurred at frequency values matching the minimum theoretical resonant frequency calculated in the 0.105 m3 tank at 10 and 32 cm from the hydrophone (2.8 and 2.9 kHz, respec-tively). The same result was found for the 0.47 m3tank at 10 cm from the hydrophone (2 kHz), while peaks at 2.7 kHz at 42 and 72 cm were also found, correspon-ding to another resonant frequency calculated with the mode (2, 2, 1), even if the peak at 2 kHz was still present. For the 2.34 m3tank, the first frequency peak was 1.8 kHz for the 3 distances from the hydrophone, and corresponded to a resonant frequency of mode (1, 1, 2); a peak at 1.5 kHz (the minimum resonant fre-quency of this tank) was also present. The power spectral density of the recorded white noise showed several other peak frequencies up to the minimum resonant frequency in each tank (until almost 20 kHz).
Fig. 1 shows a rattle emitted by an intermolt male lobster (10.6 cm in CL) during feeding experiments in a 0.105 m3 tank. The first peak frequency of this broadband sound was 2.8 kHz (red arrow in Fig. 1), as also found for the recorded white noise in the same tank. It corresponded to the minimum resonant frequency of this tank, showing a net distortion of the sound.
Taking into account these results, we therefore cal-culated only time characteristics for the rattles, and SPL and spectral characteristics for buzzing sounds.
Recordings made during feeding
Rattles were defined as sound bursts consisting of a pulse train over a broadband spectrum (Fig. 1). A total of 168 rattles were recorded during feeding experiments with the 6 male lobsters (Table 2). These occurred when animals were feeding on all 3 types of foods. For almost 1 mo after molting, we did not record any rattles from the 3 soft lobsters, regardless of food type consumed. The time characteristics of these sounds were highly variable (Table 2): T1 varied be tween 44 and 960 ms (mean ± SD, 223.6 ± 145.2 ms), T2 varied between 1 and 89 ms (65.1 ± 13.8 ms), n varied be tween 3 and 41 pulses per train (12 ± 7.8) and R varied between 6.11 and 200 Hz (65.1 ± 39.2 Hz).
Tank size (m3) 0.105 0.47 2.34
Distance from hydrophone (cm) 10 32 10 42 72 10 80 150
fp(kHz) 2.8 (0) 2.8 (0) 2 (0) 2.7 (0) 2.7 (0) 1.8 (0) 1.8 (0) 1.8 (0)
frectangular(kHz) 2.9 2, 9 2 2 2 1.5 1.5 1.5
Table 1. Sound characteristics calculated for artificial white noise emitted at different distances from the source and in differ-ent tanks used for sound recording experimdiffer-ents. Results are presdiffer-ented as mean (± SD). No animals were presdiffer-ent during these
recordings. fp: peak frequency; frectangular: theoretical resonant frequency
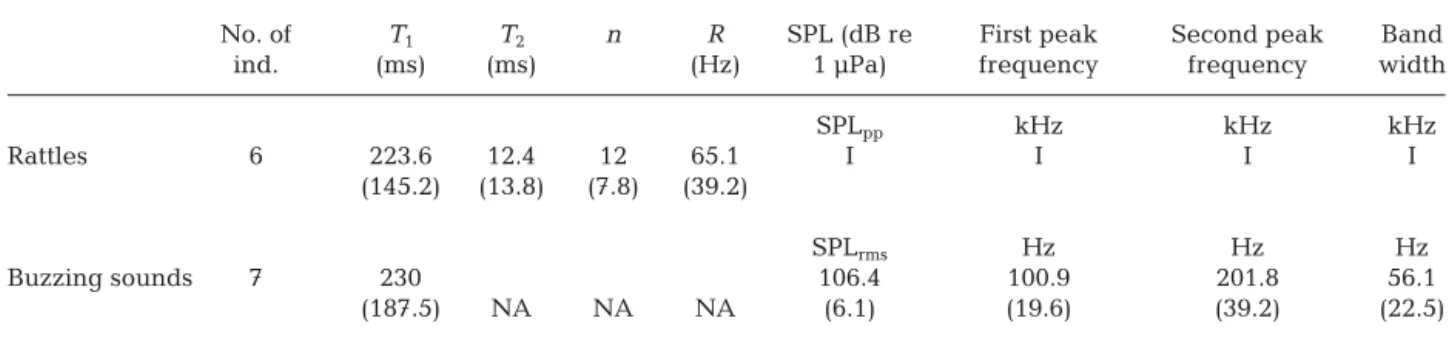
No. of T1 T2 n R SPL (dB re First peak Second peak Band
ind. (ms) (ms) (Hz) 1 µPa) frequency frequency width
SPLpp kHz kHz kHz Rattles 6 223.6 12.4 12 65.1 I I I I (145.2) (13.8) (7.8) (39.2) SPLrms Hz Hz Hz Buzzing sounds 7 230 106.4 100.9 201.8 56.1 (187.5) NA NA NA (6.1) (19.6) (39.2) (22.5)
Table 2. Sound characteristics calculated in the European lobster rattles and buzzing sounds. The results are presented as means (± SE). I: interference due to tank reverberation; NA: not applicable. T1: duration of the entire sound; T2: pulse-to-pulse
time interval; n: total number of pulses per train; R: pulse rate; SPLpp: peak-to-peak sound pressure level; SPLrms:
Carapace vibration in a response to stress Buzzing sounds were defined as continuous sounds with a narrowband spectrum. A total of 189 buzzing sounds were recorded as a stress response by 7 indi-viduals (1 intermolt female, 3 intermolt males and 3 postmolt males, ranging from 9 to 12 cm in CL) of the 17 lobsters tested (Table 2). These sounds occurred in association with carapace vibration (felt by hand) and were often associated with tail flips. Buzzing sounds were also recorded from the 2 most aggres-sive intermolt male lobsters (10.6 and 12 cm in CL) just before they attacked the hydrophone in the 0.105 m3 tanks during feeding experiments. These sounds had a mean first peak frequency of 100.9 Hz (range 66.6 to 152.6 Hz) and were mainly (92% of the analyzed recordings) accompanied by a second, strong harmonic with a mean frequency at second peak intensity of 201.8 Hz (range 123.2 to 305.2 Hz). The number of harmonics detected varied from 2 to >10 for the most intense buzzing sounds. The buzzing sounds tended to decrease in frequency over time (Fig. 2), showing a net, mean frequency modu-lation of 56.1 Hz when the onset dominant frequency was compared to the dominant frequency at the end of the sound. The harmonics showed the same pat-tern. Overall, the buzzing sounds had a mean SPL of 106.4 dB re 1 µPa rms (range 92.1−119.3 dB re 1 Pa rms), and could be as long as 1600 ms (mean = 230 ± 187.5 ms; Table 2).
The 3 soft lobsters tested during the feeding exper-iments were also observed to be capable of emitting buzzing sounds, and more frequently than the inter-molt lobsters. We observed no significant differences in buzzing sounds emitted between postmolt and intermolt lobsters in the sound duration, SPL and peak frequencies (MW, p > 0.05). However, the band -width was significantly larger for intermolt lobsters compared to postmolt lobsters (MW, p < 0.05). In addition, one postmolt lobster (12 cm CL) emitted 3 buzzing sounds with the highest SPL (>119 dB re 1 µPa rms) values observed here.
DISCUSSION
Quantification of bioacoustic signatures in tanks Characterizing reverberation in the different tanks required using known sound in order to be able to quantify how the tank geometry distorted sounds. As expected, reverberation distorted the white noise used in our tests for all the tanks. Several peak fre-quencies appeared corresponding to the calculated theoretical resonant frequencies of the different tanks (Table 1). The same result was also found for recordings of broadband rattles emitted by the lob-sters in these tanks (Fig. 1). Based on these observa-tions, and inspired by Akamatsu et al. (2002), we summarized these results as a guideline for charac-Fig. 2. Example of a buzzing sound produced in a 0.105 m3glass tank by a ‘soft’ (postmolt) European lobster (9.5 cm carapace
length) plotted using 3 different time-series analyses. (A) Oscillogram; (B) acoustic spectrum (FFT size: 46876); (C) spectro-gram (FFT size: 2048; Hamming window: 501 points; 99% overlap). The yellow arrow indicates instrumental self-noise from the recorder, the red arrow indicates first peak frequency and the blue arrow indicates the second harmonic. The color scale
terizing marine crustaceans’ sounds in small tanks (Table 3).
Although we recognize that this information exists in various forms in the acoustic literature, it seems important to present these guidelines directly to the bioacoustic community, where studies of crustaceans in tanks are frequently described in the literature (Hazlett & Winn 1962a,b, Meyer-Rochow & Pen rose 1974, 1976, Mulligan & Fischer 1977, Patek & Cald-well 2006, Patek & Baio 2007, Patek et al. 2009, Bus-caino et al. 2011, 2015, Coquereau et al. 2016a,b). Most of these studies did not attempt to quantify reverberation effects on the broadband and transient sounds. For example, Meyer-Rochow & Penrose (1976) found that spectral characteristics of the squeak produced by the rock lobster Palinurus
longipes were strongly influenced by the size and
material of their recording tanks, and finally con-cluded that the bandwidth was uniform over the audio range. Different types of sound characteristics are commonly presented in the bioacoustic literature, including: spectral characteristics (peak frequencies, bandwidth), time (duration, pulse rate, time inter-pulse) and measured energy (SPL) and source energy ((SL; i.e. SPL estimated at one distance from a source)). In our study, we have shown that spectral character-istics in transient and broadband sounds (such as rattles), which are usually produced by crustaceans, cannot be calculated in tanks.
In contrast, low-frequency sounds (such as buzzing) can be measured in tanks. Yet other analytical meth-ods based on SPL, such as SL estimated at 1 m from a source, do not appear reliable because of the sound
propagation models in use. As a reminder, Rogers et al. (2016) investigated transmission loss in the same range as our buzzing sounds in very small (0.03 m3) tanks. They showed an exponential decrease of 35 dB between 10 and 30 cm from the hydrophone, whereas based on the spherical spreading propaga-tion model commonly used, the expected transmis-sion loss would be estimated at only 10 dB. These results suggest that the SL values would also be unreliable in our experiments (Table 3). One solution to infer crustacean SLs in tank experiments would be to develop new propagation models, such as the one proposed by Rogers et al. (2016). This would require very accurate estimations of the source position, which is unfortunately not possible at this time for crustaceans because they are allowed to move freely in the tanks and thus cannot be considered as a fixed-point source.
Comparison with the bioacoustic literature Rattles emitted by Homarus gammarus during feeding were defined as trains of broadband pulses. In the present study, first peak frequency, bandwidth and SPL were not assessed because the recordings were highly distorted due to reverberation (Table 1, Fig. 1). Other authors have suggested that broad-band and transient sounds emitted by marine arthro-pods can be characterized by sampling only the ini-tial part of the signal (e.g. an interval less than 0.2 ms), which would correspond to a 1-way emission just before reverberation starts (Coquereau et al. 2016a). This method was not applied in the present study, because it would not determine whether the frequen-cies of transient sounds vary over time. For example, beaked whales emit sounds with very fast frequency modulations (Baumann-Pickering et al. 2013), which this type of signal sub-sampling would not account for. In addition, calculating a power spectral density with too few points may not fulfill the conditions for accurately estimating spectral characteristics. Thus, we preferred to focus on descriptors not impacted by tank reverberation, such as time characteristics: the duration of the entire sound, pulse-to-pulse time interval, number of pulses per train, and pulse rate.
The time characteristics of the lobsters’ rattles were consistent with the feeding sounds previously re -ported for tropical spiny lobsters. The mean entire duration of 223 ms was of the same order of magni-tude (Moulton 1957: 250 ms for Palinurus argus; MeyerRochow & Penrose 1976: 153 ms for P. lon
-gipes). Other types of feeding sounds recorded in
Sound Sound frequency
characteristic <fres >fres
Spectral shape Ok No
Time (duration) Ok No
Time (beginning Ok Ok (if sound is of the sound) separated enough
from other sound) SPL Ok Possible if f >> fres
SL No Possible if f >> fres
Examples from Buzzing Rattles this study (narrowband and (broadband and
continuous sounds) transient sounds) Table 3. Acoustic methodology showing which sound char-acteristics (spectral, time, energy) can be calculated in small tanks (example: 0.105 m3) depending on the type of recorded
sound. The sound characteristics were calculated selecting the entire sound. fres: minimum resonant frequency of the
tank; SPL: sound pressure level; SL: source energy (i.e. SPL estimated at one distance from a source)
temperate crustaceans had longer durations (Coquer -eau et al. 2016a: approximately 600 ms for Maja
brachydactyla; Coquereau et al. 2016b: approximately
400 ms for Cancer pagurus). The number of pulses per signal was calculated as (mean ± SD) 12 ± 7.8 on average for lobster rattles, which compares favourably with the reported 5 to 10 pulses per signal for spiny lobsters (Moulton 1957 for P. argus; Meyer-Rochow & Penrose 1976 for P. longipes), but is smaller than the mean of 29 ± 11 pulses per signal reported for M.
brachydactyla (Coquereau et al. 2016a). In a general
way, time characteristics in lobsters’ rattles were highly variable. These rattles may be produced by the friction between mouthparts (called ‘mandible grinding’ in Meyer-Rochow & Penrose 1976), sug-gesting unintentional sounds are produced and may thus account for some of this reported variability.
Similar to the American lobster, the European lob-ster also produces a buzzing sound (Henninger & Watson 2005) that could be recorded by the hydro -phone (Fig. 2). First peak frequencies in the Euro-pean lobster were within the range of reported first peak frequencies by Fish (1966; 100 to 130 Hz) and Henninger & Watson (2005; 87 to 261 Hz) for the American lobster. Sound durations, however, were highly variable (50 to 1600 ms), but were in the same range as those reported by both Fish (1966; between 100 and 500 ms) and Henninger & Watson (2005; between 68 to 1720 ms). In addition, the mean SPL was estimated to be about 10 dB re 1 µPa rms lower than for American lobsters (between 116.5 and 118.5 dB re 1 µPa rms; Fish 1966, Henninger & Watson 2005, Ward et al. 2011). A second strong harmonic was also observed in the European lobster that has not been described for the American lobster. The bandwidth showed how the buzzing sound de -creased in frequency over time, suggesting that these types of modulations may be a characteristic of this sound. Similar results have indeed already been re ported from stomatopods or mantis shrimp Hemis
-quilla californiensis, which generate tonal, low
fre-quency sounds called ‘rumbles’ (Patek & Caldwell 2006). These same authors also observed that the first peak frequencies of the rumbles were accompanied with a second strong harmonic. Staaterman et al. (2011) reported ‘rumbles’ recorded in the field close to our results for lobsters buzzing sounds (an average dominant frequency of 167 Hz and a mean duration of 200 ms). Apart from these 3 marine crustacean species, a number of other marine organisms also generate similar low frequency sounds, including whales and fish (Clark & Johnson 1984, Connaughton 2004, Maruska & Mensinger 2009).
Is there a role for buzzing sounds emitted by the European lobster?
Because of the lack of field observations in the eco-logical context in which buzzing sounds are gener-ated, it is only possible to speculate about their role based on comparisons with other organisms. As lob-sters produced vibrations when handled (this was already demonstrated in Henninger & Watson 2005), it has been suggested that buzzing sounds may serve to deter potential predators. These sounds have a narrow band width, suggesting that only organisms capable of perceiving sounds in the same band of fre-quencies might be targeted. Ward et al. (2011) showed that American lobsters vibrated when approached by 2 species of fish in a circular tank (cod and striped bass). Interestingly, the sound sensitivity of cephalo -pods, including octopuses, seems to be limited to low frequencies (100−200 Hz; Williamson 1988, Packard et al. 1990, Mooney et al. 2010). As the octopus is a well-known predator of European lobsters (Barshaw et al. 2003), these buzzing sounds may indeed be meant as a deterrence.
Buzzing sounds were also recorded just before 2 male lobsters attacked the hydrophone during feed-ing experiments. Lobsters are known to be territorial species living in burrows similar to those of mantis shrimp (Dingle & Caldwell 1969), and buzzing sounds might help to send signals of their presence to con-specifics in addition to chemical cues (Skog et al. 2009), to maintain territory. This type of behaviour was previously described in mantis shrimp (Patek & Caldwell 2006). Staaterman et al. (2011) recorded multiple rumbles of mantis shrimp in the field, which they termed ‘chorusing’. These rhythmic series, called ‘rumble groups’, may even constitute a type of conspecific communication.
Crustaceans, including lobsters, lack gas-filled organs (i.e. swim bladders) required for pressure de -tection, but may be still capable of detecting low-frequency acoustic stimuli arising from particle motion (Popper et al. 2001, Edmonds et al. 2016, Popper & Hawkins 2018), such as the buzzing sounds. A large diversity of sensory receptors has been described in crustaceans, including statocysts and sensory hairs (Popper et al. 2001, Radford et al. 2016). Two types of putative acoustic receptors on H. gammarus — hair-fan and hair-peg organs — have been implicated in low-frequency sound and water-current detection (Laverack 1962, 1963). In addition, one study focused on sound detection by H. americanus showed that they are capable of detecting sounds, with the most sensitive responses at the lower frequencies (be
-tween 18.7 and 150 Hz; Offutt 1970). Our results also showed that ‘soft’ (postmolt) lobsters were able to produce buzzing sounds with the same characteristics (except for their bandwidth) as ‘hard’ (intermolt) lob-sters. This suggests that the buzzing sounds may be a means of communication. New studies are needed to clearly examine the physiological and behavioural responses of European lobsters to such sounds.
Henninger & Watson (2005) showed that only 7.5% of their American lobsters (from a total of 1723 indi-viduals tested) vibrated when handled, despite the fact that all lobsters have the anatomical capacity to produce these sounds. Their year-long survey demon-strated that all size classes of American lobster can produce buzzing sounds, with a similar distribution for both males and females. In the present study, we observed that only 7 out of the 17 lobsters tested vibrated and produced buzzing sounds when han-dled. We recorded buzzing sounds in 6 male and only 1 female lobster, meaning that 1 male and 9 female lobsters did not vibrate. Due to the low number of individuals tested, and to the stress of captivity, which could habituate lobsters to being disturbed, we cannot yet explain this difference in sound pro-duction between individuals. Further, we do not know at which stage of their life cycle the mechanism of sound production becomes operational and biolog-ically useful in these animals.
Conclusions
Passive acoustic studies of marine crustaceans would clearly benefit from field measurements. In -deed, we emphasize that field studies are required to confirm the acoustic findings presented in this study and to test hypotheses about sound transmission and detection in natural soundscape. Preliminary characterization of European lobsters’ buzzing sounds, how ever, suggests these could be difficult to record be -cause they may be masked by other sources of low-frequency sounds, such as sea surface agitation re lated to wind speed (Wenz 1962) and anthropo -genic noise (Clark et al. 2009). In conclusion, acoustic measurements in carefully controlled laboratory condi -tions together with behavioural observa-tions re main an essential first step, and they should serve as a basis of comparison for any subsequent in situ research and monitoring projects.
Acknowledgements. We thank the aquariology staff of the public aquarium Océanopolis in Brest (France) for their technical support. We also thank the 2 anonymous referees
for comments on the manuscript. J.C.G.’s contribution was supported by the ‘Laboratoire d’Excellence’ LabexMER (ANR-10-LABX-19) and co-funded by a grant from the French government under the program ‘Investissements d’Avenir’. J.B.’s contribution was supported by ENSTA Bre-tagne (France) and by the Investment in Science Fund at WHO (USA). This project was funded by Benthoscope.
LITERATURE CITED
Agnalt AL, Kristiansen TS, Jørstad KE (2007) Growth, repro-ductive cycle, and movement of berried European lobsters (Homarus gammarus) in a local stock off south-western Norway. ICES J Mar Sci 64: 288−297
Akamatsu T, Okumura T, Novarini N, Yan HY (2002) Empir-ical refinements applicable to the recording of fish sounds in small tanks. J Acoust Soc Am 112: 3073−3082 Au WWL, Banks K (1998) The acoustics of the snapping
shrimp Synalpheus parneomeris in Kaneohe Bay. J Acoust Soc Am 103: 41−47
Audacity Team (2015) Audacity® version 2.1.1. www. audacityteam.org
Barshaw DE, Lavalli KL, Spanier E (2003) Offense versus defense: responses of three morphological types of lobsters to predation. Mar Ecol Prog Ser 256: 171−182 Baumann-Pickering S, McDonald MA, Simonis AE, Solsona
Berga A, and others (2013) Species-specific beaked whale echolocation signals. J Acoust Soc Am 134: 2293−2301
Boon PY, Yeo DCJ, Todd PA (2009) Sound production and reception in mangrove crabs Perisesarma spp. (Brachy -ura: Sesarmidae). Aquat Biol 5: 107−116
Bouwma PE, Herrnkind WF (2009) Sound production in Caribbean spiny lobster Panulirus argus and its role in escape during predatory attack by Octopus briareus. N Z J Mar Freshw Res 43: 3−13
Buscaino G, Filiciotto F, Gristina M, Bellante A and others (2011) Acoustic behaviour of the European spiny lobster Palinurus elephas. Mar Ecol Prog Ser 441: 177−184 Buscaino G, Gavio MA, Galvan DE, Filiciotto F, and others
(2015) Acoustic signals and behaviour of Ovalipes tri-maculatus in the context of reproduction. Aquat Biol 24: 61−73
Clark CW, Johnson JH (1984) The sounds of the bowhead whale, Balaena mysticetus, during the spring migrations of 1979 and 1980. Can J Zool 62: 1436−1441
Clark CW, Ellison WT, Southall BL, Hatch L and others (2009) Acoustic masking in marine ecosystems: intu-itions, analysis, and implication. Mar Ecol Prog Ser 395: 201−222
Cobb JS, Wahle R (1994) Early life history and recruitment processes of clawed lobsters. Crustaceana 67: 1−25 Connaughton MA (2004) Sound generation in the searobin
(Prionotus carolinus), a fish with alternate sonic muscle contraction. J Exp Biol 207: 1643−1654
Coquereau L, Grall J, Chauvaud L, Gervaise C, Clavier J, Jolivet A, Di Iorio L (2016a) Sound production and asso-ciated behaviours of benthic invertebrates from a coastal habitat in the north-east Atlantic. Mar Biol 163: 127 Coquereau L, Grall J, Clavier J, Jolivet A, Chauvaud L
(2016b) Acoustic behaviours of large crustaceans in NE Atlantic coastal habitats. Aquat Biol 25: 151−163 Dingle H, Caldwell RL (1969) The aggressive and territorial
behaviour of the mantis shrimp Gonodactylus bredini Manning (Crustacea: Stomatopoda). Behaviour 33: 115−136
Duncan AJ, Lucke K, Erbe C, McCauley RD (2016) Issues associated with sound exposure experiments in tanks. Proc Meet Acoust 27: 070008
Edmonds NJ, Firmin CJ, Goldsmith D, Faulkner RC, Wood DT (2016) A review of crustacean sensitivity to high amplitude underwater noise: data needs for effective risk assessment in relation to UK commercial species. Mar Pollut Bull 108: 5−11
Erbe C (2010) Underwater acoustics: noise and the effects on marine mammals. JASCO Applied Sciences, Brisbane Fish JF (1966) Sound production in the American lobster,
Homarus americanus H. Milne Edwards (Decapoda Reptantia). Crustaceana 11: 105−106
Guinot-Dumortier D, Dumortier B (1960) La stridulation chez les crabes. Crustaceana 1: 117−155
Hazlett BA, Winn HE (1962a) Sound production and asso -ciated behavior of Bermuda crustaceans (Panulirus, Gonodactylus, Alpheus, and Synalpheus). Crustaceana 4: 25−38
Hazlett BA, Winn HE (1962b) Characteristics of a sound pro-duced by the lobster Justitia longimanus. Ecology 43: 741−742
Henninger HP, Watson WH (2005) Mechanisms underlying the production of carapace vibrations and associated waterborne sounds in the American lobster, Homarus americanus. J Exp Biol 208: 3421−3429
Holthuis LB (1991) Marine lobsters of the world. An anno-tated and illustrated catalogue of species of interest to fisheries known to date. FAO Species Catalogue, Vol. 13, FAO, Rome
Knowlton RE, Moulton JM (1963) Sounds production in the snapping shrimps Alpheus (Crangon) and Synalpheus. Biol Bull 125: 311−331
Laverack MS (1962) Responses of cuticular sense organs of the lobster, Homarus vulgaris (Crustacea) — II. Hair-fan organs as pressure receptors. Comp Biochem Physiol 6: 137−145
Laverack MS (1963) Responses of cuticular sense organs of the lobster, Homarus vulgaris (Crustacea) — III. Activity invoked in sense organs of the carapace. Comp Biochem Physiol 10: 261−272
Maruska KP, Mensinger AF (2009) Acoustic characteristics and variations in grunt vocalizations in the oyster toad-fish Opsanus tau. Environ Biol Fishes 84: 325−337 Mendelson M (1969) Electrical and mechanical
characteris-tics of a very fast lobster muscle. J Cell Biol 42: 548−563 Meyer-Rochow VB, Penrose JD (1974) Sound and sound emission apparatus in puerulus and postpuerulus of the western rock lobster (Panulirus longipes). J Exp Zool 189: 283−289
Meyer-Rochow VB, Penrose JD (1976) Sound production by the western rock lobster Panulirus longipes (Milne Edwards). J Exp Mar Biol Ecol 23: 191−209
Mooney TA, Hanlon RT, Christensen-Dalsgaard J, Madsen PT, Ketten DR, Nachtigall PE (2010) Sound detection by the longfin squid (Loligo pealeii) studied with auditory evoked potentials: sensitivity to low-frequency particle motion and not pressure. J Exp Biol 213: 3748−3759 Moulton JM (1957) Sound production in the spiny lobster
Panulirus argus (Latreille). Biol Bull 113: 286−295 Mulligan BE, Fischer RB (1977) Sounds and behavior of the
spiny lobster Panulirus argus (Latreille, 1804) (Deca poda, Palinuridae). Crustaceana 32: 185−199
Offutt GC (1970) Acoustic stimulus perception by the Amer-ican lobster Homarus amerAmer-icanus (Decapoda). Experientia 26: 1276−1278
Packard A, Karlsen HE, Sand O (1990) Low frequency hear-ing in cephalopods. J Comp Physiol A 166: 501−505 Parvulescu A (1964) Problems of propagation and
process-ing. In: Tavolga WN (ed) Marine bioacoustics. Pergamon Press, Oxford, p 87−100
Parvulescu A (1967) The acoustics of small tanks. In: Tavolga WN (ed) Marine bioacoustics. Pergamon Press, Oxford, p 7−13
Patek SN (2001) Spiny lobsters stick and slip to make sound. Nature 411: 153−154
Patek SN, Baio J (2007) The acoustic mechanics of stick−slip friction in the California spiny lobster (Panulirus inter-ruptus). J Exp Biol 210: 3538−3546
Patek SN, Caldwell RL (2006) The stomatopod rumble: low frequency sound production in Hemisquilla californien-sis. Mar Freshwat Behav Physiol 39: 99−111
Patek SN, Shipp LE, Staaterman ER (2009) The acoustics and acoustic behavior of the California spiny lobster (Panu -lirus interruptus). J Acoust Soc Am 125: 3434−3443 Pierce AD (1981) Acoustics. McGraw-Hill, New York, NY Popper AN, Hawkins AD (2018) The importance of particle
motion to fishes and invertebrates. J Acoust Soc Am 143: 470−488
Popper AN, Salmon M, Horch KW (2001) Acoustic detection and communication by decapod crustaceans. J Comp Physiol A 187: 83−89
Radford CA, Tay K, Goeritz ML (2016) Hearing in the paddle crab, Ovalipes catharus. Proc Meet Acoust 27: 010013 Rogers PH, Hawkins AD, Popper AN, Fay RR, Gray MD
(2016) Parvulescu revisited: small tank acoustics for bioa-cousticians. In: The effects of noise on aquatic life II. Springer, New York, NY, p 933−941
Schroeder MR (1996) The ‘Schroeder frequency’ revisited. J Acoust Soc Am 99: 3240−3241
Sheehy MRJ, Bannister RCA, Wickins JF, Shelton PMJ (1999) New perspectives on the growth and longevity of the European lobster (Homarus gammarus). Can J Fish Aquat Sci 56: 1904−1915
Skog M, Chandrapavan A, Hallberg E, Breithaupt T (2009) Maintenance of dominance is mediated by urinary chemical signals in male European lobsters, Homarus gammarus. Mar Freshwat Behav Physiol 42: 119−133 Smith IP, Collins KJ, Jensen AC (1998) Movement and ac
-tivity patterns of the European lobster, Homarus gam-marus, revealed by electromagnetic telemetry. Mar Biol 132: 611−623
Staaterman ER, Clark CW, Gallagher AJ, de Vries MS, Claverie T, Patek SN (2011) Rumbling in the benthos: acoustic ecology of the California mantis shrimp Hemis -quilla californiensis. Aquat Biol 13: 97−105
Tyack PL, Clark CW (2000) Communication and acoustic behavior of dolphins and whales. In: Au WWL, Popper AN, Fay RR (eds) Hearing by whales and dolphins. Springer, New York, NY, p 156−224
Versluis M, Schmitz B, von der Heydt A, Lohse D (2000) How snapping shrimp snap: through cavitating bubbles. Science 289: 2114−2117
Ward D, Morison F, Morrissey E, Jenks K, Watson WH (2011) Evidence that potential fish predators elicit the production of carapace vibrations by the American lobster. J Exp Biol 214: 2641−2648
Wenz GM (1962) Acoustic ambient noise in ocean spectra and sources. J Acoust Soc Am 34: 1936−1956
Williamson R (1988) Vibration sensitivity in the statocyst of the northern octopus, Eledone cirrosa. J Exp Biol 134: 451−454
Editorial responsibility: Victor Benno Meyer-Rochow, Oulu, Finland
Submitted: December 6, 2017; Accepted: March 9, 2018 Proofs received from author(s): April 23, 2018