HAL Id: hal-03237191
https://hal.archives-ouvertes.fr/hal-03237191
Submitted on 27 May 2021
HAL is a multi-disciplinary open access
archive for the deposit and dissemination of
sci-entific research documents, whether they are
pub-lished or not. The documents may come from
teaching and research institutions in France or
abroad, or from public or private research centers.
L’archive ouverte pluridisciplinaire HAL, est
destinée au dépôt et à la diffusion de documents
scientifiques de niveau recherche, publiés ou non,
émanant des établissements d’enseignement et de
recherche français ou étrangers, des laboratoires
publics ou privés.
Distributed under a Creative Commons Attribution| 4.0 International License
Lyonnais lobe ice front during the last glacial period
(France, Northern Alps).
Thibault Roattino, Christian Crouzet, Jean-Francois Buoncristiani, Hélène
Tissoux
To cite this version:
Thibault Roattino, Christian Crouzet, Jean-Francois Buoncristiani, Hélène Tissoux. Geometry of
glaciofluvial deposits and dynamics of the Lyonnais lobe ice front during the last glacial period (France,
Northern Alps).. Bulletin de la Société Géologique de France, Société géologique de France, 2021, 192,
pp.21. �10.1051/bsgf/2021012�. �hal-03237191�
Geometry of glacio
fluvial deposits and dynamics of the Lyonnais
lobe ice front during the last glacial period (France, Northern Alps)
Thibault Roattino
1,*, Christian Crouzet
1, Jean-Francois Buoncristiani
2and Hélène Tissoux
31
Université Savoie Mont-Blanc, Université Grenoble Alpes, CNRS, IRD, IFSTTAR, ISTERRE, Chambéry, France
2
Biogéosciences, UMR 6282 CNRS / Université Bourgogne Franche-Comté, Dijon, France
3 BRGM, Unité Géologique de l’Aménagement des Territoires, Orléans, France
Received: 24 June 2020 / Accepted: 25 March 2021 / Publishing online: 14 April 2021
Abstract – Previous studies in the foreland of the French Western Alps, based on the analysis of geomorphological criteria for the internal moraine complex, show several stages of retreat or stagnation of the Lyonnais ice lobe during marine isotopic stages 4 and 2. Based on chronological data of the literature, the age of the Würmian maximum extension of the Lyon ice lobe must have occurred during MIS 4 but this result is still debated. At the Last Glacial Maximum, in the western part of the Lyonnais ice lobe, glaciofluvial corridors were active during flash floods draining glacial meltwater. Today, these corridors are dead valleys and display a series of terraces. In this paper, we analyse the sedimentary geometries and dynamics of three glaciofluvial corridors (Moidieu, Septeme and Heyrieux) located at the front of the internal moraine complex of the Lyonnais ice lobe. Upstream, the Moidieu corridor splits into three branches called North Moidieu, Central Moidieu and South Moidieu. Glaciofluvial deposits in the corridors are composed of pebbles and gravels in a sandy matrix. Sedimentary structures show massflow events and the migration of river bars in braided channels which are characteristic of proximal glaciofluvial rivers in a proglacial environment. According to a new geomorphological map built using a high-resolution digital elevation model and an isopach map of the Quaternary deposits created from a compilation of the borehole data, we suggest that these corridors correspond to“tunnel valleys” built during the most extensive Riss glaciation. Then during the Würm maximum glacial extension, these “tunnel valleys” show complex infilling by glacio-fluvial sediments during the Würmian maximal extent. In the three corridors, the number of river terraces can be better defined by using new geomorphological analyses. A total of three Würm terraces can be observed: two in the north and three in the south. This difference between the south and north is probably a result of climatic and tectonic forcing.
Keywords: Lyonnais lobe / Würm / geomorphology / sedimentology / glaciofluvial / Moraines
Résumé – Géométrie et dynamiques des dépôts fluvio-glaciaires du front du lobe lyonnais pendant la dernière période glaciaire (France, Alpes du Nord).Les études précédentes dans l’avant-pays des Alpes occidentales françaises, basées sur des critères géomorphologiques du complexe morainique interne, montrent de nombreux stades de recul ou de stagnation du glacier du lobe lyonnais associés aux stades isotopiques marins (MIS) 4 et 2. D’après les données chronologiques de la littérature, l’extension maximale würmienne du lobe lyonnais aurait eu lieu durant le MIS 4, mais ces résultats sont encore débattus. Pendant le dernier maximum glaciaire (LGM), dans la partie occidentale du lobe lyonnais, des couloirs fluvio-glaciaires étaient actifs pendant des crues éclairs liées aux eaux de fonte glaciaire. Aujourd’hui, ces couloirs sont des vallées mortes et présentent une série de terrasses. Dans cet article, la géomorphologie et la dynamique sédimentaire de trois couloirsfluvio-glaciaires (Moidieu, Septème et Heyrieux) situés à l’avant du complexe morainique interne du lobe lyonnais ont été analysées. Le couloir de Moidieu se ramifie en trois branches à l’amont. Une analyse sédimentologique dans plusieurs gravières a permis de reconstituer les paléoenvironnements de dépôt. Les dépôts fluvio-glaciaires des couloirs sont composés de galets et de graviers dans une matrice sableuse. Les structures sédimentaires montrent des événements d’écoulement en masse et des dépôts de barres de migration de chenaux en tresses caractéristiques des rivières fluvio-glaciaires proximales dans un environnement pro-glaciaire. La carte géomorphologique établie à l’aide d’un
*Corresponding author:thibault.roattino@univ-savoie.fr
https://doi.org/10.1051/bsgf/2021012
Available online at:
www.bsgf.fr
modèle numérique de terrain (MNT) à haute résolution et la carte isopaque du Quaternaire déduite de la compilation des données de forage suggèrent que les couloirs fluvio-glaciaires sont hérités de « vallée tunnel ». Ce processus d’érosion a probablement été actif pendant la glaciation du Riss. Les couloirs ont ensuite été remplis par les dépôtsfluvio-glaciaires pendant l’extension glaciaire maximale du Würm. Dans les trois corridors, le nombre de terrasses a été défini grâce à de nouvelles analyses géomorphologiques. Au total, trois terrasses würmiennes peuvent être observées : deux au nord et trois au sud. Cette différence entre le sud et le nord est probablement le résultat d’un forçage climatique et tectonique.
Mots clés : Lobe lyonnais / Würm / géomorphologie / sédimentologie /fluvio-glaciaires / Moraines
1 Introduction
Quaternary glacial extent in the French Alps has been studied since the 19th century. These studies have primarily focused on the identification of erratic boulders and the mapping of moraine structures (Falsan and Chantre, 1879). Two moraine complexes have been identified in the marginal zone around the Alps and the Jura Mountains (Penck and Brückner, 1909). The external moraines complex is attributed to the Riss glaciation in the Northern French Alps, probably corresponding to marine isotopic stages (MIS) 8 to 6. A more internal moraines complex records the Würm glaciation corresponding to MIS 4 and 2 (Buoncristiani and Campy, 2011). Alpine glaciersflowed down to their foothills forming piedmont glaciers with several ice lobes during the Last Glacial Maximum (LGM). Very large ice lobes are located north of the Alps, which are from the west to east the Lyonnais, Rhône, Reuss, Rhine and Isar-Loisach ice lobes. These ice lobes are much smaller in the southern part of the Alps, e.g. the Ivrea, Ticino, Oglio, Garda and Tagliamento ice lobes (Ehlers and Gibbard, 2004) (Fig. 1).
Several studies carried out in Switzerland, Austria and Italy have dated the age of the LGM as between 30 and 18 ka (Heiri et al., 2014;Wirsig et al., 2016). The age of the LGM is dated as between 25 and 22 ka in the Jura Massif (Buoncristiani and Campy, 2004). Radiocarbon (14C) ages on wood fragments in the southern French Alps, more precisely in the Durance glacial deposit, show a maximal glacial extension close to 18 ka (Jorda et al., 2000). Previous studies in the western Alps suggest two correlation hypotheses for the last maximal glacial extent with the Greenland isotopic record. First hypothesis based on the radiocarbon dating on plant remains and lacustrine paleomagnetic secular variations profiles suggests the beginning of the LGM between the isotopic stage 4 and 5. The second hypothesis rely on collagen of bones and tusks dating deem the beginning of the last maximal glacial extent between the isotopic stage 2 and 3 (Schoeneich, 1998). In this last hypothesis, the last maximal glacial extent in the western Alps would correspond to the global LGM.
Glaciofluvial corridors exist at the front of the Lyonnais ice lobe, displaying several glaciofluvial terraces built during the last maximal glacial extent and the different glacial retreats stages (Mandier, 1984). These palaeo-sandurs are currently dead valleys in which fresh outcrops can be accessed via several gravel pits. The goal of this study is to determine the geometry and to analyse the sedimentology of these three glaciofluvial corridors which are geomorphologically associ-ated with the moraines of the Lyonnais ice lobe. This research will provide new geomorphological and sedimentological data
so as to better understand interactions between climate and uplift, in order to determine how these factors, control glaciofluvial sedimentation and incision.
2 Geological setting
The Lyonnais ice lobe is located in the lower“Dauphiné” region in the western part of the French Alps. The study area corresponds to the southern part of the Lyonnais ice lobe, and it integrates the Moidieu, Septeme and Heyrieux palaeo-fluvial corridors (Fig. 2). The pre-Quaternary substratum in this area corresponds mainly to Miocene sediment deposited within the Rhône Graben and in the western part to the Paleozoic basement (Sissingh, 2001). Two Miocene lithologies are described. The most abundant facies contains silt and micaceous sand which are locally cemented in sandstone. The second facies is a very discontinuous continental conglomerate with eastward increasing occurrence and thickness. The pre-Quaternary basement, close to the Rhône Valley, corresponds to metamorphic and plutonic Palaeozoic rocks. They are only exposed in areas downstream from the corridors (Chenevoy et al., 1969;Chenevoy et al., 1971;Elmi et al., 1986;Sissingh, 2001).
According to the petrography of the erratic blocks and the various paleogeographic reconstructions, the ice that feeds the Lyon ice lobe would haveflowed from the Mont-Blanc and Beaufortain massifs (Mandier, 2003; Buoncristiani and Campy, 2011), but also probably from the Tarentaise and part of the Maurienne accumulation zone (Mandier, 2003;
Coutterand et al., 2009; Coutterand, 2010). Quaternary deposits correspond to the LGM internal moraine complex and glaciofluvial outwash deposits (Delafond, 1889; Gigout, 1960; David, 1967). The glaciofluvial bodies are located in three corridors, Moidieu, Septeme and Heyrieux (Fig. 2), where fluvial terraces are geomorphologically connected to frontal moraines. Using both fluvial terraces and frontal moraines,five stages of retreat are identified (labelled A to E) (Mandier, 1984). Stage A, called “old Würm”, is older than 35 ka (beyond the14C analytic limit) (Vilain et al., 1988) and represents the maximal extension of the Lyonnais ice lobe during the Würm period (Mandier, 2003). Stages B and C result from the limited recession of the glacier. During stage D, the glacier has retreated enough eastward, and glaciofluvial corridors are no longer supplied by glacial meltwater. Stage E corresponds to a decay stage of the glacier (Mandier, 1984) that left deposits on the downslope of the Alpine and Jura massifs. This last stage probably occurred at around 18 250 cal. BP (Mandier et al., 2003).
3 Methods
3.1 Geomorphological map
A new geomorphological map of the glaciofluvial corridors is established using a high-resolution digital elevation model (DEM) RGE ALTI®5 m published by the French National Institute of Geographic and Forest Informa-tion (IGN®). The DEM have a resolution of 5 m, and the Lambert 93 projection system and RGF93 local geodesic system are used.
Würmian moraines andfluvial terraces are identified either based on their morphology on the DEM and new field observations or by using geological maps and previous studies (Mandier, 1984). Moreover, fluvial terraces and erosion channels are identified based on slope analysis, and more precisely two slope ranges defined with Qgis. The first span, between 1.5° and 5°, is used to show erosional channels and erosional bank. The second slope interval (between 4° and 16°) highlights the margins of the terraces. Terraces are correlated from one side of the valley to the other one using transverse topographic sections. Along a valley, longitudinal topographic sections are used to make correlations both between the terraces and with the moraines. Longitudinal profiles of the terraces are constructed for the Moidieu corridor (three profiles), Septeme corridor (one profile) and Heyrieux corridor (one profile). Longitudinal profiles are calculated as a dimensionless curve in order to better compare the three
corridors. The standardization is carried out from altitude H at the point of measurement normalized by the altitude from the outlet river to headwaters Ho. The length of a stream from the river head to a measured point L is normalized by the total river length Lo (Demoulin, 1998). The Langbein concavity index (CI) is calculated to quantify the differential concavity for each profile. It is defined as follows:
CI ¼2A H;
where A is the difference of altitude measured between the profile at the middle of the corridor length and a straight line linking the two endpoints of the profile, and H is the altitude between the headwaters and the outflow (Fig. 3) (Langbein, 1964).
3.2 Field investigations
In the field area, the best outcrops for sedimentological investigations are gravel pits. Therefore, we studied four quarries located at Artas, Eyzin-Pinet, Oytier and St Pierre de Chandieu (Fig. 2). Fresh outcrops in gravel pits provided the opportunity to identify the lithological, textural and structural characteristics of glaciofluvial deposits with very good outcropping conditions. It was also possible to identify the underlying Miocene molassic sandstones and conglomerates at
Fig. 1. Map of the extension of the Alpine glaciers during the Last Glacial Maximum (Ehlers et al., 2011) showing the ice lobes on the main piedmonts.
Fig. 1. Carte d’extension des glaciers alpins pendant le dernier maximum glaciaire (Ehlers et al., 2011) montrant les principaux lobes glaciaires de piémont.
the bottom of the excavations in particular at St Pierre de Chandieu. By describing facies in thefield, it was possible to define the characteristics of the very upper part of the Miocene
and of the Quaternary deposits. These characteristics were then used in this study when reinterpreting the borehole data.
A composite synthetic log (Fig. 4) was built from two sections observed in two gravel pits. Basal parts (A, B and C) come from the St Pierre de Chandieu gravel pit and the upper parts (C and D) come from Eyzin-Pinet gravel pit. Contact between basal and upper part was also observed.
3.3 Borehole data
Stratigraphical and petrographical descriptions of the boreholes are available on Infoterre’s website (http://infoterre. brgm.fr/viewer/MainTileForward.do) from the French geologi-cal survey (BRGM) database (Banque du Sous Sol). In the study area, 152 boreholes were used to construct geological sections. Borehole descriptions can be used to identify the Quaternary deposits. The depth of the Miocene molasse is generally determined from drilling data well as petrographical characte-ristics defined during field observations. However, in the
Fig. 2. Map of the external (Riss) and internal (Würm) moraine complexes of the Lyonnais ice lobe including the three studied corridors: the Moidieux, Septeme and Heyrieux corridors. The squares with black borders show the location of the studied gravel pits. A: Artas gravel pit; EP: Eyzin-Pinet gravel pit; SPC: St Pierre-de-Chandieu gravel pit; O: Oytier gravel pit. The longitudinal profiles of the terraces shown in
Figure 5are indicated by red dotted lines. MSP: Moidieu south profile; MCP: Moidieu central profile; MNP: Moidieu north profile; SP: Septeme
profile; HP: Heyrieux profile.
Fig. 2. Carte du complexe des moraines internes et externes du lobe lyonnais incluant les trois couloirs étudiés (Moidieu, Septeme et Heyrieux). Les carrés à bordures noirs indiquent les positions des carrières étudiées. A : Carrière d’Artas ; EP : Carrière d’Eyzin-Pinet ; SPC : Carrière de St Pierre-de-Chandieu ; O : Carrière de Oytier. Les positions des profiles longitudinaux des terrasses données en lafigure 5sont indiquées par les lignes rouges pointillées. MSP : Profil de Moidieu sud ; MCP : Profil de Moidieu centre ; MNP : Profil de Moidieu nord ; SP : Profile de Septeme ; HP : Profil d’Heyrieux.
Fig. 3. Variables A and H of the Langbein concavity index represented on a schematic river profile.
Fig. 3. Variables H et A de l’indice de concavité de Langbein représenté sur un profil de rivière schématique.
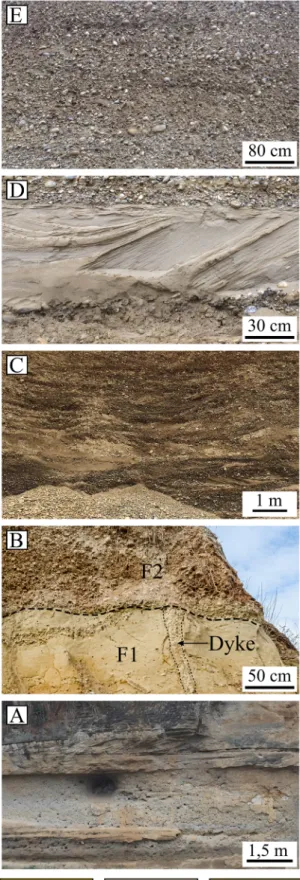
Fig. 4. Summary log representative of the Würmian terraces showing the three sedimentological facies (F1, F2 and F3) found in four gravel pits. Photos A, B, C, D and E illustrate the lithologies. Notice that facies F3 is a combination of massive gravel beds (D) and sandy lenses (C). Fig. 4. Log synthétique représentatif des terrasses würmiennes montrant les trois faciès sédimentaires (F1, F2 et F3) trouvés dans les quatre carrières. Les photos A, B, C, D et E illustrent les différentes lithologies. Les photos C et D représentent respectivement une lentille sableuse et le conglomérat du faciès F3.
database, some borehole descriptions are sometimes imprecise and it was possible to correct several misinterpretations through observations made on the quarry sections. Therefore, it is sometimes difficult to identify the various different quaternary facies and to determine the depth of the top of the Miocene. Thus, boreholes that cannot provide obvious distinctions between quaternary facies and the Miocene were not used. Finally, enough boreholes provided relevant data to construct geological sections in the Moidieu and Heyrieux corridors. There were not enough available boreholes in the Septeme corridor.
3.4 Isopach map
An isopach map of the Quaternary deposits in the studied corridors is obtained from the analysis and re-interpretation of the 110 boreholes in our database. To complete this map, 32 Miocene outcrop points are also added when they are identified from field observations and geological maps around the corridors. All of the outcrop points used to
construct the isopach map are located in the area encompassing the glaciofluvial corridors as well as on their hillside. Using the points displaying the depth of the Miocene, the interpolation surface, corresponding to the footwall of the Quaternary, is calculated by ordinary kriging using SAGA. When this surface is subtracted from the DEM, the isopach map of the Quaternary deposit is generated. An isopach map of the Septeme corridor was not created due to a lack of boreholes reaching the molassic bedrock in this area.
4 Results
4.1 Geomorphological map
Maximal length and width of the three corridors is 35 km long and 2.5 km wide for Moidieu corridor, 20 km long and 2 km wide for Septeme corridor and lastly 20 km long and 4.5 km wide for Heyrieux corridor.
Fig. 5. Geomorphological map showing the fluvial terraces and erosional channels of the Moidieu, Septeme and Heyrieux corridors at the front of the internal moraine complex of the Lyonnais ice lobe and the main post-glacialfluvial and colluvium deposits found in the study area. 50 m isolines of rock uplift come from numerical modelling of Quaternary erosion-induced alpine isostasy fromChampagnac et al. (2007). Geodesic system used: WGS84, Projection system used: Lambert 93, Graticule units: Degrees minutes seconds.
Fig. 5. Carte géomorphologique montrant les terrasses fluviatiles et les chenaux d’érosion des couloirs de Moidieu, Septeme et Heyrieux au front du complexe des moraines internes du lobe lyonnais ainsi que les principaux dépôtsfluviaux post-glaciaires et de colluvion et/ou petits cônes de déjection locaux de la zone d’étude. Les isolignes 50 m d’uplift proviennent d’une modélisation de l’isostasie alpine induite par l’érosion quaternaire (Champagnac et al., 2007). Système géodésique utilisé : WGS84, Système de projection utilisé : Lambert 93, Unité des graticules : Degrés minutes secondes.
In the Moidieu, Septeme and Heyrieux corridors, the geomorphological map shows the following four terraces (from high to low altitude): FgR, FgW1, FgW2 and FgW3, which are respectively geomorphologically connected to four different groups of moraines MR, MW1, MW2 and MW3. The other morphologies that can be observed are erosional channels and non-glacial deposits such as colluviums and post-glacialfluvial deposits (Fig. 5).
The FgR terraces are the highest of all the evidenced terraces in the studied area. They cannot be geomorpholog-ically connected to any moraines of the internal morainic complex. They also cannot be linked with the external morainic complex as this latter is far to the west. These FgR terraces are probably built during retreat phase of the penultimate glaciation and therefore they lie above the erosional surface of the Rissian glacier.
Terraces FgW1, FgW2 and FgW3 are correlated with moraines belonging to the internal moraine complex. Among them, the FgW1 terraces are the highest terraces and are associated with the most external MW1 moraines. The FgW2 terraces, found at mid-altitude, are connected to intermediate-position MW2 moraines. The FgW3 terraces are the lowest terraces correlated with the innermost MW3 moraines. The FgW1, FgW2 and FgW3 terraces gradually change from being well expressed and become unidentifiable toward the downstream part of the whole palaeosandur.
In the Moidieu corridor, the four terraces, FgR, FgW1, FgW2 and FgW3, have been identified. All of the moraines associated with the different branches of the Moidieu corridor are located at an altitude of approximately 500 m on the westward slope. In the downstream part, starting from thefirst confluence of the corridor, FgW1, FgW2 and FgW3 terraces are merged (Figs. 5and6A–6C).
The Septeme corridor show a small-sized FgW1 terrace upstream of the palaeosandur connected to a few poorly-preserved MW1 moraines located at an altitude of approxi-mately 320 m. This terrace is surrounded by a FgW2 terrace connected to a set of MW2 moraine ridges at an altitude of approximately 250 m and is located on the edge of Verpillère trough (Figs. 5and6D).
The Heyrieux corridor shows a broad FgW1 terrace connected to a NNE-SSW oriented MW1 moraine and a FgW2 terrace correlated with a NW-SW oriented MW2 moraine. FgW2 is delimited by a discontinuous and poorly preserved slope representing erosional gash. FgW1 and FgW2 merge roughly six kilometres downstream from the moraines. MW1 and MW2 are located at an altitude of approximately 280 m and directly border the Verpillère trough (Figs. 5and6E).
The longitudinal profiles of the terraces connected to the moraines of the three corridors show distinct characteristics that are highlighted by their concavity index (CI). In the present work, this index was calculated from longitudinal profiles of FgW1 and FgW2 terraces that are present in all three corridors. The three profiles of the Moidieu corridor show a relatively straight shape (Figs. 6A–6C) which is confirmed by
the low CI values (Fig. 6F). The Septeme and Heyrieux profiles are more concave (Figs. 6D and6E) with relatively high CI values (Fig. 6F). Downstream knickpoints (K) located on all profiles correspond to a lithological transition between the Miocene sands and the metamorphic and plutonic Palaeozoic basement rocks.
4.2 Isopach maps
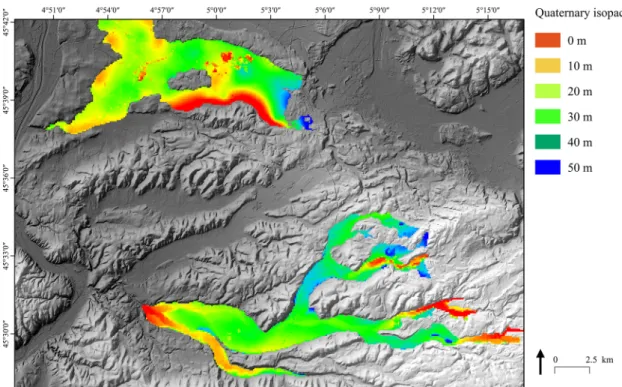
The thickness of the Quaternary deposits in the Heyrieux corridor is greater in the upstream part (approximately 50 m) than in the downstream part (only a few meters) (Fig. 7). The same pattern is also displayed in the upstream part of the northern branch of Moidieu corridor but not in the southern branch. The Moidieu and Heyrieux corridors do not show comparable Quaternary depositional thicknesses.
Thickness displaying the highest absolute frequency for Moidieu corridor is approximately 25 m compared to 16 m for Heyrieux corridor. The longitudinal and transversal geological sections (Fig. 8) show an irregular morphology of the top of the Miocene with slight overdeepening between 10 and 20 m in both corridors. The Quaternary erosion surface shows the existence of steeply sloping valleys, as shown by the south-eastern edge of section 2 (Fig. 8), and the flanks of these valleys show slopes more than 20°. Finally, the width of each corridor is clearly smaller when the lithology of the pre-quaternary substratum changes, and thus corresponds to the Palaeozoic and Miocene boundary (Fig. 8).
4.3 Sedimentological analysis
The sedimentary successions are divided into three sedimentary facies, each defined on the basis of their grain-size, sedimentary structures and geometries (Fig. 4).
4.3.1 F1: Micaceous sand with sigmoidal cross-strata F1 is primarily comprised of well-sorted medium sand with yellow-to-brown micaceous and mud clasts showing sigmoidal cross-stratification within one-meter thick sequences. Sandy sequences are intercalated by horizontal silty layers measuring several tens of centimetres thick, and by rare gravel levels. Mud clasts sometimes contain marine gastropod shells. This F1 facies is locally consolidated into sandstone due to diagenetic processes.
4.3.2 F2: Trough cross-bedded gravels to pebbles with small sandy lenses
F2 is composed of a polygenic gravels to pebbles with a sandy matrix. The observed thickness varies between 3 and 35 m. The clasts are slightly spherical, sub-angular to well-rounded. This facies is poorly sorted, the cross-stratification is clearly visible and there are abundant alternating clast-supported and matrix-clast-supported beds. Trough cross-bedded sequences arefining upward, sometimes grading into thin sand with current ripples. There are abundant small sandy lenses measuring several metres in length and several decimetres in thickness including current ripples.
4.3.3 F3: Massive gravels to cobbles including metric sandy lenses
F3 is mainly composed of polygenic gravels, pebbles and cobbles with a sandy matrix. The observed thickness varies between 8 and 10 m. Rare striated pebbles are only observed at the Eyzin-Pinet gravel pit. The clasts are slightly spherical and angular to well-rounded. The facies is poorly sorted and
Fig. 6. Dimensionless curves of the longitudinal profiles of the terraces and the CI values for the FgW1 and FgW2 terraces for the three studied glaciofluvial corridors. The full line connects the points taken at the site of each terrace, and each terrace is linked to the others by dotted lines. The triangles, circles and cross represent the points of the FgW1, FgW2 and FgW3 terraces, respectively. K: Downstream knickpoint position. A: Longitudinal profile for the South Moidieu branch. B: Longitudinal profile of the Central Moidieu branch. C: Longitudinal profile of the North Moidieu branch. D: Longitudinal profile of the Septeme corridor. E: Longitudinal profile of the Heyrieux corridor. F: CI values for the FgW1 and FgW2 terraces in all corridors. The location of the profiles is given inFigure 2.
Fig. 6. Profiles longitudinaux normalisés et valeurs des indices de concavité des terrasses FgW1 et FgW2 des trois couloirs fluvio-glaciaire. Les lignes pleines relient les points localisés sur une terrasses, les lignes pointillées relient les points entre les terrasses. Les triangles, les ronds et les croix représentent respectivement les points des terrasses FgW1, FgW2 et FgW3. K : Localisation des points de rupture. A : Profile longitudinal de Moidieu Sud. B : Profile longitudinal de Moidieu centre. C : Profile longitudinal de Moidieu Nord. D : Profile longitudinal de Septeme. E : Profile longitudinal de Heyrieux. F : Valeurs des IC des terrasses FgW1 et FgW2 des trois couloirs. La localisation des profiles est donné par lafigure 2.
sequences starting with erosional surfaces show diffuse horizontal planar bedding or crude massive stratification, and clast-supported beds prevail. Some rare sequences exhibit afining-upward trend in a large-scale trough shaped erosion structure with planar cross-beddingfilling. Few sandy lenses in trough-shaped erosion based are described; they are approxi-mately 10 to 5 m long and are several metres thick. These lenses show oblique tangential bedding to trough-bedding, with some current ripples sometimes showing climbing-ripple assemblages.
5 Interpretation and discussion
5.1 Sedimentary analysis
5.1.1 F1: Micaceous sand with sigmoidal cross-strata The facies is composed of sand dunes with sigmoidal cross-stratification interpreted as the result of migrating tidal dunes (Reynaud and Dalrymple, 2012). Silty horizontal beds result from ebbflow conditions and mud clasts result from the erosion of clay layers during tidal flood cycles (Allen and Homewood, 1984). Gravel beds represent drainage channels infilling. These deposits are interpreted as a signature of tidal environment. They represent the Serravalian facies (Miocene Molasse) found in the Heyrieux area (Lesueur et al., 1990). 5.1.2 F2: Trough cross-bedded gravels to pebbles with small sandy lenses
Clast-supported and matrix-supported alternations in the gravel to pebble bar deposit indicate migration bars during
high flow periods (Rust, 1972; Carling, 1990). These facies correspond to cut-and-fill deposits interpreted as a filling of erosion troughs (Maizels, 1993). Sandy lenses occur as a result of a lowerflow regime and records bar depositions in chutes minor channels (Siegenthaler and Huggenberger, 1993). Current ripples in sandy lenses result from unidirectional low current velocity. The fining-upward sequences indicate deposition through the waning stages of high flow (Miall, 1983). This facies is typical of the deposits of superposed bars from unidirectional current in a proglacial braided channel river (Boothroyd and Ashley, 1975).
5.1.3 F3: Massive gravels to cobbles including metric sandy lenses
Horizontal bedding result from the migration of gravel deposits with a high velocity current during flood periods (Brodzikowski and Van Loon, 1990). Flood events usually generate erosion of the top of the underlying sequences. The presence of clast-supported beds corresponds to the progres-sive deposition of the bedload during flood phases (Rust, 1978). Massive and poorly-sorted gravels with sequences including cobbles result from hyperconcentrated flows. The gravel to cobble deposit with trough structures and oblique planar bedding represent the migration of 3D and 2D dunes linked to unidirectional current in lowerflow regime (Maizels, 1993). The fining upward of some sequences are deposit through the waning stages of highflow (Miall, 1983). Sandy lenses are usually interpreted as channel abandonment infills under a low velocity current. Sand dunes and ripples result from low current velocity deposition (Miall, 1978). Therefore,
Fig. 7. Isopach maps of the Moidieu and Heyrieux corridors. Geodesic system used: WGS84, Projection system used: Lambert 93, Graticule units: Degrees minutes seconds.
Fig. 7. Carte isopaque des couloirs de Moidieu et Heyrieux. Système géodésique utilisé : WGS84, Système de projection utilisé : Lambert 93, Unité des graticules : Degrés minutes secondes.
Fig. 8. A: Location of the geological cross-sections (black lines) and position of the Palaeozoic and Miocene boundary (red dashed line). B: Longitudinal and transversal geological sections of the Heyrieux corridor (geological sections 1 and 2) and longitudinal section of the Moidieu corridor (geological section 3) from borehole data showing the main Quaternary lithologies and the Miocene and Palaeozoic basement. Fig. 8. A : Localisation des coupes geologiques (lignes noires) et position de la limite du substratum quaternaire et miocène. B : Coupes longitudinale et transversale du couloir d’Heyrieux (Coupe géologiques 1 et 2) et coupe longitudinal du couloir de Moidieu (Coupe géologiques 3) issues des données de forages montrant les principales lithologies du Quaternaire ainsi que le substratum miocène et paléozoïque.
F3 shows hyperconcentrated flow deposits and some rare striated pebbles, characterizing a proximal braided fluvial proglacial environment (Boothroyd and Ashley, 1975).
For F2 and F3, the polygenic nature and granulometry of the clasts, and the presence of few rare striated pebbles and sedimentary structures are characteristic of a Scott type sandur (Miall, 1978). The Scott type succession is named after the Scott outwash fan in Alaska studied byBoothroyd and Ashley (1975)and is typical of braided fluvial dominated proximal proglacial river recording aggradation and migration of gravel bars and deposition of sand lenses in abandoned channel.
5.2 Isopach map
The thickness of the glaciofluvial deposits in the studied area is similar to the glaciofluvial outwash of the Durance River beyond the Durance glacier, between 50 and 18 m thick (Gabert, 1984). The higher Quaternary thickness towards the upstream part corresponds to a proximal glaciofluvial fan. The isopach map and geological sections highlight the absence of significant pre-LGM glacial erosion. Comparatively, many alpine valleys are overdeepened such as the “Grésivaudan” Valley which has been eroded by the Würm glaciers up to 314 m below sea level (Nicoud et al., 2002). In the studied corridors, the morphology of the valley shows an abrupt beginning and termination and an irregular Quaternary erosion surface on top of the Miocene visible on the isopach map (Fig. 7) and the geological sections (Fig. 8). This typical morphology of the valley, may correspond to the tunnel valleys described under continental ice sheets (Van Der Vegt et al., 2012 and references therein) or under alpine glaciers (Moscariello et al., 1998; Dürst Stucki et al., 2010). Considering the dimensions of the three corridors, the tunnel valleys interpretation is favoured, instead of glacials over-deepenings. Tunnel valley are excavated in relatively soft sediments such as the Miocene strata and overdeepening take place rather in consolidated rocks (Magrani et al., 2020). Tunnel valleys are oriented parallel to the iceflow and have flanks with high slope values more than 20° (Cofaigh, 1996;
Dürst Stucki et al., 2010;Van Der Vegt et al., 2012). This is in
agreement with the high values measured for the slopes of the Miocene outcrops at the edges of the glaciofluvial corridors. The formation of porewater pressure-driven tunnel valleys can occur in the Miocene Molasse basement. The alternation of sand and sandstone layers with different permeabilities enables the processes involved in the formation of the tunnel valley to take place. According to the porewater pressure-driven model, ball-structures and dykes constitute the main deformations within preglacial sediment (Ravier et al., 2015). Outcrops affording observation of such deformation are uncommon, but some dykes were observed in St Pierre de Chandieu gravel pit intersecting the Miocene basement and caped by glaciofluvial sediment (Fig. 4). Tunnel valley formation is inhibited on crystalline basements (Clark and Walder, 1994;Boulton et al., 2009). This can explain the narrower width of the valleys and the disappearance of the corridors downstream, near the contact between the crystalline and the sedimentary pre-quaternary basement. These tunnel valleys were probably formed during the most extensive glacier advance in the area (Riss glaciation).
The FgR terraces are pre-LGM preserved deposits assumed to be contemporaneous from an older glaciation, probably the Riss glaciation as suggested by several authors (Chenevoy et al., 1969;Chenevoy et al., 1971;Mandier, 1984;
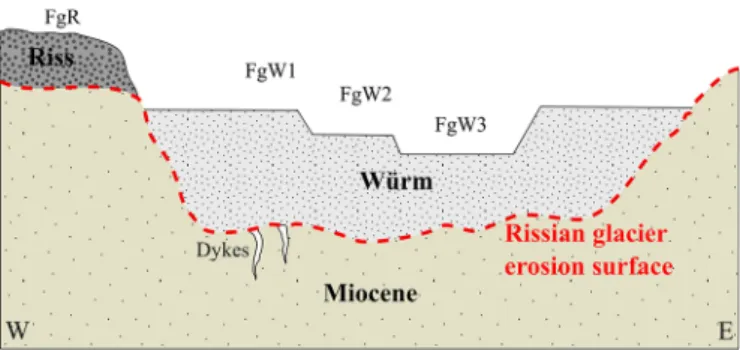
Elmi et al., 1986). In the studied area, FgR terraces constitute probably remains of kame terrace deposits built by meltwater floods during the first stage of the retreat of the Rissian glaciation. Thereafter during the Würm glaciation extent, tunnel valleys form the main proglacial corridor and arefilled above the Riss glacial erosion surface by a proglacial sediment wedge showing now the different FgW1, FgW2 and FgW3 terraces (Fig. 9).
5.3 Terrace formation
The terraces that are connected to the internal moraine complex were therefore formed during the Würm glaciation. In the studied corridors, two possible hypotheses can explain the observations and the formation of those terraces hereafter developed: a climatic hypothesis and a tectonic hypothesis. 5.3.1 Climatic hypothesis
In present-day proglacial systems, such as those in Iceland, the formation of glaciofluvial terraces occurs during glacial retreat (Marren, 2008;Marren and Toomath, 2013). Successive glacial retreats recede headwater position and river equilibri-um profile. This shift results in the erosion of the upstream part of the glaciofluvial outwash (Thompson and Jones, 1986). This model applied to the Lyonnais ice lobe retreat stage explains the formation of terraces in the upstream part of the three corridors. The difference in the number of terraces between the three corridors is explained by the frontal position of the paleo-glaciers and by topography. The moraines in the Moidieu corridor are located on a west-facing slope, thereby enabling the supply of meltwater during each glacial retreat phase, and the formation of the FgW1, FgW2 and FgW3 terraces. Moreover, narrow valleys in the upstream part of the Moidieu corridors allowed for the deep erosion of palaeo-river beds and good terrace expression.
Fig. 9. Orthogonal schematic section of one studied corridor summarising the chronological relation between the Miocene basement, the Rissian glacier erosion surface, the Rissian terraces and the Würmian proglacial deposits.
Fig. 9. Coupe orthogonale schématique d’un couloir étudié résumant les relations chronologiques entre le substratum miocène, la surface d’érosion glaciaire du Riss, les terrasses du Riss et les dépôts proglaciaires würmiens.
The location of the MW1 and MW2 moraines in the Septeme and Heyrieux corridors involves meltwater supply only during two glacial retreat phases forming the FgW1 and FgW2 terraces. Later, the glacial front is located far below within the Verpillère trough and meltwater no longer feeds the glaciofluvial corridors.
In the Heyrieux corridor, the large width of the valley does not allow for substantial erosion phases, thereby explaining the good conservation of the FgW1 terrace and thus the poor expression of the FgW2 terrace. In addition, the close proximity between MW1 and MW2 limits the shifting of the river equilibrium profile between the glacial retreat stages and inhibits the formation of terraces. The presence of two glacial retreats stages can only be justified by the different orientation of the MW1 and MW2 moraines.
Significant anthropization in the study area interferes with geomorphology of the three corridors. In addition, the position of the different moraines does not allow for good terrace formation, and it becomes difficult to identify the glacial retreat stages, as observed in the Heyrieux corridor.
5.3.2 Tectonic hypothesis
The proglacial palaeo-rivers of the three corridors evolved under similar conditions in terms of basement lithology, climate and probably sediment availability. The different CI values between the three corridors underline the different shapes of the longitudinal profiles between the Moidieu, Septeme and Heyrieux corridors. The low CI values for the Moidieu corridor could be evidence of a disequilibrium profile linked to a vertical shift of the river equilibrium profile (Strahler, 1952;Whipple, 2004). In the western French Alps, a differential uplift generating a tilting is related to glacioeustatic and erosional effects (Champagnac et al., 2007;Norton and Hampel, 2010;Nocquet et al., 2016; Sternai et al., 2019). Alternative geodynamic processes such as a mantellic upwelling (Lyon-Caen and Molnar, 1989), slab break-off (Kuhlemann, 2007) or mineralogical transformations in the lower crust (Kuhlemann et al., 2002) may also be involved in this possible tilting as deduced from the formation of the terraces in the three corridors. The modelled, Quaternary erosion-induced, alpine isostatic uplift deduced from
Champagnac et al. (2007) may have generated differential response between the three corridors as illustrated by the isolines of rock uplift drawn onFigure 5. In addition, during the LGM period, an important glacioeustatic rebound could have occurred over a short period of time (Norton and Hampel, 2010). Tilting mainly raise the upstream part of the Moidieu corridor. In this corridor, palaeo-rivers dig their beds deeper and therefore the terraces are better expressed. This cut does not happen in the downstream part of the Moidieu corridor and in other corridors where there is not as much raised. Weak tilting affecting the Septeme and Heyrieux corridors explain the weak expression of their terraces (Fig. 5).
At time, further work is needed to estimate the proportion of both climatic and tectonic forcings for the terraces formation.
6 Conclusion
This study provides new data about glacial and proglacial features during the Middle to Late Pleistocene in the Lyonnais ice lobe at the front of the Western Alps. The thickness of the
Quaternary deposits is approximately ten metres in the Heyrieux corridor and 25 m in the Moidieu corridor. The irregular shape of the longitudinal profiles of the valleys and their slight deepening in the Miocene is attributed to the genesis of the tunnel valleys prior to the last glacial maximum extent. In the three glaciofluvial corridors, sedimentary processes were related to hyperconcentrated flow and cut-and-fill deposits, resulting in the superposition of bar-shaped deposits found in braided proglacial river systems (such as Scott-type channels), which are characteristic of a proximal proglacial environment. New geomorphological analyses can be used to better define the levels of the river terraces expressed mainly upstream of the palaeosandurs. The number of terraces differs from south to north. Three terraces are present in the Moidieu corridor, and two are found in the Septeme and Heyrieux corridors. The formation of terraces and their differences in number most likely results from both climatic and tectonic forcing.
Acknowledgements. This study was possible thanks to several grants provided by the Bureau de Recherches Géologiques et Minières (BRGM) program RGF Alpes, the Institut National des Sciences de l’Univers (INSU) and the Savoie Mont-Blanc University (USMB) project DIEGO. The companies Gachet SA (Artas), Cemex Granulats Rhône Méditerranée (Oytier and St Pierre de Chandieu), Nord Isère Materiaux (Eyzin-Pinet) are sincerely thanked for giving us access to active gravel pits.
References
Allen PA, Homewood P. 1984. Evolution and mechanics of a Miocene tidal sandwave. Sedimentology 31: 63–81.
Boothroyd JC, Ashley G. 1975. Processes, bar morphology, and sedimentary structures on braided outwash fans, Northeastern gulf of Alaska. Society for Sedimentary Geology 23: 193–222. Boulton GS, Hagdorn M, Maillot M, Zatsepin S. 2009. Drainage
beneath ice sheets: groundwater-channel coupling, and the origin of esker systems from former ice sheets. Quaternary 28: 621–638. Brodzikowski K, Van Loon AJ. 1990. Glacigenic Sediments, 1st ed.
Amsterdam: Elsevier.
Buoncristiani JF, Campy M. 2004. Expansion and retreat of the Jura ice sheet (France) during the last glacial maximum. Sedimentary Geology 165: 253–264.
Buoncristiani JF, Campy M. 2011. Quaternary Glaciations in the French Alpes and Jura. Developments in Quaternary Sciences 15: 117–126.
Carling PA. 1990. Particle over-passing on depth-limited gravel bars. Sedimentology 37: 345–355.
Champagnac JD, Molnar P, Anderson RS, Sue C, Delacou B. 2007. Quaternary erosion-induced isostatic rebound in the western Alps. Geology 35: 195–198.
Chenevoy M, David L, Montjamont M. 1969. Notice explicative et Carte géol. France (1/50 000), feuille Givors (32). Orléans : BRGM, 15 p.
Chenevoy M, David L, Mongereau N, Walter B. 1971. Notice explicative et Carte géol. France (1/50 000), feuille Vienne (33). Orléans : BRGM, 16 p.
Clark PU, Walder JS. 1994. Sub-glacial drainage, eskers, and deforming beds beneath the Laurentide and Eurasian ice sheets. Geological Society of America Bulletin 106: 304–314.
Cofaigh CO. 1996. Tunnel valley genesis. Progress in Physical Geography 20: 1–19.
Coutterand S. 2010. É tude géomophologiques des flux glaciaires dans les Alpes nord-occidentales au Pléistocène récent. Du maximum de la dernière glaciation aux premières étapes de la déglaciation. Ph.D. Thesis, Université de Savoie, Chambéry, 468 p.
Coutterand S, Schoeneich P, Nicoud G. 2009. Le lobe glaciaire lyonnais au maximum würmien glacier du Rhône ou/et glaciers savoyards ? In: Neige et glace de montagne : Reconstitution, dynamique, pratiques, Collection EDYTEM– Cahiers de Géo-graphie, pp. 9–20.
David L. 1967. Formations glaciaires etfluvio-glaciaires de la région lyonnaise. Lyon : Département des Sciences de la Terre Faculté des Sciences de Lyon.
Delafond F. 1889. Note sur les terrains d’alluvionsdesenvironsdeLyon. Bulletin du service de la Carte géologique de la France 1: 1–9. Demoulin A. 1998. Testing the tectonic significance of some
parameters of longitudinal river profiles: the case of the Ardenne (Belgium, NW Europe). Geomorphology 24: 189–208.
Dürst Stucki M, Reber R, Schlunegger F. 2010. Subglacial tunnel valleys in the Alpine foreland: an example from Bern, Switzerland. Swiss Geological Society 103: 363–374.
Ehlers J, Gibbard P. 2004. Quaternary glaciations– Extent and chronology, 1st ed. Amsterdam: Elsevier.
Ehlers J, Gibbard PL, Hughes PD. 2011. Quaternary glaciations– Extent and chronology: A closer look, 1st ed. Amsterdam: Elsevier.
Elmi S, Enay R, Mangold C, Mongereau N. 1986. Notice explicative et carte géol. France (1/50 000), feuille Bourgoin-Jaillieu (723). Orléans : BRGM, 58 p.
Falsan A, Chantre E. 1879. Monographie géologique des anciens glaciers et du terrain erratique de la partie moyenne du bassin du Rhône. Paris : Masson.
Gabert J. 1984. La naissance des terrasses Würmiennes en amont de Sisteron. Bulletin de l’Association française pour l’étude du Quaternaire 21: 129–133.
Gigout M. 1960. Sur les glaciations aux environs de Lyon. Comptes rendus de l’académie des sciences Paris 250: 438–439.
Heiri O, Koinig KA, Spötl C, Barrett S, Brauer A, Drescher-Schneider R, et al. 2014. Palaeoclimate records 60–8 ka in the Austrian and Swiss Alps and Swiss Alps and their forelands. Quaternary Science Reviews 106: 1–20.
Jorda M, Rosique T, Evin J. 2000. Données nouvelles sur l’âge du dernier maximum glaciaire dans les Alpes méridionales françaises. Comptes Rendus de l’Académie des Sciences-Series IIA-Earth and Planetary Science 331: 187–193.
Kuhlemann J. 2007. Paleogeographic and paleotopographic evolution of the Swiss and Eastern Alps since the Oligocene. Global and Planetary Change 58: 224–236.
Kuhlemann J, Frisch W, Székely B, Dunkl I, Kazmer M. 2002. Post-collisional sediment budget history of the Alps: tectonic versus climatic control. International Jurnal of Earth Sciences 91: 818–837. Langbein WB. 1964. Profiles of rivers of uniform discharge. United
States Geological Survey Professional Paper 501: 119–122. Lesueur JL, Rubino JL, Giraudmaillet M. 1990. Organisation et
structures internes des dépôts tidaux du Miocène rhodanien. Bulletin de la société geologique de France 6: 49–65.
Lyon-Caen H, Molnar P. 1989. Constraints on the deep structure and dynamic processes beneath the Alps and adjacent regions from an analysis of gravity anomalies. Geophysical Journal International 99: 19–32.
Magrani F, Valla PG, Gribenski N, Serra E. 2020. Glacial overdeepenings in the Swiss Alps and foreland: Spatial distribution and morphometrics. Quaternary Science Reviews 243: 19.
Maizels J. 1993. Lithofacies variations within sandur deposits: the role of runoff regime, flow dynamics and sediment supply characteristics. Sedimentary Geology 85: 299–325.
Mandier P. 1984. Le relief de la moyenne vallée du Rhône au Tertiaire et au Quaternaire : essai de synthèse paléogéographiue. Lyon : Université Lyon II.
Mandier P. 2003. Reconstitution de l’expansion glaciaire de piemont des stades A et D des glaciers Wurmiens du Rhône et de l’Isère : implication et origine de leur disparité. Quaternaire 14: 129–133. Mandier P, Evin J, Argant R, Petiot R. 2003. Chronostratigraphie des accumulation wurmiennes dans la moyenne vallée du Rhône : l’apport des dates radiocarbone. Quaternaire 14: 113–127. Marren PM. 2008. Glacier margin fluctuations, Skaftafellsjökull,
Iceland: Implications for sandur evolution. Boreas 31: 75–81. Marren PM, Toomath SC. 2013. Fluvial adjustments in response to
glacier retreat: Skaftafellsjökull, Iceland. Boreas 42: 57–70. Miall AD. 1978. Lithofacies Types and Vertical Profile Models in
Braided River Deposits: A Summary. Fluvial Sedimentology 33: 597–604.
Miall AD. 1983. Glaciofluvial Transport and Deposition. In: Glacial Geology. Pergamon, pp. 168–183.
Moscariello A, Pugin A, Wildi W, Beck C, Chapron E, de Batist M, et al. 1998. Déglaciation wurmienne dans des conditions lacustres à la terminaison occidentale du bassin lémanique (Suisse occidentale et France). Eclogae Geologicae Helvetiae 91: 185–201.
Nicoud G, Royer G, Corbin JC, Lemeille F, Paillet A. 2002. Creusement et remplissage de la vallée de l’Isère au Quaternaire récent. Géologie de la France 4: 39–49.
Nocquet JM, Sue C, Walpersdorf A, Tran DT, Lenôtre N, Vernat P, et al. 2016. Present-day uplift of the western Alps. Scientific Reports 6: 1–6.
Norton KP, Hampel A. 2010. Postglacial rebound promotes glacial re-advances– A case study from the European Alps. Terra Nova 22: 297–302.
Penck A, Brückner E. 1909. Die Alpen im Eiszeitalter, 3 vol. Leipzig: Tauchnitz.
Ravier E, Buoncristiani JF, Menzies J, Guiraud M, Clerc S, Portier E. 2015. Does porewater or meltwater control tunnel valley genesis? Case studies from the Hirnantian of Morocco. Palaeogeography, Palaeoclimatology, Palaeoecology 418: 359–376.
Reynaud JY, Dalrymple RW. 2012. Shallow-marine tidal deposits. In: Principles of Tidal Sedimentology. Dordrecht: Springer, pp. 335–369.
Rust BR. 1972. Structure and process in a braided river. Sedimentology 18: 221–245.
Rust BR. 1978. A classification of alluvial channel systems. Fluvial Sedimentology 5: 187–198.
Schoeneich P. 1998. Corrélation du dernier maximum glaciaire et de la déglaciation alpine avec l’enregistrement isotopique du Groen-land. Quaternaire 9: 203–215.
Siegenthaler C, Huggenberger P. 1993. Pleistocene Rhine gravel: deposits of a braided river system with dominant pool preservation. Geological Society 75: 147–162.
Sissingh W. 2001. Tectonostratigraphy of the west Alpine foreland: corelation of tertiary sedimentary sequences, changes in eustatic sea-level and stress regimes. Tectonophysics 333: 361–400. Sternai P, Sue C, Husson L, Serpelloni E, Becker T, Willett S. 2019.
Present-day uplift of the European Alps: Evaluating mechanisms and models oftheir relative contributions. Earth-Science Reviews 190: 589–604.
Strahler AN. 1952. Hypsometric (area-altitude) analysis of erosional topography. Geological Society of America 63: 1117–1142.
Thompson A, Jones A. 1986. Rates and causes of proglacial river terrace formation in southeast Iceland: an application of lichenometric dating techniques. Boreas 15: 231–246.
Van Der Vegt P, Janszen A, Moscariello A. 2012. Tunnel valleys: current knowledge and future perspectives. Geological Society 368: 75–97.
Vilain R, Evin J, Drevon G, Marechal J. 1988. Nouvelles observations géologiques et datations absolues dans le complexe morainique
wurmien de Balan (Ain, France). Bulletin des Naturalistes et Archéologues de l’Ain 8: 457–468.
Whipple KX. 2004. Bedrock rivers and the geomorphology of active orogens. Annual Reviews in Earth ans Planetary Sciences 32: 151–185.
Wirsig C, Zasadni J, Christl M, Akçar N, Ivy-Ochs S. 2016. Dating the onset of LGM ice surface lowering in the High Alps. Quaternary Science Reviews 143: 37–50.
Cite this article as: Roattino T, Crouzet C, Buoncristiani J-F, Tissoux H. 2021. Geometry of glaciofluvial deposits and dynamics of the Lyonnais lobe ice front during the last glacial period (France, Northern Alps), BSGF - Earth Sciences Bulletin 192: 21.


![[PDF] Cours C++ Saisie de nombres et de caractères au clavier | Cours informatique](data:image/gif;base64,R0lGODlhAQABAIAAAP///wAAACH5BAEAAAAALAAAAAABAAEAAAICRAEAOw==)