in New York City
by
Nicolas S. Rothbacher
B.S. Physics and Mathematics,
University of Puget Sound (2018)
Submitted to the Institute for Data, Systems, and Society
and
Department of Electrical Engineering and Computer Science
in partial fulfillment of the requirements for the degrees of
Master of Science in Technology and Policy
and
Master of Science in Electrical Engineering and Computer Science
at the
MASSACHUSETTS INSTITUTE OF TECHNOLOGY
September 2020
© Massachusetts Institute of Technology 2020. All rights reserved.
Author
Technology and Policy Program
Department of Electrical Engineering and Computer Science
August 27, 2020
Certified by
Daniel J. Weitzner
3Com Founders Principal Research Scientist, Computer Science and Artificial
Intelligence Lab
Founding Director, Internet Policy Research Initiative
Thesis Supervisor
Certified by
Randall Davis
Professor of Computer Science and Electrical Engineering
Thesis Supervisor
Accepted by
Noelle Eckley Selin
Associate Professor, Institute for Data, Systems and Society and Department of Earth,
Atmospheric and Planetary Sciences
Director, Technology and Policy Program
Accepted by
Leslie A. Kolodziejski
Professor of Electrical Engineering and Computer Science
Chair, Department Committee on Graduate Students
by
Nicolas S. Rothbacher
Submitted to the Institute for Data, Systems, and Society and
Department of Electrical Engineering and Computer Science
on August 27, 2020, in partial fulfillment of the requirements for the degrees of Master of Science in Technology and Policy
and
Master of Science in Electrical Engineering and Computer Science
Abstract
Predictive policing has quickly become widespread in the United States. Practitioners claim it can greatly increase police efficiency and base decisions on objective statistics. Critics say that these algorithms reproduce discriminatory outcomes in a biased justice system.
In this thesis, I investigate fare enforcement in New York City and what might happen if pre-dictive policing were applied. First I analyze legal precedents on discrimination law to create a framework for understanding whether policy is legally discriminatory. In this framework the fairness of a government policy is judged based on how different groups are treated by the process of carrying out the policy. Three elements must be examined: a comparison group that is treated fairly, discriminatory burden for the disadvantaged group, and government neg-ligence or intent. Next, using this framework, I perform data analysis on fare evasion arrests in New York City, and find evidence of discrimination. Finally, I examine predictive policing to determine what its effect on fare enforcement might be. I conclude that predictive policing algorithms trained on the arrests will be ineffective and seen as unfair due to the institutional practices that impact the data. This examination sheds light on how machine learning fairness could be analyzed using societal expectations of fairness.
Thesis Supervisor: Daniel J. Weitzner
Title: 3Com Founders Principal Research Scientist, Computer Science and Artificial Intelli-gence Lab
Founding Director, Internet Policy Research Initiative Thesis Supervisor: Randall Davis
Title: Professor of Computer Science and Electrical Engineering
I am grateful to both of my advisors, without whose guidance and support this thesis could not have happened. Daniel Weitzner, whose advice, feedback and input were instrumental to formulating my thoughts and work from the beginning of this project to the end. And Randall Davis, whose astute questions, detailed feedback and steadfast commitment kept me grounded and bettered almost every aspect of this document.
My loving partner, Larissa (Lou) Lief, also deserves my eternal gratitude. She has supported me every step of the way and without her advice, editing and support in so many late night thesis sessions, this thesis would almost certainly not exist.
I am also thankful to the Internet Policy Research Institute and all the folks there for the intellectual, technical and financial support they have given me. In particular, thank you to Melanie Robinson for being a constant help in making this thesis team work and to Leilani Gilpin, Cecilia Testart Pacheco and Julius Adebayo for being willing to sit down with me and discuss ideas and answer questions in my research struggles. I am also incredibly grateful to Grace Abuhamad and Nathaniel Fruchter, without whom I would not have found IPRI and begun the work that became this thesis.
I have also been very lucky to be part of a thriving and supportive TPP community and everyone there has contributed to making these past two years what they were. I’m especially thankful for the lounge as the perfect work space and all the spirited lounge chats, day and night. I was truly lucky to call such a fun, thoughtful and compassionate group my community,
Last but certainly not least, I have to thank all my friends and family that have shaped my journey. Thankful especially to my parents, whose commitment to my education and to encouraging me to follow my passions is the root of what made this all possible.
List of Figures 9
List of Tables 11
1 Introduction 13
2 Fare Evasion in New York: Policy Conversation 15
3 Fairness in Policing: Legal Tests 19
4 Analysis of Arrest Data 27
4.1 Data Overview and Cleaning . . . 28
4.2 Overview of Arrest Statistics . . . 34
4.3 Patterns of geographic discrimination . . . 39
4.4 Unequal policing within stops - evidence of explicit profiling . . . 47
4.5 Conclusion . . . 53
5 Predictive Policing: Methods, Fairness and Context 55
6 Applying Predictive Policing to Fare Evasion 65
7 Conclusion 75
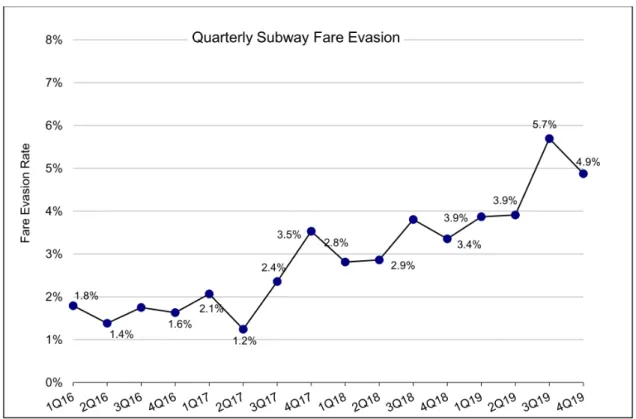
2-1 Rising estimates of fare evasion on the New York City Subway have led to calls
for a crackdown.(see Albert et al., 2020, page 169) . . . 16
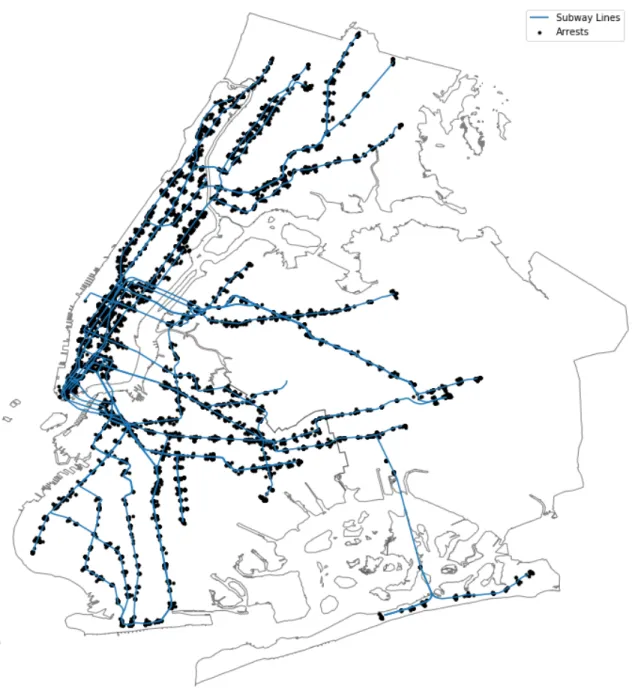
4-1 all arrests for NYPL 165.15(3). . . 31
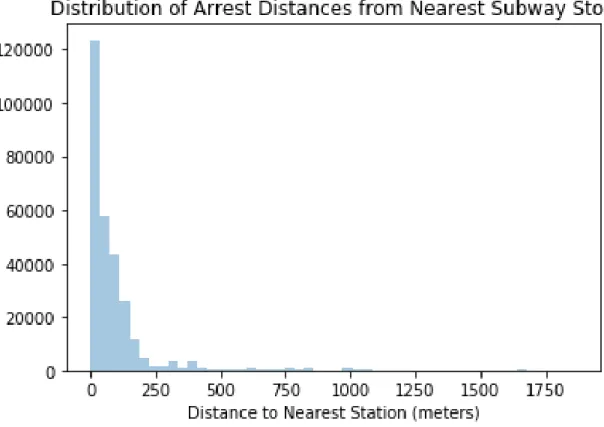
4-2 histogram of distance to closest station for NYPL 165.15(3) arrests. . . 32
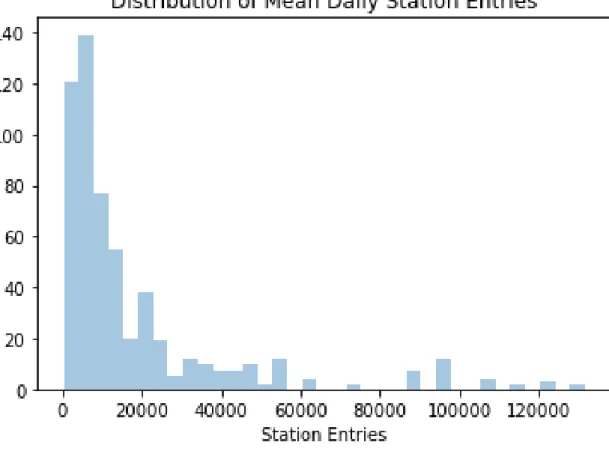
4-3 Station histogram of mean daily entries. . . 33
4-4 Yearly arrests. . . 34
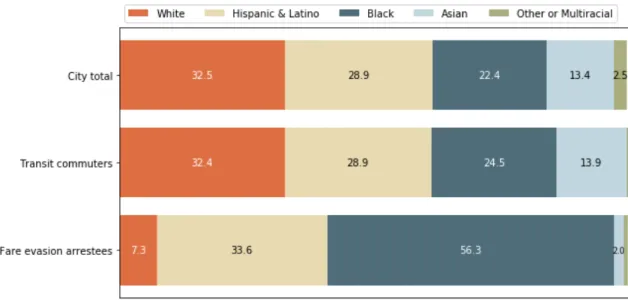
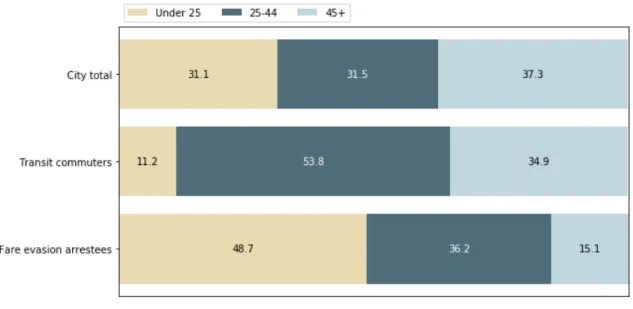
4-5 Race statistics of fare evasion arrests compared to city and transit commuter population. . . 36
4-6 Sex statistics of fare evasion arrests compared to city and transit commuter population. . . 36
4-7 Age statistics of fare evasion arrests compared to city and transit commuter population. . . 37
4-8 Arrest location by borough and population/transit commuter distribution. . . . 37
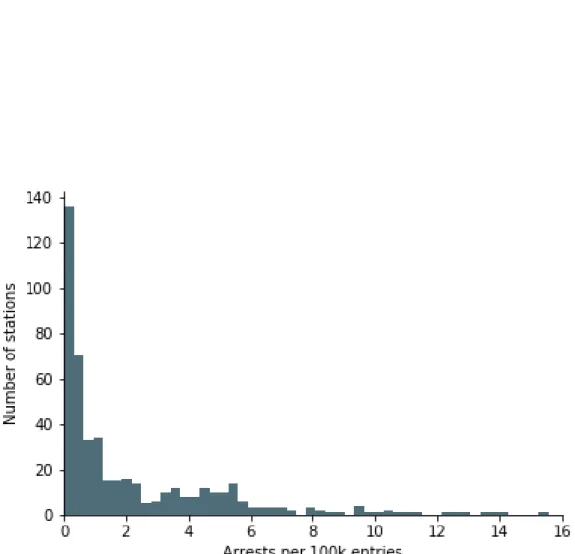
4-9 Station histogram of total arrests per 100K entries. . . 38
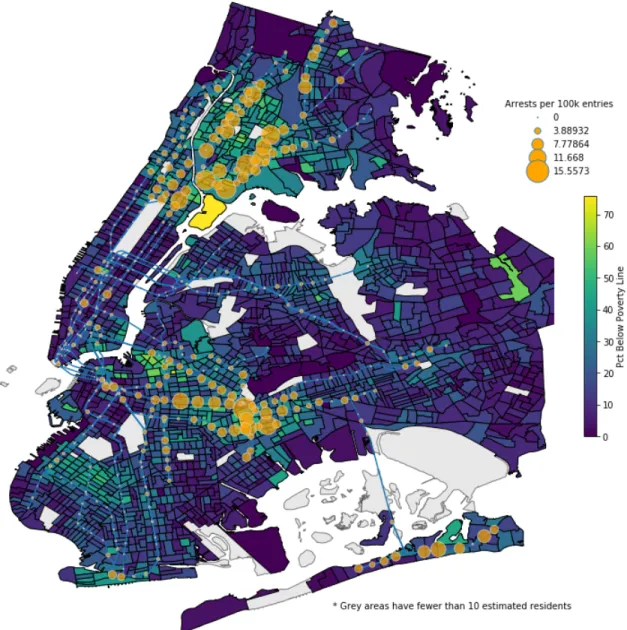
4-10 Stations colored and scaled by arrests (left) and arrests per 100k entries (right). 39 4-11 Map of stations scaled by arrest rate and census tracts colored by poverty rate. . 41
4-12 Map of stations scaled by arrest rate and census tracts colored by percent of tract who are Black. . . 42
4-13 Map of stations scaled by arrest rate and census tracts colored by percent of tract who are Hispanic or Latino. . . 43
4-14 Map of stations scaled by arrest rate and census tracts colored by percent of tract who are Black or Hispanic/Latino and poor. . . 44
4-15 Proportion White of arrests vs. surrounding area at each station, red line represents demographic parity. . . 49 4-16 Proportion Asian of arrests vs. surrounding area at each station, red line
repre-sents demographic parity. . . 50 4-17 Proportion Black of arrests vs. surrounding area at each station, red line
repre-sents demographic parity. . . 51 4-18 Proportion Hispanic/Latin of arrests vs. surrounding area at each station, red
line represents demographic parity. . . 52 6-1 Histogram of times (less than 50 days) between burglary events separated by
200 meters or less (G. O. Mohler et al., 2011) . . . 67 6-2 Histogram of times (less than 50 days) between fare evasion arrests at the same
station starting on 100 random days in 2015. . . 68 6-3 2010 fare evasion statistics (Reddy et al., 2011). Left: evasions and station
busyness. Right: evasions and station poverty.. . . 70 6-4 Fare evasion arrests per 100k passengers. . . 71
4.1 Regression results for arrest rate correlated with ACS demographic data. * indi-cates statistically significant correlations. The first column reports the estimated regression coefficient and the following report statistics about the distribution of that estimate. . . 46
Introduction
Machine learning fairness has become one of the most intensively researched aspects of applied machine learning in recent years. It’s problem statement is eminently appropriate: in a world filled with biased systems, how can we ensure that our models do not incorporate false inferences based on societal prejudices? Machine learning fairness literature has tended to approach this issue with a particular spin: use statistical techniques to make learned models adhere to one statistical definition of fairness or another. Unfortunately, this goal does not address some fundamental aspects of ensuring fairness: what are the societal expectations for fairness? What effect do the institutions that carry out the model’s recommendations have on the outcome? And how does the specific policy context of the problem space impact fairness considerations? In this thesis, I will attempt to address some of these questions with regard to a particular policy situation and hypothetical machine learning tool: the use of predictive policing in the case of New York City Subway fare enforcement.
Fare evasion, the act of using public transit without paying, has become an area of national debate in recent years. City transit authorities say that there is rising loss of revenue from the crime while advocates for racial minorities across the country have claimed that the enforcement of fare evasion disproportionately affects minorities and is racially biased. This has lead to a number of policy responses, from downgrading evasion to a civil offense to hiring more officers and cracking down. In New York City, the conversation around fare evasion has grown into a crescendo with the Mayor and Governor defending their crackdown on evaders
against lawmakers and activists who condemn the move as damaging to minorities. In the midst of this, a lawsuit was filed against the NYPD in which one former transit officer said he was “tired of hunting Black and Hispanic people” after being ordered to ignore White and Asian fare evaders and instead focus his efforts and Blacks and Hispanics (Goldstein & Southall, 2019). It is in this context that I investigate in this thesis. In particular, I examine claims of biased police practice using a data set of fare evasion arrests. In order to do so, I analyze legal precedent on police discrimination to determine how our society has come to understand what qualifies as racist policy and apply that understanding to how I examine the data. Once finished with that task, I move on to predictive policing, the use of statistical methods to predict what places and times are most likely to experience a particular crime, in order to understand its hypothetical effects in this case. One might hope that using statistical effects will increase the accuracy of resource deployment for fare enforcement and decrease human bias by grounding decisions in mathematical rigor. I examine the problems of predictive policing methods and what solutions have been put forward in order to address these hopes. In this analysis, I will focus more holistically on the entire system that the machine learning algorithm is placed in. This recognizes that the algorithm will be paired with that system, helping it to carry out its work. If the general system is unfair, then the algorithm too will be considered a part of it or worse an exacerbating force even if it meets some isolated notion of fairness. In doing so, I bring together a number of disciplines, methods and analyses to develop a notion of machine learning fairness field that more critically examines the problem of discrimination.
Fare Evasion in New York: Policy
Conversation
$300 million per year, 4% of all fare revenue, that’s how much the New York State Metropolitan Transit Authority (MTA) claims they lose every year to fare evaders (Metropolitan Transit Authority, 2019). This estimate has increased since 2017 (see Albert et al., 2020, page 169) leading many New York leaders to call for changes to policy in order to address it. In August of 2019, New York Governor Andrew Cuomo and New York City Mayor Bill DeBlasio announced a combined effort to combat fare evasion with the hiring of 500 new police officers and 70 new non-police fare inspectors (Rubinstein, 2019). This rise in reported fare evasion and the subsequent response have prompted a vigorous discussion, especially when there are allegations of racial bias in fare enforcement practices and questions about the veracity of the MTA’s data. The debate about how to handle fare evasion is not unique to New York City and it is not new there, but the choice to hire these 500 new officers has created a more urgent conversation around the issue.
On the opposing side to this debate are those who say that the New York Police Department’s (NYPD) Transit Bureau and MTA Police Department’s (MTAPD) enforcement of fare evasion, especially the use of arrests, is discriminatory. According to NYPD data, between October 2017 and June 2019, 70% of tickets and 90% of arrests for subway fare evasion were of Black and Hispanic New Yorkers (NYPD, 2020) despite them being only about 60% of New Yorkers and
Figure 2-1: Rising estimates of fare evasion on the New York City Subway have led to calls for a crackdown.(see Albert et al., 2020, page 169)
transit commuters (Census Bureau, 2015). This has led many community groups to accuse the NYPD of racial bias. The Community Service Society, an anti-poverty think tank, put out a report in 2017 analysing arrests in Brooklyn in 2016. The report found that not only were Black New Yorkers far more likely to be arrested than Whites for fare evasion but also that heavily policed subway stations (that is those with high rates of arrest per rider) were concentrated in high poverty, Black neighborhoods B. H. Stolper and Jones, 2017. In an updated analysis from 2020, they used city-wide data to show that similar patterns occurred across New York City: heavily policed stations were concentrated in poor, Black and Latino communities (H. Stolper, 2020). In addition to this statistical data, at least one lawsuit has been filed accusing the NYPD of explicit profiling, former transit officers accuse one commander of ordering them to “write more Black and Hispanic people” because they were “stopping too many Russian
and Chinese” (Goldstein & Southall, 2019). Following this troubling claim, the New York Attorney General has announced plans to investigate the NYPD to see if they have a pattern of targeting racial minorities in enforcement of fare evasion (“Attorney General James Launches Investigation Into NYPD For Alleged Targeting Of Communities Of Color On NYC Subways”, 2020). After the hiring of the new officers, several controversial videos of police actions on the subway (@SofiaBNewman, 2019) prompted protests (ABC7 Eyewitness News, 2019b) and condemnation from city leaders (ABC7 Eyewitness News, 2019a). Following the protests, several New York legislators wrote a letter to Governor Cuomo urging him to reconsider the transit officer hirings. They argued adding police officers to the transit system will have a discriminatory burden on poor New Yorkers of color (Ocasio-Cortez et al., 2019).
In addition to the concerns about racial discrimination, there has long been debate about the correct approach to enforcement of fare evasion. In 2017, Manhattan District Attorney Cy Vance began a policy of no longer prosecute criminal fare evasion in court with the explicit goal of reducing the offense’s impact on the criminal justice system (Vance, 2017). While this would mean that fare evasion as a crime would no longer be tried, civil courts that handle fines or other civil penalties would continue to hear fare evasion cases. Following the hiring of the new transit police, many have argued that this investment is similarly a bad use of resources, arguing that subway crime is at historic lows (New York Times Editorial Board, 2019) or that the police officers are a bad investment in preventing fare evasion (Colon, 2019). Others argue that while crime is down in official NYPD numbers, that this is an undercount (Mccarthy et al., 2019) or that they do not account for rising assaults against workers (Utano, 2019). Pro-enforcement writers also argue that the only solution to fare evaders is to crack down and that DA Vance’s policy has led to the rise in fare evasion (New York Post Editorial Board, 2019) (Utano, 2019). In the midst of this, the Inspector General of the MTA has called into question the data showing rising fare evasion, accusing the survey of underestimating error and highlighting the survey designers’ warnings against the use of the data for decision making (Keating, 2019). Finally, early results from the crackdown have not been conclusive. While MTA evasion rate estimates increased in 3rd Quarter 2019 immediately following the hiring of the officers they fell again in the Fourth Quarter, though they still remained above the level of the same estimate in early 2019 (see Albert et al., 2020, page 169).
New York is not alone in wrestling with this issue. Cities across the nation have had similar patterns in enforcement of fare evasion. In Portland, Oregon, Black evaders were more likely
to be banned from their transit system than White evaders (Njus, 2016). In Minneapolis, Minnesota, Black and Indigenous riders were much more likely to be ticketed or arrested for fare evasion (Moore, 2015) and in Los Angeles, California, the sheriff ’s department was subject to federal investigation for disproportionate policing of fare evasion against Black Angelenos (Carino, 2017). In Washington D.C., where fare evasion is estimated to be happening at higher rates than in New York City (Zickhur, 2020), the city council decriminalized the offense, making the penalty a $50 civil fine (Siddiqui, 2018). In making that decision, the city council cited the fact that Black Washingtonians made up 91% of those ticketed or arrested for fare evasion and a lack of convincing evidence that fare evasion arrests prevent other crimes. The council passed the measure despite strong opposition from the region’s Metro Transit Authority which claimed that fare evasion was having a significant negative impact on revenues. The experiences of other cities puts the conversation in New York City into a broader context, a nationwide discussion around racial discrimination, the logic of fare enforcement and the fairness of cracking down or letting up on fare evaders.
This thesis focuses on two areas of this debate: (i) it examines the question of whether fare enforcement is discriminatory in New York using new data, and (ii) then examines the impact of a new technology, predictive policing, on the fare enforcement issue. The first focus will attempt to answer the question: with what data we have available to us, what evidence of discriminatory practice do we see? Using that data I show that, while conscious discrimination is impossible to prove here, there is reason to be concerned that the current practice of fare enforcement puts a discriminatory burden on Black and Latino New Yorkers.
Given that context, the thesis will then focus on common techniques in predictive policing. A major driver of the use of this technology is its claims that it can increase efficiency and decrease crime. I will show that in this instance, the technology will inaccurately predict and will exacerbate the issues of discriminatory fare enforcement, creating issues that technologies to create “fair” predictive policing algorithms cannot feasibly resolve.
Fairness in Policing: Legal Tests
One way to think about how American society decides whether a practice is fair is through the courts. Non-discrimination law, enshrined as a right in the 14th Amendment and fleshed out through court cases and legislative mechanisms, is a wide-ranging area of the law. Here I focus specifically on law relevant to policing policy. In examining the way that the courts and law have treated discrimination claims in this area, I construct a framework for understanding what criteria and information are necessary to show that a police practice is unfair to a particular group. More specifically, I analyze what the courts have found convincing when presented with statistical bases for discrimination claims in order to better understand the data and statistics therein that are available for understanding fare enforcement.
In 2013, a federal judge in the Southern District of New York ruled that New York City had violated the Fourth and Fourteenth Amendments in its application of a policy of discretionary Stop and Frisk from 2004 to 2012 (Floyd v. City of New York, 2013). Stop and frisks, or Terry stops as they are known in the legal world, are stops made by police officers based on some suspicion of illegal activity they observe on the street. In the case laying out their legality, Terry v. Ohio, an officer observed some men “casing” a store for a robbery and upon stopping and searching them (a stop and frisk) discovered they had guns (Brantingham, 2018) (Terry v. Ohio, 2013). The Supreme Court of the United States ruled that this practice was constitutional despite being a warrantless search and In later decisions, the ability to search was expanded to include any suspected illegal objects on the persons stopped.
From 2004 to 2012, the New York City Police Department adopted an explicit policy of patrolling and using these Terry stops to drive down crime and seize weapons and other contraband. The mayor at the time, Micheal Bloomberg, motivated the policy and defended its discriminatory impact following the 2013 decision saying that, “the proportion of stops generally reflects our crime numbers does not mean, as the judge wrongly concluded, that the police are engaged in racial profiling; it means they are stopping people in those communities who fit descriptions of suspects or are engaged in suspicious activity.” (“Micheal Bloomberg: Stop-and-Frisk Keeps New York Safe”, 2013). Though he later claimed after he was mayor that “95 percent of your murders and murderers and murder victims fit one M.O. You can just take the description, Xerox it and pass it out to all the cops. They are male minorities, 15 to 25....and the way you get the guns out of the kids’ hands is to throw them against the wall and frisk them.” (Allyn, 2020).
A directive like the one that Bloomberg espoused in his later justifications would, in fact, fail the test for unlawful racial profiling, and the justification that crime rates differ is insufficient if an overt racial test is applied, as we will see. Judge Shira Scheindlin in the Floyd case found that the police had acted in a systematically discriminatory manner while executing that policy based on statistical, institutional and personal evidence judged against several legal tests. These tests provide a bar for which general violations of the constitution must clear, a menu of criteria for claims against the Fourteenth Amendment and specific criteria for evidence in support of those claims. It is these tests, and specifically the ones relating to statistical evidence, that we will consider to understand how the legal system has decided cases of systematically discriminatory police behavior.
Protection against discrimination is guaranteed by the 14th Amendment to the United States Constitution. Its first section reads
All persons born or naturalized in the United States, and subject to the jurisdiction thereof, are citizens of the United States and of the State wherein they reside. No State shall make or enforce any law which shall abridge the privileges or immunities of citizens of the United States; nor shall any State deprive any person of life, liberty, or property, without due process of law; nor deny to any person within its jurisdiction the equal protection of the laws (US Constitution, Amendment XIV, Sec. 1).
The italic text is called the equal protections clause, which is the specific language that guarantees that citizens the right to not be treated differently under the law. Importantly, this clause does not deal with government action that merely has disproportionate impact on members of a racial group, it protects only against intentional discrimination.
At the federal level disparate impact claims without evidence of discriminatory intent are permitted under Title VII of the Civil Rights Act of 1964 (Miller, 1998, page 177-178). New York City allows civil complaints against the NYPD for biased policing in cases where profiling can be shown. Profiling may be shown either through overt discrimination or “policies and practices” that result in biased policing. In the case of policy, if the city is able to argue it serves a neutral and legitimate policing purpose that can’t be served by a less biased method, that policy is not considered to be discriminatory (NYC Administrative Code § 14-151(C)). But how do we define what counts as a policy and how can plaintiffs show these types of claims? The question of what types of policies can be challenged on these grounds is answered by the Supreme Court case Monell v. Department of Social Services of the City of New York. This case gives citizens the ability to file claims against “actions pursuant to official municipal policy” that violate their constitutional rights. Official policy encompasses lawmaking decisions, acts of policymakers or “practices so persistent and widespread as to practically have the force of law.” (Monell v. Department of Soc. Svcs., 1978) It is this last point that is relevant to police practice or statistical analysis of discrimination. If plaintiffs can show that a practice was widespread and that there was “deliberate indifference” to addressing discriminatory impact of that practice, then that practice can be considered explicit government policy whether it is put into words or not.
With regard to the Fourteenth Amendment claims, discrimination can be tested against its Equal Protection Clause which, again bars only intentional discrimination. But the test for what is an intentionally discriminatory policy is nuanced. There are three ways a plaintiff might plead intentional discrimination according to the Second Circuit: pointing to a law or policy that explicitly considers race, identifying a facially neutral law applied in an intentionally discriminatory way, or that a facially neutral policy has an adverse effect that was motivated by discriminatory animus. Importantly though, a plaintiff need not show that this discriminatory intent or animus was the primary factor in making the policy, only that it was one of the factors considered. Finally, the Supreme Court has recognized that discriminatory intent is often difficult to find direct evidence of so they allow that simply a “discriminatory impact”
could serve as the starting point for a case. Under these circumstances the burden would shift to the government to show that the impact would have occurred even without consideration of race. Finally, if the judge is unconvinced of this explanation the policy will be ruled unconstitutional under the Equal Protection clause.
In Floyd v. City of New York, the important fact finding is whether a policy, explicit or implicit, had a discriminatory impact motivated by discriminatory intent. But how does the court make this determination? The judge in Floyd relied primarily on statistical evidence to find that discriminatory policy was present and then found institutional evidence of discriminatory intent through deliberate negligence and explicit rhetoric at the managerial level. I will focus on the statistical proof provided since it will be most relevant to considering how fairness concerns will be addressed and discovered using statistical evidence.
The primary question in Floyd the court seeks to answer using statistical evidence was whether Black and Hispanic people were stopped more frequently than they would have been if officers had not been racially motivated in deciding who to stop. In order to make this comparison, the court relied on a statistical benchmark for what the unbiased rate would have been proposed by an expert witness for the plaintiffs. The benchmark was in concept an estimate of the supply of individuals of each racial group who are engaged in targeted behaviors and who are available to the police as potential targets for stopping. In practice, she relied on the population and demographics of neighborhoods patrolled conditioned on the reported crime rate in the area, to produce a rough estimate of the number of possible suspects in an area. She explicitly rejected a benchmark consisting of the demographics of crime perpetrators in reports as this benchmark would presuppose that those stopped are criminals, a fact in contest in the case. This test resulted in several findings important to the court:
1. The NYPD carried out more stops in places with more Black and Hispanic people, 2. Within any given area the NYPD was more likely to stop Black and Hispanic people
regardless of the demographics in that place,
3. Black people were 30% more likely to be arrested (rather than ticketed) than White people when stopped under suspicion of the same crime,
4. Blacks and Hispanics were more likely to be subjected to force when stopped,
5. And, the odds of a stop incurring further law enforcement action (the chances that the person stopped was ticketed, arrested, or prosecuted for the suspected crime) were lower
for Black people stopped than for White people stopped implying that Black people were more likely to be stopped or searched frivolously.
The judge in the case ruled that this statistical evidence showed that the NYPD was applying the policy of Stop and Frisk in a manner that was not motivated by policing of high crime areas and suspicious people but based on racial categories. This discrimination was in some ways to the direct detriment of their ability to achieve the goal they had articulated: to stop people who might have committed or might in the future commit a crime. This indicated that there was racial profiling at play in Stop and Frisk.
In the concluding paragraphs of the decision, the judge refutes several claims that she sees as inadequate to defend against accusations of discrimination. Interesting enough to bear repeating here. First, from a constitutional standpoint, racial profiling cannot be justified by factual differences in crime rates among racial groups. Second, the use of crime data gathered by police is, in and of itself, a fallible way to identify the criminal population and can not be relied on for targeting purposes as a defense against discrimination claims. And finally, the presence of reasonable suspicion of a crime is insufficient to provide a defense against the racially motivated nature of an enforcement action. The judge gives as an example the decision to enforce speeding only against Hispanics expressly and let others go, saying that “there is no dispute that [that policy] would violate equal protection.” While it would certainly be appropriate to target resources toward those suspected of crimes, intentionally doing so against a class of people in general is unconstitutional. The judge concludes this section by stating that “individuals may not be punished or rewarded based on the government’s views regarding their racial group, regardless of the source of those views”, an important principle for detecting and preventing discriminatory actions by the government. The judge also provides motivation for this principle, stating that the “targeting of certain races within the universe of suspicious individuals...will increase the likelihood of further enforcement actions against members of those races as compared to other races, which will then increase their representation in crime statistics. Given the NYPD’s policy of basing stops on crime data, these races may then be subjected to even more stops and enforcement, resulting in a self-perpetuating cycle.”
Another frame of reference for discrimination claims is the disparate impact arguments made possible by the Civil Rights Act of 1964 and the New York City anti-profiling law. Since the New York law provides specific tests to apply and is more specific to police profiling in New
York City, we can limit ourselves to consider the criteria laid out there. Despite its similarities to the Civil Rights Act of 1964. The city law defines and bans “bias-based profiling” which it defines as “an act of a member of the force of the police department or other law enforcement officer that relies on actual or perceived race, national origin, color, creed, age, lineage or citizenship status, gender, sexual orientation, disability, or housing status as the determinate factor in initiating law enforcement action against an individual, rather than an individual’s behavior or other information or circumstances that links a person or persons to suspected unlawful activity.” (NYC Administrative Code § 14-151(C)) The law provides plaintiffs with two ways to prevent this profiling: 1) they can prove that there is explicit profiling that is not justified by compelling government interest and narrowly tailored or 2) they can show that a policy had disparate impact on their class of people and go through a burden shifting process (NYC Administrative Code § 14-151(C)). This burden shifting process is the most different from claims under the Constitution and it refers to a series of steps where the two parties must attempt to argue for their side. First, the plaintiff must show there is disparate impact to begin the claim. Then for the policy to be have a chance of being upheld, the government must show that the policy is important to advancing a law enforcement goal or else the policy is unlawful. If the government does so, the plaintiff must then provide alternative policies which do not cause as disparate of an impact or the policy is determined to be lawful. Finally, the government must show that these alternatives do not achieve the law enforcement objective or the policy is ruled to be discriminatory. In this way, the legal system tests policies that have unlawful discriminatory burden but do not rise to the level of intentional discrimination. This law is one other way we can understand what is required of parties to justify discrimination claims and defenses.
Having examined these two theories of how to test for discrimination, we can construct a framework to think about proving discrimination in the legal system using data. To the le-gal system, one principle seems above all: process. To be more explicit, discrimination law is concerned with whether individuals are treated fairly (i.e. given equal consideration and treatment given their position when encountering the government policy) during the process of the government carrying out a policy. In judging said process, there are several necessary el-ements to consider in order to determine if discrimination is happening. First, the comparison to a benchmark, nondiscriminatory case in which the policy is behaving fairly. For example, for a law or punishment applied unevenly, plaintiffs could show that another, similarly situated group of people that differ in a discriminatory way are not subject to that law or punishment
such as defendants of a different race. Second, there must be a discriminatory burden shown, meaning that one group is being treated different from another. Importantly, this burden must not be the only way to effectively carry out a legitimate, non-discriminatory government interest but it is on the government to prove that a nondiscriminatory alternative is unaccept-able. Finally, there must be some level of wrongdoing on the part of the government involving knowledge of the discriminatory impact. This means there must be institutional evidence of “deliberate indifference” and/or intent in constitutional claims or a suitable alternative policy for statutory disparate impact claims. For this bar, data is an inexact and insufficient level of evidence since it cannot show the disparities were not accidental. Conversely, it is insufficient for the government to explain away policy known to be discriminatory using data that “proves” it was justified (like the representation of certain classes in crime reports), they must show that the policy was not intentionally discriminatory and necessary to carry out government business. This three part test of benchmark, burden and knowledge is the primary concept with which I will analyze discrimination going forward.
With these tests, the subtext of the Floyd decision becomes clear: the court applied benchmark and burden to reach the conclusion that there was evidence of discrimination and examined the government’s words, actions, and arguments to decide that the government had not shown the policy to be non-discriminatory. First, the court looked at the statistics of stops when compared to the demographics in the areas patrolled conditional on how much crime is reported there (see Floyd v. City of New York, 2013, page 50-51). They found that Black and Hispanic areas and people were disproportionately patrolled and stopped in comparison to the baseline see Floyd v. City of New York, 2013, page 59. They then looked at another baseline, how those stopped by the police were treated and found that Black and Hispanic people were more harshly treated and less likely to have their stops proceed to prosecution or other action to see whether Black people were stopped with a lower level of suspicion see Floyd v. City of New York, 2013, page 59-60. Taken together, these two baseline comparisons show that not only is there evidence of the disparate impact of the stops on Black and Hispanic communities, there was also over profiling that was the result of Black suspects being subject to a "lower level of objective suspicion" (see Floyd v. City of New York, 2013, page 63). The court then used records, testimony and statements to determine if the city had knowledge of these racially discriminatory practices. The court found that in several ways the NYPD and "the City has been deliberately indifferent to violations of the...Fourth and Fourteenth Amendment..." (see Floyd v. City of New York, 2013, page 60). This case is just one example of how the framework
can be applied to test for discrimination but can serve to motivate what we can do with data alone.
So what can we hope to discover from data and what will we fail to do? First, its important to acknowledge that examining institutional and testimonial evidence is outside the scope of this work as we do not at this time have access to (or the resources and time to pursue) such evidence. That means that while we can find evidence of discrimination and show the kinds of disparate impact present in current policy, we will not be able to conclusively say that the government was enacting this policy knowingly. Fortunately, there is already evidence from other sources that suggests that this might be the case given that one transit police commander (who has since been promoted) explicitly ordered officers to target Black and Hispanic evaders over White and Asian ones (Goldstein & Southall, 2019). The second weakness we have to acknowledge is one relating to the benchmarks we can consider. In fare enforcement, the data that is available to us is extremely limited. The NYPD has been ordered (“Judge Orders NYPD To Produce Fare Evasion Data”) to release more complete data on their enforcement practices including tickets, but they have yet to do so. The MTA also performs surveys of fare evasion using their own employees but that data is not made public either (apart from city wide estimates (Albert et al., 2020)). What we can do is make reasonable assumptions in order to resolve this benchmark problem. The major assumption I will make to perform the discrimination analysis going forward is that while there are likely differences between fair evasion arrest rates between populations, those are likely relatively modest. For example, in a 2011 study researchers found that stations in poor areas had around 2-4 times the evasion rate as those in wealthier areas (Reddy et al., 2011). That magnitude of difference in evasion rates seems reasonable to assume between different groups of people even if we can’t measure it directly. Following this assumption, we can use more readily available benchmarks like simply comparing rates of prevalence in the general public and in arrest data to determine the level of enforcement for different groups of people (while keeping in mind that differences of up to 400% might be due solely to differences in evasion rate). The goal of this analysis will be to determine whether there is evidence that some discriminatory factor was a part of how fare evasion was enforced in New York. I will use this analysis going forward whenever considering discriminatory burden.
Analysis of Arrest Data
The previous chapter examined what tests and criteria of discriminatory policy the courts have applied to statistical patterns of law enforcement. To reiterate the test I will use: I will examine whether fare enforcement data contains evidence that some groups are being burdened in comparison to a benchmark to determine if discriminatory factors influenced fare enforcement in New York. To complicate this analysis, we do not have access to data about who actually commits fare evasion and where that occurs, only who is arrested, the most severe possible outcome for a police interaction on this basis. For that reason, we will largely use city and transit commuter demographics to do this analysis which requires the assumption that fare evasion is relatively evenly spread in New York City, based on previous evasion data we assume there is around a 200-400% between populations of different evasion rates (Reddy et al., 2011). While this certainly is not fully true, using this group baseline give us a rough estimate of how enforcement impacts various communities. To answer the question of discriminatory factors, we will examine three categories of statistics (modeled on similar comparisons from Floyd) using fare enforcement data from the NYPD: 1) do arrests disproportionately fall on one group of people? 2) are arrests geographically concentrated in certain areas? And 3) are certain groups arrested at higher rates systematically, indicating some level of profiling? Through these questions, we can establish whether there is evidence that discriminatory policing might be occurring.
A note about measuring the magnitude of discrimination and confounding variables: all data in 27
the criminal justice is inherently not ground truth data. In particular, the data we use is arrest statistics from policing patterns by the NYPD, which carries with it significant biases in data collection. For illustrative examples from other contexts, we can look to drug arrest statistics and the practice of stop-and-frisk by the NYPD. In nationwide drug arrest stats there are well documented demographic and geographic biases in the data produced by police arrests. Drug arrests during the 1990s war on drugs were found to be about 49% Black for drug distribution and 36% for drug possession while a national survey found that drug sellers were 16% Black and drug users were 13% Black (Langan, 1995). Similar data was used to show that, in 2011 in Oakland, while drug users were present in much of the city, arrests were concentrated in poor non-White areas (Lum & Isaac, 2016). A similar study found that stop-and-frisk in New York led to higher rates of stops for minority suspects than were present in arrests for crimes and lower “hit rates” (the percentage of stops that resulted in charges) for those populations. This was true even controlling for the place of arrest. In fact, stops in predominantly White areas were higher when compared to arrest rates in the racial categories and lower hit rates, presumably because there was a lower bar for suspicion (Gelman et al., 2007). The authors of that study even concede that arrests are not an actual measure of crime rate but that it was the best available. With all of this in consideration, we move to our own data analysis that has no similar baseline to compare to. It is fair to say that we can not make as clear of conclusions about discrimination since we lack a clear comparison. On the other hand, all data on policing is flawed and collecting data to measure the difference from the baseline is infeasible for this work so we will rely on the analysis we can do here.
4.1
Data Overview and Cleaning
The data I examined comes from the NYPD’s open data set of historic arrests (“NYC Open Data: NYPD Arrests Data (Historic)”). This data set includes an entry for every arrest in New York City from 2006 to 2018, a total of 4,798,339 arrests. Each entry includes the arrest’s date, location, the crime alleged in the arrest, demographic information about the arrestee and information about the arresting authority like the precinct. But I am not interested in every arrest made in New York, I just want to examine arrests for evading fare, or as it is formally known in New York State Law “Theft of Services” which is New York Penal Law Section 165.15(3). This offense has its own code in the arrest data set, so I restrict the analysis to arrests that have been tagged with that code. Finally, arrests for this offense can include
“intent to obtain railroad, subway, bus, air, taxi or any other public transportation service without payment” (New York Penal law), so we need to restrict only to arrests that are related to subway fare evasion. Figure4-1 shows these arrests against a map of New York City and the subway lines. Looking at the distribution of distances from arrests to the center of the closest subway station (Figure4-2), the vast majority of arrests occur within 250m of a subway station, about 1-3 city blocks.1 Because most arrests for fare evasion are public transit related and most occur very close to a subway station, I set the cut off for the maximum distance from a subway station to 250m. I then assume that arrests occurring further than that from a subway stop are likely arrests for taxi or bus fare evasion and those within that distance are subway fare evasion. This rough estimation will likely result in some false positives, but it is likely accurate to say that those arrests occurred due to patrols at the subway station, either at the station turnstiles or at bus stops in the station area. Going forward, when doing analysis on these arrests, I use this subset of arrests that occurred within 250m of a subway station and when I do station analysis, I will use the station closest to each arrest as the station where the arrest occurred.
In addition to the arrests, I also incorporated subway turnstile data to account for the usage of the station. The data spans 2010 through the present, though I will primarily use the turnstile entries for 2010 through 2018 as those track with opportunities for fare evasion since New York City uses a turnstile system for fare collection.This data comes from the MTA’s turnstile database which logs data from every turnstile unit in the city every four hours (“MTA: Turnstile Data”). This data had to be cleaned to account for its record keeping artifacts and significant outliers were removed. It was then merged with the station location data by hand and down-sampled to daily counts to match the time resolution of the arrest data. I also combined the data from turnstiles entry areas that open onto the same station interior while sometimes these are separated in the station location data. This might introduce some error in our estimates of station business but in my view it is less arbitrary than attempting to divide the traffic for stations that are considered the same station since these entrances don’t have different names in the turnstile data set. The most heavily used stations are busy Manhattan transit hubs like Grand Central, Times Square and Penn Station. The distribution of mean daily entries is shown in Figure4-1, The vast majority of stations are less busy with several moderately busy
1This distance is calculated using the Haversine distance between the arrest’s coordinates and the centroid of the station geometry. While using Haversine distance over Euclidean distance likely does not hugely impact the results, I did so anyway.
stations and a few dozen very busy stations. This means that a more accurate measure of arrest intensity is arrests per rider since some stations might have many arrests simply due to there being 10 or more times more passengers entering there. After this cleaning, I primarily use this data to scale arrests by the business of the station to approximate a measure of arrests per rider.
4.2
Overview of Arrest Statistics
Figure 4-4: Yearly arrests.
There are several important high level patterns in the arrest data. As seen in Figure 4-4, arrests for fare evasion rose from 2006 to 2012 and stayed relatively stable until 2015. They then fell rapidly though 2018, the most recent year for which we have data.
Looking at demographic arrest data and demographic data from the Census’ American Com-munity Survey (Figure 4-5), we see that arrests are disproportionately of Black and Latino young men. The data shows that all races made up relatively similar proportions of the city’s population and those who ride transit to work. This means that Black transit riders were 10.2 times more likely than Whites to be arrested. Latinos were 5.2 times more likely. Asians, on the other hand, were 1.6 times less likely to be arrested than Whites. Males were slightly less likely than females to ride transit to work but male transit commuters were about 5 times more
likely than female commuters to be arrested for fare evasion.2 The ACS commuting data does not include schoolchildren and workers under 16 so instead I estimate differences in how likely all New Yorkers are to be arrested for fare evasion. New Yorkers under 25 were 1.4 times more likely than New Yorkers 25-44 years of age to be arrested for fare evasion and New Yorkers 45+ years old were 2.9 times less likely to be arrested.
There is also significant geographic variation in arrests in addition to demographic disparities. Manhattan and the Bronx have higher portions of the arrests than they do transit commuters living there while Brooklyn and Queens have fewer arrests than commuters. Manhattan likely hosts a larger share of fare evasion arrests than it does transit riding residents due to it having many of the largest transit hubs in the city and it being the destination for many commuters. The Bronx also experiences a much larger share of the arrests in relation to its share of New York’s population and transit riders. In fact, the difference in arrest rates between stations is enormous. Figure 4-8 shows a histogram of the arrest rate at every station. The majority of stations see less than 1 arrest in 100,000 entries to that station 3 while some stations see as many as 15. This means that an evader (assuming that all riders are equally likely to be evaders ⁴) is more than 17 times more likely to be arrested at the most heavily policed station than at the majority of stations. This is likely the cause of the geographic variation shown on the borough scale. Those boroughs with a higher proportion of arrests are also those with the stations that have the highest arrest rates. Examining this variation in arrest rates between stations will make up the bulk of the analysis here.
2Data from both the NYPD and the Census Bureau classify all people as either male or female and make no distinction for gender non-conforming people.
3four saw none at all
⁴This is obviously quite a strong assumption but I use it here to gain a bit of clarity about differences between stations. It is likely that the difference is lower than 17 times but without a better way to estimate this is the most appropriate estimation
Figure 4-5: Race statistics of fare evasion arrests compared to city and transit commuter population.
Figure 4-7: Age statistics of fare evasion arrests compared to city and transit commuter population.
4.3
Patterns of geographic discrimination
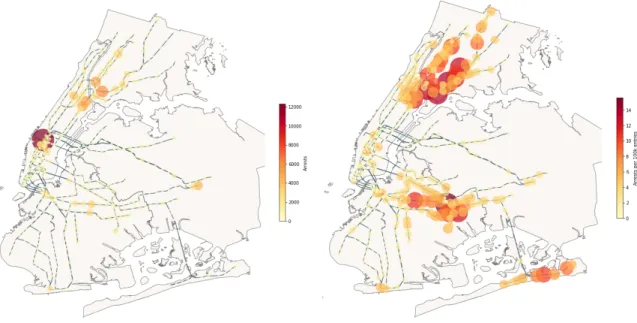
Figure 4-10: Stations colored and scaled by arrests (left) and arrests per 100k entries (right). In this chapter, I examine maps and correlations between arrest rate and demographics. Ex-amining arrest rate emphasizes how heavy a police presence the average rider will experience at a particular station. This also de-emphasizes the role of major transit hubs in the data. As we can see in Figure 4-10, the map of total arrests has only a few hot-spots, including transit hubs in midtown Manhattan. If we scale by arrest rate, we can see that there are many more stations that have higher numbers of arrests per passenger than those evident in the total arrest data.
Next we examine where those stations that have high rates of arrest tend to lie based on neighborhood demographics. In Figure 4-11, we can see the stations’ arrest rate mapped onto a map of city census tracts colored by what percentage of the city is below the Federal poverty line. Here we can see that while poverty is prevalent in many areas in the city and heavily policed stations often lie within high poverty communities, there are several high poverty areas without highly policed stations, largely in Queens and Southern Brooklyn. In Figures 4-12 and 4-13 we examine similar maps for the percentage of a tract that are Black or Hispanic/Latino,
and we see a similar phenomena: while highly policed stations are clearly more heavily concentrated in Black and Latino communities, there are others that do not see as high a concentration of heavily policed stations. In fact, as we can see in Figure 4-14, the most heavily policed stations are concentrated most heavily in those where multiple factors overlap. The Bronx and Harlem in particular have high poverty rates, are heavily Black and Latino and have the largest concentration of heavily policed stations. Brooklyn’s poor communities of color are also heavily impacted by fare evasion policing. In particular, heavily policed stations are common in the Black communities of Crown Heights, East New York and Bedford-Stuyvesant as well as the Latino neighborhood of Bushwick.
Figure 4-12: Map of stations scaled by arrest rate and census tracts colored by percent of tract who are Black.
Figure 4-13: Map of stations scaled by arrest rate and census tracts colored by percent of tract who are Hispanic or Latino.
Figure 4-14: Map of stations scaled by arrest rate and census tracts colored by percent of tract who are Black or Hispanic/Latino and poor.
We can also quantify this correlation using multi-linear regression that takes these factors into account. In order to do so, I estimated the population demographics of every station’s surrounding census blocks by summing the ACS population and demographic estimates of the census blocks whose centroids lie within 600m of each station. I then estimated the regression coefficients using an ordinary least squares estimator and tested the significance of the coefficients using a Student’s t-test with threshold 0.05. The results of this regression can be seen in Table 4.1. The R-squared value for this regression was 0.523. The correlation between the arrest rate at a subway station and the demographics of its surrounding neighborhood is statistically significant for the Latino, poor Black,and poor Latino rates. Each percentage point increase in poor Black or poor Latino rates corresponds with an 8.69% or 8.23% increase in arrest rates from the mean. Each percentage point increase in Latino rate corresponds to a 1.3% decrease in arrest rates. These strong correlations with demographic factors indicate that poor Black or poor Latino areas are disproportionately impacted by the enforcement of fare: the policy of fare arrests is being applied in a way that has a disparate impact on vulnerable neighborhoods.
coefficient std error t-test P>|t| bottom 25% top 97.5% Intercept 0.5945 0.719 0.827 0.409 -0.818 2.007 White rate -0.0014 0.008 -0.179 0.858 -0.017 0.014 Black rate 0.0044 0.012 0.368 0.713 -0.019 0.028 Poverty rate -0.0109 0.018 -0.596 0.552 -0.047 0.025 Latino rate -0.0285* 0.012 -2.449 0.015 -0.051 -0.006 Black poor rate 0.1881* 0.040 4.740 0.000 0.110 0.266 Latino poor rate 0.1773* 0.036 4.888 0.000 0.106 0.249
Table 4.1: Regression results for arrest rate correlated with ACS demographic data. * indicates statistically significant correlations. The first column reports the estimated regression coefficient and the following report statistics about the distribution of that estimate.
4.4
Unequal policing within stops - evidence of explicit
profil-ing
Finally, I will examine how demographics of arrestees vary within each station and how they compare to the demographics of the surrounding neighborhood. For this analysis, we again use the demographics of the census tracts whose centroids lie within 600m of the station. Figures 4-15-4-18 show racial statistics for arrests on the y-axis and surrounding areas on the x-axis. The red line represents demographic parity, defined here to be when arrests are the same percentage of that race as are the percentage of people of that race in the surrounding area. The two most striking characteristics are the patterns for White and Asian people compared to the pattern for Black people. White and Asian people are arrested at systematically low rates: very few stations lie at or above demographic parity. This is especially apparent for White arrestees and New Yorkers, most stations have proportions of White arrestees that are well below their incidence in the surrounding area. Black people, on the other hand, are systematically over-represented in arrestees when compared to the surrounding area. In fact, at 98.7% of stations, White arrests are at or below demographic parity with the surrounding area and 97.7% of stations Asian arrests are at or below demographic parity. Almost no stations have Black arrests below demographic parity and few are at it. This is especially apparent when looking at the low end of the surrounding area axis: in the narrow range of stations in areas that have almost no Black residents, it is very common for the majority of arrests to be of Black New Yorkers. This is also true quantitatively, 94.5% of stations have Black arrest percentages above demographic parity with the surrounding area. Finally, there is less of a pattern for Latino arrestees: many stations are at or below demographic parity and many stations are above demographic parity. Looking at the numbers, 52.4% of stations have Hispanic/Latino arrests above demographic parity and 47.6% are at or below it. This indicates that while Latinos were arrested more often than Whites and Asians in comparison to neighborhood demographics, it was not as systemic or to the same degree as for Blacks. There are at least two possible explanations for this phenomenon: (1) Black riders evade at far higher rates than White and Asian riders, and Latinos evade at somewhat lower rates; or (2) NYPD officers arrest Black and Latino riders more often for the same offense or with a lower level of suspicion of wrongdoing than for White and Asian riders. The second explanation would be explicit racial profiling by the NYPD, an unconstitutional discriminatory policy. This might take two forms, both of which are unconstitutional. In the first case, generally speaking,
Black fare evaders are arrested while White fare evaders are not. That makes this policy selective enforcement on race. In the second case, Black fare evaders might be subject to a lower bar for arrests. For example if Black riders are arrested if their record shows that they have evaded at least twice, while a White evader might need to be ticketed ten times before being arrested. The second policy amounts to racial profiling, since the evidence required for an arrest is much lower for Blacks. These two possible policies under the second explanation would be unconstitutional no matter how accurate the first factor was. That is, that Black riders did indeed evade fares more often than White or Asian riders. This is because the second explanation amounts to explicit racial consideration which is unconstitutional unless there is no other way to achieve government policy (almost certainly not the case here). While we have no way of determining which of these explanations is more influential using only this data, there is evidence for the second explanation from sworn testimony. In 2019, several ex-NYPD transit officers alleged that commanders in the transit bureau had directed them to target Black and Latino fare evaders and prioritize them over White and Asian evaders(New York Times Editorial Board, 2019).
Figure 4-15: Proportion White of arrests vs. surrounding area at each station, red line represents demographic parity.
Figure 4-16: Proportion Asian of arrests vs. surrounding area at each station, red line represents demographic parity.
Figure 4-17: Proportion Black of arrests vs. surrounding area at each station, red line represents demographic parity.
Figure 4-18: Proportion Hispanic/Latin of arrests vs. surrounding area at each station, red line represents demographic parity.
4.5
Conclusion
What we have shown is that there is evidence of a practice that meets all three of our criteria for discriminatory burden against the benchmark: 1) arrests are disproportionately made up of young, Black and Latino men by a wide margin, 2) arrests are heavily concentrated in poor Black and Latino neighborhoods and 3) arrests are disproportionately made up of Black New Yorkers in almost 95% of stations and disproportionately less like to be of White and Asian New Yorkers in a similar proportion of stations. We assessed the first claim by comparing arrest demographics with general demographics of transit riders. The second claim was investigated using correlations between neighborhood demographics and the rate of arrest per rider at a given station. And the final claim was shown by comparing the demographics of arrests at each station with the demographics of a surrounding area and observing systemic trends. Since these differences between groups far outstrip the differences seen in previous studies about fare evasion that we are relying on for our baseline assumption, the conclusion we must come to is that there is evidence of significant discriminatory consideration in the NYPD’s enforcement of fare evasion.
Predictive Policing: Methods, Fairness
and Context
Predictive policing is a rapidly growing part of the way that police departments across the US (and the world) conduct their business. In one 2012 survey, 38% of departments said they use predictive policing and 70% expected to in the next 2-5 years (Police Executive Research Forum, 2014). The technology’s backers and sellers claim it can as much as double the efficiency with which police proactively patrol for crime. Detractors point to serious issues with transparency, question the legitimacy of prediction and raise serious concerns about how it will compound discrimination in policing. In this chapter, I will explore the technology, examine some of the more popular models in detail, review the concerns that it raises, with a particular focus on discrimination, and discuss what has been proposed to deal with those issues.
What actually is predictive policing? If we were to believe those who make it, it can tell us when and where crime will happen before it happens, as well as what type of crime it will be. That might sound like divination or science fiction (and many news outlets have framed it as such, often referencing The Minority Report to evoke visions of a world where crime is prevented before it happens) but the promise and function of this technology is actually much more subdued. As one RAND Corporation report put it “Predictive policing is the application of analytical techniques...to identify likely targets for police intervention...by making statistical predictions” (Perry et al., 2013). More specifically, predictive policing estimates risk using data
from police and criminal justice records. In current practice, there are two kinds of risks that these technologies estimate: the risk that a particular location will have a specific type of crime occur there and the risk that a particular person will commit a crime. Prediction on places is far more common than those that attempt to predict future perpetrators. The only known program to predict on people has recently been decommissioned after years of contention about its utility, fairness and legality (Charles, 2020) (Saunders et al., 2016) (Tucek, 2019). Place-based prediction, on the other hand, has spread widely across the US. PredPol, one of the most popular of these programs, claims that they help make law enforcement decisions for 1 in every 33 Americans (Company, 2020) and a 2015 Forbes report found they were in 60 US police departments (Huet, 2015). It is this type of predictive policing technology we will focus on because of its popularity and hypothetical applicability to fare evasion.
Place-based predictive policing is not much different from data-based policing practices that have been common for decades. Known as crime mapping, these techniques grew from efforts by the NYPD to understand the areas of the city that were most prone to have crimes occur, starting with very basic crayon on paper maps in the 1980s, evolving to maps with pushpins by 1990 and becoming computerized with the introduction of CompStat in 1994 (IBM, Predictive Crime Fighting). These methods identify places where crime is common for the purpose of intensifying police presence in those areas, with the logic that placing more cops will deter criminal activity and allow cops to more swiftly respond to crime. And, since crime is often heavily concentrated in very small areas in a city, this technique, known as hotspots policing, has been shown to reduce several types of crime in the city as a whole (G. O. Mohler et al., 2015). The growing reliance on these tools for decision making, like the officer allocation decisions these crime maps are used for, is a long-standing trend in the criminal justice system with such data-based approaches used in recidivism risk assessment since as early as 1928 (Ferguson, 2017, see footnote 33 referencing JC Olson, Training to See Risk). Today, these types of assessments are common in criminal courts, where alleged sex offenders have been detained before trial using these tools and over 85% of juvenile courts use some actuarial system, as well as family court and civil confinements in addition to the recidivism assessments that have a longer history (Ferguson, 2017, page 1121-1122). Place-based predictive policing fits into this broader context and can be thought of as the use of more advanced statistical methods for prospective crime analysis when compared to tradition crime mapping. As Andrew Ferguson puts it in his article, ”Policing Predictive Policing”, “The move toward predictive policing, then, is more a shift in tools than strategy” (Ferguson, 2017,
page 1123). These new predictive tools fall into two general categories: methods that use the presence of past records of crime primarily for prediction and those that look at geographical locations’ relationships to crime (Perry et al., 2013). The models most widely referred to as “predictive policing” are advancements to these two categories or combine the advanced methods to produce correlations based on the most data possible (Upturn, 2016). The records-based models divide the area in question into an even grid and use some metric or modeling technique to estimate the risk of crime in each of the grid squares. Traditional hot spot approaches would use a running sum of the previous N days of crimes and then broadening the prediction by using covering ellipses or kernel density estimate on the count data (Perry et al., 2013). These methods are generally not termed to be “predictive policing” but are used by most police departments (Perry et al., 2013, page 55). PredPol, the most popular current predictive policing model, uses an approach that incorporates a near-repeat effect. The logic goes that crimes in a certain area often cause nearby similar crimes. In the case of burglary it might be because the criminal finds success there or knows of local weaknesses or in the case of gang shootings, they prompt retaliation (G. O. Mohler et al., 2015). Given a discrete cell with coordinates𝑥 , 𝑦 and a time𝑡, the conditional intensity of events is modeled in this
approach as 𝜆(𝑥, 𝑦, 𝑡 ) = 𝜇 (𝑥, 𝑦) + Õ 𝑡𝑖 <𝑡 𝑔(𝑥 − 𝑥𝑖, 𝑦− 𝑦𝑖, 𝑡 − 𝑡𝑖) (5.1)
where𝑡𝑖, 𝑥𝑖, 𝑦𝑖 is the time and coordinates of the𝑖-th past event. 𝜇(𝑥, 𝑦)represents the
back-ground rate of crime, much like the hot spots approach, and𝑔(∗)is a kernel for incorporating
the near-repeat effects. This kernel gives more weight to records that are nearer in time and space to the considered location (G. O. Mohler et al., 2015). Risk Terrain Modeling is another very popular predictive policing methodology and is a good example of the location-based relationship approach. They consider geographic locations, such as bars, clubs or liquor stores, and assess risk based on empirical relationships between the proximity of places and the frequency and number of crimes (Perry et al., 2013) (Kennedy et al., 2015). This is a markedly different approach from PredPol since it focuses on long term trends in crime and environmental factors rather than attempting to predict bursts of criminality. Finally, there are those methods that combine these two approaches. Hunchlab (now Shotspotter Missions) uses a random forest approach to combine a near-repeat model, locations like those considered in RTM and seasonality/event data (Azavea, 2015). What is common to all of these methods are a set of concerns that have been raised regarding effectiveness, transparency, validity and