HAL Id: hal-02347041
https://hal.archives-ouvertes.fr/hal-02347041
Submitted on 5 Nov 2019HAL is a multi-disciplinary open access archive for the deposit and dissemination of sci-entific research documents, whether they are pub-lished or not. The documents may come from teaching and research institutions in France or abroad, or from public or private research centers.
L’archive ouverte pluridisciplinaire HAL, est destinée au dépôt et à la diffusion de documents scientifiques de niveau recherche, publiés ou non, émanant des établissements d’enseignement et de recherche français ou étrangers, des laboratoires publics ou privés.
Capacitive Performance of Water-in-Salt Electrolyte in
Supercapacitors: A Simulation Study
Zhujie Li, Guillaume Jeanmairet, Trinidad Méndez-Morales, Benjamin
Rotenberg, Mathieu Salanne
To cite this version:
Zhujie Li, Guillaume Jeanmairet, Trinidad Méndez-Morales, Benjamin Rotenberg, Mathieu Salanne. Capacitive Performance of Water-in-Salt Electrolyte in Supercapacitors: A Simulation Study. Journal of Physical Chemistry C, American Chemical Society, 2018, 122 (42), pp.23917-23924. �10.1021/acs.jpcc.8b07557�. �hal-02347041�
Capacitive Performance of Water-in-Salt Electrolyte
in Supercapacitors: A Simulation Study
Zhujie Li,
†,‡,¶Guillaume Jeanmairet,
†,¶Trinidad Méndez-Morales,
†,‡,¶Benjamin
Rotenberg,
†,¶and Mathieu Salanne
∗,†,‡,¶Sorbonne Université, CNRS, Physico-Chimie des Électrolytes et Nanosystèmes Interfaciaux, F-75005 Paris, France, Maison de la Simulation, CEA, CNRS, Univ. Paris-Sud, UVSQ,
Université Paris-Saclay, F-91191 Gif-sur-Yvette, France, and Réseau sur le Stockage Électrochimique de l’Énergie (RS2E), FR CNRS 3459, 80039 Amiens Cedex, France
E-mail: [email protected]
Abstract
Water-in-salts is a new family of electrolytes with very promising electrochemical prop-erties for energy storage applications. Despite several studies involving them inside Li-ion batteries and supercapacitors, their interfacial properties remain largely unknown. Here we simulate the interface between electrified graphite electrodes and a highly concentrated water-in-salt (where the salt is Bis(trifluoromethane)sulfonimide lithium, LiTFSI) using constant applied potential molecular dynamics. We show that the capacitance differs markedly between the positive and the negative electrodes, which is due to the large asymmetry in size (and shape) between the ions. By using importance sampling, we further investigate the changes in
∗To whom correspondence should be addressed
†Sorbonne Université, CNRS, Physico-Chimie des Électrolytes et Nanosystèmes Interfaciaux, F-75005 Paris, France
‡Maison de la Simulation, CEA, CNRS, Univ. Paris-Sud, UVSQ, Université Paris-Saclay, F-91191 Gif-sur-Yvette, France
the structure of the salt at the interface and we observe that large variations occur, that are at the origin of a series of peaks in the differential capacitance.
Introduction
The development of efficient energy storage devices has become a major target during the past decades. Current technologies require systems with excellent performances such as high en-ergy density and high power density. The electrochemical double-layer capacitors (EDLCs), also called supercapacitors, which consist of a liquid electrolyte confined between two electrodes, are promising energy storage devices due to their high power density, reasonable energy density, high charge/discharge rates and long cycling performance.1,2The excellent performance of EDLCs is attributed to the highly reversible ion adsorption mechanism that governs their operation. It allows charging with reduced diffusion limitation and the absence of redox reactions inside the electrodes increases significantly the chemical and mechanical stability.3
The main physical property quantifying the performance of carbon-based EDLCs for energy storage applications is the interfacial capacitance.4–6 This quantity is highly dependent on the electrode/electrolyte couple as reported in previous works.7,8 In general, the main changes are at-tributed to the interfacial layer structure (or local structure) of the liquid electrolyte.9–13 Different pore sizes in nanoporous electrodes accompanying complex local structures have a large impact on the capacitance compared with non-porous electrodes.14–17However, the capacitance can also take a wide range of values both in experiment and simulation even if the electrodes are planar.18–21It is mainly the process of adsorption of cations and anions at the surface that controls the capaci-tance. The structure of the electrolyte at an interface differs from the bulk one, and it may change drastically when an electric potential is applied to the electrode. For example, Merlet et al. re-ported that the structure of an ionic liquid adsorbed on graphite electrodes can be either ordered or disordered depend on the applied voltage.18In this study, the structural changes were explained by a substantial change in the charge distribution across the interfacial region and led to changes
in the differential capacitance with applied voltage. Limmer performed systematic simulations for dense ionic solutions near charged planar electrodes and showed that first-order transitions and spontaneous charge density ordering at the interface may result in potential-driven anomalous dif-ferential capacitances.22More recently, Ma et al. reported that the differential capacitance may be strongly influenced by the charge-driven lateral structural evolution of the ions in EDLCs.23 It is therefore very difficult to predict the interfacial structure without using complex simulation and/or experimental characterization techniques.
Recently, a new class of superconcentrated electrolytes,24called water-in-salt, was proposed25 and attracted much attention due to their promising performances in batteries.26–29Both mass and volume ratio of salt-to-water could be increased up to more than 1 by choosing proper composition of salts. The formation of super-concentrated aqueous solutions in such electrolytes suppress the activity of water molecules due to the lack of free water. This enables the breakthrough of the limited electrochemical stability window of water (1.23 V) in conventional aqueous electrolytes, resulting in extended windows up to 4.0 V.27For the application of water-in-salt to EDLCs, several experimental works have been reported including some capacitance measurements.30–33 In addi-tion, a few simulation studies34–36 have aimed at understanding the interfacial structure of these electrolytes near electrodes, but their capacitive behavior has not been analyzed so far. Among the questions to be solved, an important one is whether water-in-salt behave as ionic solutions or ionic liquids. Thus, in this work, we performed molecular dynamics (MD) simulations at various applied potentials for an electrochemical cell consisting of a water-in-salt electrolyte at a concentration of 20 m (mol/kg) LiTFSI, placed between two planar graphite electrodes, in order to obtain a micro-scopic picture of the structure and the capacitive behavior on the interfaces and their dependence on the applied potentials. We discuss in particular the differential capacitances of either a single electrode or of the full electrochemical cell. We show the variations of the differential capacitance and relate them to structural changes at specific potential ranges.
Figure 1: (a) Snapshot of the simulation cell consisting of 20 m LiTFSI confined between two three-layered graphite electrodes, in which the all-atom model of electrolyte is shown at the inter-faces with H (white), O (red), Li (green), F (orange), C (cyan), S (yellow), and N (blue) atoms, respectively. The TFSI anions beyond interfaces are represented by isosurface instead. The carbon walls are shown in side views. (b) Number density profiles of Li cations, water molecules, and TFSI anions at applied potential differences ∆Ψ = 0 V (top) and 3 V (bottom).
Computational details
We use MD to simulate a cell consisting of 20 m LiTFSI placed between two graphite electrodes. The simulation box contains 255 Li cations, 255 TFSI anions and 707 water molecules (Figure 1a). We exploit an all-atom model with modified OPLS force field for LiTFSI and the SPC/E model for water.37,38 We performed an initial simulation of the bulk system to validate the parameters, which yielded an electrical conductivity of 0.79 S m−1 and a viscosity of 46.1 mPa s, in good agreement with the experimental results of Suo et al. (0.82 S m−1 and 36.2 mPa s, respectively, albeit for a slightly larger concentration in salt of 20.8 m).25 The electrodes consist of three fixed graphene layers on each side (Figure 1a) with in-plane dimensions of Lx= 32.25 Å and Ly= 34.37
Å. The length of the cell in z-direction was set to Lz = 96 Å to match the experimental density of
20 m LiTFSI in the bulk region of the simulation cell. The carbon atom charges on the electrode were allowed to fluctuate by imposing a constant potential method implemented in LAMMPS code,39–42 which ensured an adequate description of the surface polarization by ions and water during simulations. A vacuum region was added in the z-direction and the Yeh-Berkowitz condition for slab correction43 was used to mimic 2D periodic boundary condition. Its length was set to eight times Lz, which was the minimal value to ensure that the calculated carbon atom charges
were converged. Simulations were performed for 11 applied potential differences between the two electrodes, ∆Ψ, varying from 0 to 3 V in order to obtain good statistical properties. The simulations were conducted in the NVT ensemble with a time step of 1 fs at room temperature (298.15 K). The system was first equilibrated during 80 ns at zero constant charge on each electrode and followed by a 12 ns equilibration at constant potential for each ∆Ψ. The data was then collected in a 25 ns production run at constant potential with configurations saved every 1 ps for each simulation.
Results and discussion
The number densities are computed along the z-direction normal to the graphite surface. They yield bulk-like number density for each compound in the cell center (see the 0V and 3V cases in
Figure 1b), which ensures decoupling of the two interfaces. The number densities of Li cations, water molecules, and TFSI anions normalized by the corresponding bulk values are plotted in Fig-ure S1, they give results qualitatively similar to the one reported in previous work for a slightly different composition.34 For each simulation within the studied potential range, positive and neg-ative electrodes were assigned equal but opposite potential, so that ∆Ψ follows the eq Eq. (1):
∆Ψ = Ψ+− Ψ−= 2Ψ+= −2Ψ− (1)
The capacitance is one of the most important physical properties for the performance of EDLCs. However, one can define it in several ways. The integral capacitance of the full electrochemical cell, Cint, is defined as (for ∆Ψ 6= 0):
Cint(∆Ψ) = hσ i∆Ψ
∆Ψ (2)
where hσ i∆Ψ is the average surface charge density of the positive electrode (note that most of the charge is accumulated on the two graphene planes located closer to the liquid, for example at the largest applied potential, the average charge within the three graphene layers are 0.21, -2.01 and 9.66 electrons, respectively). In the present work, the calculated Cintranges from 3.5 to 4.3 µF/cm2
depending on ∆Ψ. This quantity is regularly used in applied studies to estimate the energy den-sity of the EDLCs. The differential capacitance, Cdiff, defined by ∂ hσ i∂ ∆Ψ∆Ψ, measures the response
of the average surface charge density to changes in the applied potential difference and provides much more information on the physico-chemical processes. The single electrode differential ca-pacitances can also be defined by splitting the applied potential difference, ∆Ψ, between the two electrodes into two potential drops, ∆Ψ±, at the electrode/electrolyte interface for both positive and negative electrodes. The electrostatic potential profile across the EDLC cell determines the potential drop for each interface, and is obtained by solving Poisson’s equation:
ϕ (z) = ϕq(z0) − 1 ε0 Z z z0 dz0 Z z0 −∞ dz00ρq(z00) (3)
where ρq(z) is the average charge density profile across the cell, which includes the contributions
not only from all the species of electrolyte but also from the electrode atoms, and ϕ(z0) is an
arbitrary integration constant with z0 inside the left electrode, i.e. on the left ϕ(z0) = Ψ− in our
constant potential simulations. The charge density and corresponding Poisson potential profiles are shown in Figure S2 and Figure S3. The potential of the bulk Ψbulk, is determined as the average
value of Poisson potential in the bulk region. The potential drop across each interface is then given by ∆Ψ±= Ψ±− Ψbulkand is used to characterize the interfaces.
−1.5 −1.0 −0.5 0.0 0.5 1.0 1.5 2.0 2.5
∆Ψ
±(V)
−10 −5 0 5 10 15hσ
i
(µ
C
/
cm
2)
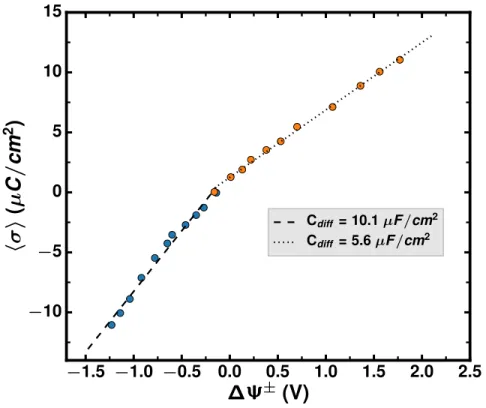
Cdiff = 10.1 µF /cm2 Cdiff = 5.6 µF /cm2Figure 2: Surface charge density as a function of the potential drop across each interface. Linear fits are shown in dotted and dashed lines for negative (σ < 0) and positive electrodes (σ < 0), respectively. The corresponding differential capacitances are given by the slope of the two curves.
The average surface charge as a function of the potential drop across each interface is repre-sented in Figure 2 for various applied potentials. The average charge density hσ i = f (∆Ψ±) plot differentiated at positive and negative surface charge with respect to ∆Ψ±, separately, provide the corresponding differential capacitances at positive and negative electrode through Cdiffs = ∂ hσ i∆Ψ
∂ ∆Ψ± .
However, as shown in Figure S4, the curve may be fitted by many polynomial functions, leading to very different shapes for the capacitance. We therefore limit ourselves to two linear fits, for ∆Ψ±
positive and negative, respectively. As shown in Figure 2, the negative electrode has a larger capac-itance (10.1 µF/cm2) than the positive electrode (5.6 µF/cm2). Such a difference is in agreement with the results reported in planar graphite electrodes and pure RTILs,44–46and it can be attributed to the different shapes or sizes of ions. The larger difference in capacitive behaviors between pos-itive and negative electrodes compared with reported results in BMIM-PF6 system (3.9 µF/cm2
and 4.8 µF/cm2 for positive and negative electrode, respectively44) arises from the much larger asymmetry between the Li cation (1.8 Å in radius) and the TFSI anion47 (10.9×5.1×4.7 Å3).
The differential capacitances can be computed more reliably using the importance sampling.18,48–50 Compared to previous equation, single electrode capacitances cannot be obtained (the full cell one Cdiff is calculated instead), but the method is much more converged statistically. This approach also allows studying microscopic properties, such as the number of ions close to the interface, as a continuous function of the applied potential difference. While for the standard approach these quantities are only available at the simulated potential. In this work, the total charge Qtot = σ × S
of the electrode (with S the surface area) is utilized to determine the weight of configurations at an arbitrarily applied potential by using the weighted histogram analysis method involved in impor-tance sampling.51,52 There is a good overlap between histograms of Qtot obtained from the eleven
performed simulations, which fulfills the requirement for correct histogram reweighting. To obtain the probability distribution of any other property, A, as a function of ∆Ψ, we just need to integrate Qtot from the joint distribution of Qtotand A as
P(A|∆Ψ) =
Z
dQtotP(Qtot, A|∆Ψ) (4)
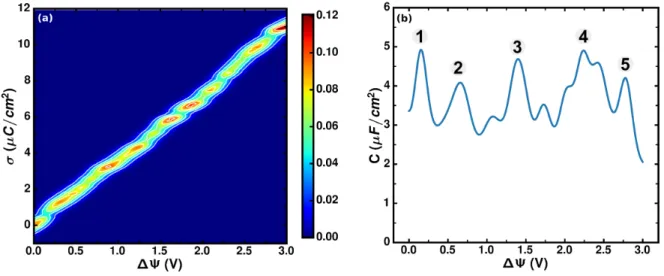
The probability distribution P(σ |∆Ψ) of electrode surface charge density at various ∆Ψ is rep-resented by a contour plot in Figure 3a. The figure shows that the surface charge density mono-tonically increases with applied potential but experiences several nonlinear shifts in the probability distribution. In particular, there are several more likely values of surface charge (red region), which are located at ∆Ψ ∼ 0, 0.35, 0.9, 1.2, 1.6, 1.8, 2.6, and 3 V. These applied potentials correspond to
Figure 3: (a) Contour plot of the probability distribution of surface charge density on the electrodes. The probability is indicated by the color bar shown on the right. (b) Differential capacitance as a function of the applied potential difference.
a more effective balance between the interfacial electrolyte and the surface charge on electrodes. The intermediate states between these points show large distributions of σ , which correspond to the large fluctuations regions where structural changes occur as we will discuss later.
The differential capacitance (in Figure 3b) is proportional to the variation of surface charge den-sity on the electrode as defined by Cdiff= kBSTh(δ σ )2i∆Ψin constant potential simulations, which
can be obtained directly from the probability distribution of σ in Figure 3a. We recall here that the relation between the response to voltage and the equilibrium fluctuations of the surface charge is not limited to a typical linear response approximation.48,53 As discussed above the charge fluctua-tions are potential-dependent and therefore the differential capacitance shown in Figure 3b exhibits a strong dependence on the applied potential. It ranges from 2 to 5 µF/cm2 with an average value of 3.67 µF/cm2, which is in agreement with 3.6 µF/cm2computed from the single electrode capac-itances as given by 1/Ctot= 1/C−+ 1/C+(Ctot is the full cell differential capacitance corresponding
to the values shown in Figure 3b). The minimum values of the differential capacitance correspond to the more likely distributions of surface charge at specific ∆Ψ. Although some of the variations are quite small and may be due to finite-size effects, we observe five pronounced peaks at ∆Ψ ∼ 0.15, 0.6, 1.3, 2.2, and 2.8 V (labeled by 1 – 5 ), that are more significant and are likely to
correspond to intermediate states between two adjacent metastable basins (Figure 3a).
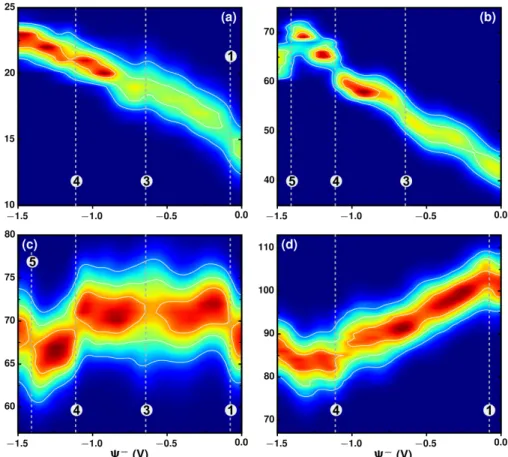
Figure 4: Number of ions in the interfacial layers on the negative electrode. Probability distribution of the number of Li cations (a), O (b) belonging to water molecules, O (c) and F (d) from TFSI anions, respectively, as a function of potential Ψ− = −∆Ψ/2, as defined in eq Eq. (1), for the negative electrode when the electrochemical cell is submitted to a voltage difference ∆Ψ.
These non-trivial features of the differential capacitance could be related to structural changes within the interfacial electrolytes. In order to investigate this possibility, the probability distribu-tions (Figure 4 and Figure 5) to find a given number of species in the interfacial layer of electrolyte are computed as a function of applied potential Ψ (-∆Ψ/2 or +∆Ψ/2 as defined in eq Eq. (1)). The interfacial layer is defined as the region within a distance of 6.6 Å from the negative (positive) electrode surface, this cutoff distance is extracted from the number and charge density profiles close to the interfaces at the studied potential range in order to account for the main adsorption peaks of lithium cations on the negative side and of TFSI anions on the positive side of the elctro-chemical cell (see Figure S1). The number of Li cations, O atoms of water, and O and F atoms of
TFSI anions in the interfacial layers on the negative and positive electrodes are shown in Figure 4 and Figure 5, respectively.
On the negative electrode, the number of Li cations increases with |Ψ−|, and the probabil-ity distribution becomes narrower at large negative potential (Figure 4a). The number of water molecules smoothly increases together with Li cations at low negative potentials (Figure 4b), but fluctuates more at large negative potentials. This may be attributed to the overlap of the Li ion solvation shells competing to include the water molecules in the presence of a large number of Li cations, and also accompanied by the changing of numbers of O from TFSI (Figure 4c). The first notable change occurs at -0.075 V (dashed lines with label 1 ) where the most probable number of F (Figure 4d) drops while the one of O from TFSI increases (Figure 4c). This indicate a reori-entation of the TFSI anions (see Figure S5 for the variation of the angular distribution of the TFSI anions with the electrode potential). At the same time the probability distribution of number of Li cations becomes different at this region. This structural change could be related to the first peak (label 1 ) of full cell differential capacitance in Figure 3b since the potential at negative electrode (Ψ−=-0.075 V) exactly matches the potential difference, ∆Ψ, at which the first peak located (∆Ψ = 0.15 V). Different probability distributions around -0.65 V, labeled as 3 are found for Li cations, water molecules, and O atoms from TFSI (Figure 4a, b, and c), respectively, resulting in the third peak of capacitance in Figure 3b at ∆Ψ = 1.3 V. The fourth peak in capacitance could be attributed to both the change of numbers and change of distributions for all species at Ψ = -1.1 V (labeled as 4 ), in which more Li cations approach the interfacial layer, along with more water molecules, and part of TFSI anions are forced to leave. Therefore, the interfacial structure strongly changes again.
On the positive electrode the interfacial structure starts to change at Ψ+ = 0.3 V as shown in Figure 5 (label 2 ). The desorption of Li cations (Figure 5a) together with water molecules (Figure 5b) starts at this potential while the number of TFSI anions keeps increasing (Figure 5c and d). These correspond to the second peak in the capacitance (Figure 3b) at ∆Ψ = 0.6 V. At higher potential, ∆Ψ ≈ 2.8 V (with Ψ± ≈ ± 1.4 V, labeled as 5 ), the distributions of number
Figure 5: Number of ions in the interfacial layers on the positive electrode. Probability distribution of the number of Li cations (a), O (b) belonging to water molecules, O (c) and F (d) from TFSI anions, respectively, as a function of potential Ψ+= ∆Ψ/2, as defined in eq Eq. (1), for the positive electrode when the electrochemical cell is submitted to a voltage difference ∆Ψ.
of O and F from TFSI become different on the positive electrode (Figure 5c and d), the number of O from TFSI (Figure 4c) increases again, along with decreasing number of water molecules (Figure 4c) on negative electrode. This synergistic effect on the two electrodes leads to the fifth peak of capacitance located at 2.8 V.
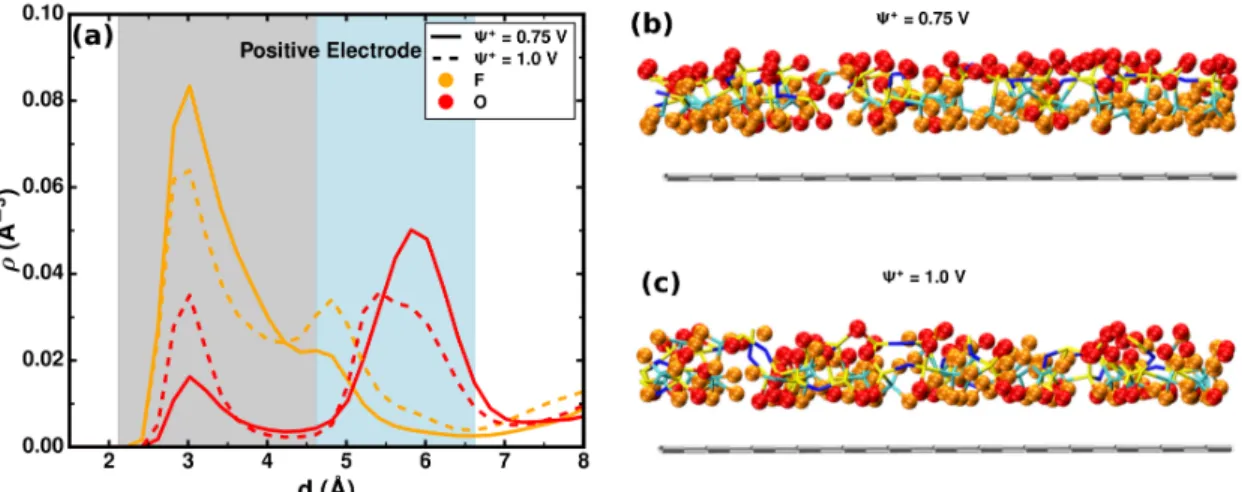
Apart from these structural changes associated with the capacitance peaks discussed above, we also observe a region between 0.75 V and 1 V, in which both the distributions and numbers of O and F from TFSI change on the positive electrode (Figure 5c and d). This reveals remarkable reorientations and rearrangements of TFSI anions at the interfacial layer on the positive electrode. We thus compare the number densities of O and F atoms from TFSI as a function of the distance from the positive electrode in this potential range. As shown in Figure 6a, the F atoms move from
Figure 6: (a) Density profiles of O and F from TFSI anions as a function of distance from the positive electrode at Ψ+ = 0.75 and 1.0 V (∆Ψ = 1.5 and 2 V). Grey and light-blue background represent the first and second adsorbed layers, respectively. (b) and (c) are the typical snapshots close to the positive electrode (grey slab on the bottom) from simulations at Ψ+ = 0.75 and 1.0 V, respectively.
the first adsorbed layer (grey region) to the second layer (light-blue region) when Ψ+ increases from 0.75 to 1 V, while the trend for O atoms is opposite. Considering that the O atom carries larger negative charge than the F atom in our simulation cell, this change indicates that the TFSI anions rotate to approach more O atoms close to the electrode. This allows to compensate the growing surface charge on the positive electrode, as illustrated by two representative snapshots at 0.75 and 1 V, respectively, in Figure 6b and c.
Conclusions
In summary, the aim of this work was to explore the capacitive performance of water-in-LiTFSI electrolyte in supercapacitors. We performed molecular dynamics simulations of 20 m LiTFSI placed between two planar graphite electrodes at various applied potentials ranging from 0 to 3 V. The integral capacitance of the full electrochemical cell as well as the single electrode ca-pacitances were computed. Using importance sampling methods, the differential capacitance was investigated as a continuous function of the applied potential difference ∆Ψ. The differential ca-pacitance displays a number of non-trivial features which can be explained by investigating the
structural evolutions of the interfacial electrolytes. Contrarily to previous works on conventional aqueous or organic electrolytes54–59the water molecules do not play a direct role on the variation of the capacitance because most of them are strongly bound inside the first hydration shell of the lithium ions, so that the capacitive behavior overall displays similar features as in the case of pure ionic liquids. This work is a first step toward understanding the capacitive behaviors of water-in-salt electrolyte in supercapacitors from simulations, in particular, the structural driven potential dependence of differential capacitance, which still requires more experimental explorations. The results could provide useful information for the understanding and development of new water-in-salts electrolytes and their applications in both supercapacitors and batteries.
Acknowledgement
This work was supported by the French National Research Agency (Labex STORE-EX, Grant No. ANR-10-LABX-0076). This project has received funding from the European Research Coun-cil (ERC) under the European Union’s Horizon 2020 research and innovation programme (grant agreement No. 771294). This work was granted access to the HPC resources of CINES under the allocation 2018–A0040910463 made by GENCI.
References
1. Simon, P.; Gogotsi, Y. Materials for Electrochemical Capacitors. Nat. Mater. 2008, 7, 845– 854.
2. Simon, P.; Gogotsi, Y.; Dunn, B. Where Do Batteries End and Supercapacitors Begin? Science 2014, 343, 1210–1211.
3. Salanne, M.; Rotenberg, B.; Naoi, K.; Kaneko, K.; Taberna, P.-L.; Grey, C. P.; Dunn, B.; Si-mon, P. Efficient Storage Mechanisms for Building Better Supercapacitors. Nat. Energy 2016, 1, 16070.
5. Vatamanu, J.; Bedrov, D. Capacitive Energy Storage: Current and Future Challenges. J. Phys. Chem. Lett.2015, 6, 3594–3609.
6. Vatamanu, J.; Borodin, O.; Olguin, M.; Yushin, G.; Bedrov, D. Charge Storage at the Nanoscale: Understanding the Trends from the Molecular Scale Perspective. J. Mater. Chem. A2017, 5, 21049–21076.
7. Chmiola, J.; Yushin, G.; Gogotsi, Y.; Portet, C.; Simon, P.; Taberna, P. L. Anomalous Increase in Carbon Capacitance at Pore Sizes Less Than 1 Nanometer. Science 2006, 313, 1760–1763.
8. Haskins, J. B.; Wu, J. J.; Lawson, J. W. Computational and Experimental Study of Li-Doped Ionic Liquids at Electrified Interfaces. J. Phys. Chem. C 2016, 120, 11993–12011.
9. Kornyshev, A. A. Double-Layer in Ionic Liquids: Paradigm Change? J. Phys. Chem. B 2007, 111, 5545–5557.
10. Fedorov, M. V.; Georgi, N.; Kornyshev, A. A. Double Layer in Ionic Liquids: The Nature of the Camel Shape of Capacitance. Electrochem. Commun. 2010, 12, 296–299.
11. Ivanistsev, V.; Kirchner, K.; Kirchner, T.; Fedorov, M. V. Restructuring of the Electrical Dou-ble Layer in Ionic Liquids upon Charging. J. Phys.: Condens. Matter 2015, 27, 102101.
12. Coles, S. W.; Mishin, M.; Perkin, S.; Fedorov, M. V.; Ivanistsev, V. B. The Nanostructure of a Lithium Glyme Solvate Ionic Liquid at Electrified Interfaces. Phys. Chem. Chem. Phys. 2017, 19, 11004–11010.
13. Gomez-Gonzalez, V.; Docampo-Álvarez, B.; Otero-Mato, J. M.; Cabeza, O.; Gallego, L. J.; Varela, L. M. Molecular Dynamics Simulations of the Structure of Mixtures of Protic Ionic Liquids and Monovalent and Divalent Salts at the Electrochemical Interface. Phys. Chem. Chem. Phys.2018, 20, 12767–12776.
Double-Layer Capacitors: Insights from Monte Carlo Simulations. Phys. Chem. Chem. Phys. 2011, 13, 11359–11366.
15. Merlet, C.; Rotenberg, B.; Madden, P. A.; Taberna, P.-L.; Simon, P.; Gogotsi, Y.; Salanne, M. On the Molecular Origin of Supercapacitance in Nanoporous Carbon Electrodes. Nat. Mater. 2012, 11, 306–310.
16. Merlet, C.; Péan, C.; Rotenberg, B.; Madden, P. A.; Daffos, B.; Taberna, P. L.; Simon, P.; Salanne, M. Highly Confined Ions Store Charge More Efficiently in Supercapacitors. Nat. Commun.2013, 4, 2701.
17. Kondrat, S.; Wu, P.; Qiao, R.; Kornyshev, A. A. Accelerating Charging Dynamics in Sub-nanometre Pores. Nat. Mater. 2014, 13, 387–393.
18. Merlet, C.; Limmer, D. T.; Salanne, M.; van Roij, R.; Madden, P. A.; Chandler, D.; Roten-berg, B. The Electric Double Layer Has a Life of Its Own. J. Phys. Chem. C 2014, 118, 18291–18298.
19. Friedl, J.; Markovits, I. I.; Herpich, M.; Feng, G.; Kornyshev, A. A.; Stimming, U. Interface between an Au(111) Surface and an Ionic Liquid: The Influence of Water on the Double-Layer Capacitance. ChemElectroChem 2017, 4, 216–220.
20. Su, Y.-Z.; Fu, Y.-C.; Yan, J.-W.; Chen, Z.-B.; Mao, B.-W. Double Layer of Au(100)/Ionic Liquid Interface and Its Stability in Imidazolium-Based Ionic Liquids. Angew. Chem., Int. Ed. 2009, 121, 5250–5253.
21. Wen, R.; Rahn, B.; Magnussen, O. M. Potential-Dependent Adlayer Structure and Dynamics at the Ionic Liquid/Au(111) Interface: A Molecular-Scale In Situ Video-STM Study. Angew. Chem., Int. Ed.2015, 54, 6062–6066.
22. Limmer, D. T. Interfacial Ordering and Accompanying Divergent Capacitance at Ionic Liquid-Metal Interfaces. Phys. Rev. Lett. 2015, 115, 256102.
23. Le Ma, J.; Meng, Q.; Fan, J. Charge Driven Lateral Structural Evolution of Ions in Elec-tric Double Layer Capacitors Strongly Correlates with Differential Capacitance. Phys. Chem. Chem. Phys.2018, 20, 8054–8063.
24. Wang, J.; Yamada, Y.; Sodeyama, K.; Chiang, C. H.; Tateyama, Y.; Yamada, A. Superconcen-trated Electrolytes for a High-Voltage Lithium-Ion Battery. Nat. Commun. 2016, 7, 12032.
25. Suo, L.; Borodin, O.; Gao, T.; Olguin, M.; Ho, J.; Fan, X.; Luo, C.; Wang, C.; Xu, K. “Water-in-Salt” Electrolyte Enables High-Voltage Aqueous Lithium-Ion Chemistries. Science 2015, 350, 938–943.
26. Yamada, Y.; Usui, K.; Sodeyama, K.; Ko, S.; Tateyama, Y.; Yamada, A. Hydrate-Melt Elec-trolytes for High-Energy-Density Aqueous Batteries. Nat. Energy 2016, 1, 16129.
27. Yang, C.; Chen, J.; Qing, T.; Fan, X.; Sun, W.; von Cresce, A.; Ding, M. S.; Borodin, O.; Vatamanu, J.; Schroeder, M. A. et al. 4.0 V Aqueous Li-Ion Batteries. Joule 2017, 1, 122–132.
28. Suo, L.; Borodin, O.; Wang, Y.; Rong, X.; Sun, W.; Fan, X.; Xu, S.; Schroeder, M. A.; Cresce, A. V.; Wang, F. et al. “Water-in-Salt” Electrolyte Makes Aqueous Sodium-Ion Bat-tery Safe, Green, and Long-Lasting. Adv. Energy Mater. 2017, 1701189, 1701189.
29. Wang, F.; Borodin, O.; Gao, T.; Fan, X.; Sun, W.; Han, F.; Faraone, A.; Dura, J. A.; Xu, K.; Wang, C. Highly Reversible Zinc Metal Anode for Aqueous Batteries. Nat. Mater. 2018, 17, 543–549.
30. Hasegawa, G.; Kanamori, K.; Kiyomura, T.; Kurata, H.; Abe, T.; Nakanishi, K. Hierarchically Porous Carbon Monoliths Comprising Ordered Mesoporous Nanorod Assemblies for High-Voltage Aqueous Supercapacitors. Chem. Mater. 2016, 28, 3944–3950.
31. Gambou-Bosca, A.; Bélanger, D. Electrochemical Characterization of MnO2-Based
Compos-ite in the Presence of Salt-in-Water and Water-in-Salt Electrolytes as Electrode for Electro-chemical Capacitors. J. Power Sources 2016, 326, 595–603.
32. Coustan, L.; Shul, G.; Bélanger, D. Electrochemical Behavior of Platinum, Gold and Glassy Carbon Electrodes in Water-in-Salt Electrolyte. Electrochem. commun. 2017, 77, 89–92.
33. Lannelongue, P.; Bouchal, R.; Mourad, E.; Bodin, C.; Olarte, M.; le Vot, S.; Favier, F.; Fontaine, O. “Water-in-Salt” for Supercapacitors: A Compromise between Voltage, Power Density, Energy Density and Stability. J. Electrochem. Soc. 2018, 165, A657–A663.
34. Vatamanu, J.; Borodin, O. Ramifications of Water-in-Salt Interfacial Structure at Charged Electrodes for Electrolyte Electrochemical Stability. J. Phys. Chem. Lett. 2017, 4362–4367.
35. Borodin, O.; Ren, X.; Vatamanu, J.; von Wald Cresce, A.; Knap, J.; Xu, K. Modeling Insight into Battery Electrolyte Electrochemical Stability and Interfacial Structure. Acc. Chem. Res. 2017, 50, 2886–2894.
36. Wang, F.; Borodin, O.; Ding, M. S.; Gobet, M.; Vatamanu, J.; Fan, X.; Gao, T.; Edison, N.; Liang, Y.; Greenbaum, S. et al. Hybrid Aqueous/Non-aqueous Electrolyte for Safe and High-Energy Li-Ion Batteries. Joule 2018, 2, 927–937.
37. Monteiro, M. J.; Bazito, F. F. C.; Siqueira, L. J. A.; Ribeiro, M. C. C.; Torresi, R. M. Transport Coefficients, Raman Spectroscopy, and Computer Simulation of Lithium Salt Solutions in an Ionic Liquid. J. Phys. Chem. B 2008, 112, 2102–2109.
38. Berendsen, H. J. C.; Grigera, J. R.; Straatsma, T. P. The Missing Term in Effective Pair Poten-tials. J. Phys. Chem. 1987, 91, 6269–6271.
39. Siepmann, J. I.; Sprik, M. Influence of Surface Topology and Electrostatic Potential on Wa-ter/Electrode Systems. J. Chem. Phys. 1995, 102, 511–524.
40. Reed, S. K.; Lanning, O. J.; Madden, P. A. Electrochemical Interface between an Ionic Liquid and a Model Metallic Electrode. J. Chem. Phys. 2007, 126, 084704.
41. Wang, Z.; Yang, Y.; Olmsted, D. L.; Asta, M.; Laird, B. B. Evaluation of the Constant Potential Method in Simulating Electric Double-Layer Capacitors. J. Chem. Phys. 2014, 141, 184102.
42. Plimpton, S. Fast Parallel Algorithms for Short-Range Molecular Dynamics. J. Comput. Phys. 1995, 117, 1–19.
43. Yeh, I. C.; Berkowitz, M. L. Ewald Summation for Systems with Slab Geometry. J. Chem. Phys.1999, 111, 3155–3162.
44. Merlet, C.; Salanne, M.; Rotenberg, B.; Madden, P. A. Imidazolium Ionic Liquid Interfaces with Vapor and Graphite: Interfacial Tension and Capacitance from Coarse-Grained Molecular Simulations. J. Phys. Chem. C 2011, 115, 16613–16618.
45. Merlet, C.; Salanne, M.; Rotenberg, B.; Madden, P. A. Influence of Solvation on the Structural and Capacitive Properties of Electrical Double Layer Capacitors. Electrochim. Acta 2013, 101, 262–271.
46. Xing, L.; Vatamanu, J.; Borodin, O.; Smith, G. D.; Bedrov, D. Electrode/Electrolyte Inter-face in Sulfolane-Based Electrolytes for Li Ion Batteries: A Molecular Dynamics Simulation Study. J. Phys. Chem. C 2012, 116, 23871–23881.
47. Uysal, A.; Zhou, H.; Feng, G.; Lee, S. S.; Li, S.; Fenter, P.; Cummings, P. T.; Fulvio, P. F.; Dai, S.; McDonough, J. K. et al. Structural Origins of Potential Dependent Hysteresis at the Electrified Graphene/Ionic Liquid Interface. J. Phys. Chem. C 2013, 118, 569–574.
48. Limmer, D. T.; Merlet, C.; Salanne, M.; Chandler, D.; Madden, P. A.; van Roij, R.; Roten-berg, B. Charge Fluctuations in Nanoscale Capacitors. Phys. Rev. Lett. 2013, 111, 106102.
49. Uralcan, B.; Aksay, I. A.; Debenedetti, P. G.; Limmer, D. T. Concentration Fluctuations and Capacitive Response in Dense Ionic Solutions. J. Phys. Chem. Lett. 2016, 7, 2333–2338.
50. Ray, U.; Chan, G. K.-L.; Limmer, D. T. Importance Sampling Large Deviations in Nonequi-librium Steady States. I. J. Chem. Phys. 2018, 148, 124120.
51. Ferrenberg, A. M.; Swendsen, R. H. Optimized Monte Carlo Data Analysis. Phys. Rev. Lett. 1989, 63, 1195–1198.
52. Tan, Z.; Gallicchio, E.; Lapelosa, M.; Levy, R. M. Theory of Binless Multi-State Free Energy Estimation with Applications to Protein-Ligand Binding. J. Chem. Phys. 2012, 136, 144102.
53. Rotenberg, B.; Salanne, M. Structural Transitions at Ionic Liquid Interfaces. J. Phys. Chem. Lett.2015, 6, 4978–4985.
54. Jiang, D.-E.; Jin, Z.; Henderson, D. J.; Wu, J. Solvent Effect on the Pore-Size Dependence of an Organic Electrolyte Supercapacitor. J. Phys. Chem. Lett. 2012, 3, 1727–1731.
55. Jiang, D.-E.; Wu, J. Unusual effects of solvent polarity on capacitance for organic electrolytes in a nanoporous electrode. Nanoscale 2014, 6, 5545–5550.
56. Jiang, G.; Cheng, C.; Li, D.; Liu, J. Z. Molecular Dynamics Simulations of the Electric Double Layer Capacitance of Graphene Electrodes in Mono-valent Aqueous Electrolytes. Nano Res. 2016, 9, 174–186.
57. Burt, R.; Breitsprecher, K.; Daffos, B.; Taberna, P.-L.; Simon, P.; Birkett, G.; Zhao, X. S.; Holm, C.; Salanne, M. Capacitance of Nanoporous Carbon-Based Supercapacitors Is a Trade-Off between the Concentration and the Separability of the Ions. J. Phys. Chem. Lett. 2016, 7, 4015–4021.
58. Yang, H.; Zhang, X.; Yang, J.; Bo, Z.; Hu, M.; Yan, J.; Cen, K. Molecular Origin of Electric Double-Layer Capacitance at Multilayer Graphene Edges. J. Phys. Chem. Lett. 2017, 8, 153– 160.
59. Bo, Z.; Li, C.; Yang, H.; Ostrikov, K.; Yan, J.; Cen, K. Design of Supercapacitor Electrodes Using Molecular Dynamics Simulations. Nano-Micro Lett. 2018, 10, 33.