HAL Id: hal-01830195
https://hal.archives-ouvertes.fr/hal-01830195
Submitted on 5 Sep 2020
HAL is a multi-disciplinary open access
archive for the deposit and dissemination of
sci-entific research documents, whether they are
pub-lished or not. The documents may come from
teaching and research institutions in France or
abroad, or from public or private research centers.
L’archive ouverte pluridisciplinaire HAL, est
destinée au dépôt et à la diffusion de documents
scientifiques de niveau recherche, publiés ou non,
émanant des établissements d’enseignement et de
recherche français ou étrangers, des laboratoires
publics ou privés.
concentrations (Mn, Al and Fe) during a mesocosm
experiment
K. Wuttig, Thibaut Wagener, M. Bressac, A. Dammshäuser, P. Streu, C.
Guieu, P. Croot
To cite this version:
K. Wuttig, Thibaut Wagener, M. Bressac, A. Dammshäuser, P. Streu, et al.. Impacts of dust
depo-sition on dissolved trace metal concentrations (Mn, Al and Fe) during a mesocosm experiment.
Bio-geosciences, European Geosciences Union, 2013, 10 (4), pp.2583 - 2600. �10.5194/bg-10-2583-2013�.
�hal-01830195�
Biogeosciences, 10, 2583–2600, 2013 www.biogeosciences.net/10/2583/2013/ doi:10.5194/bg-10-2583-2013
© Author(s) 2013. CC Attribution 3.0 License.
EGU Journal Logos (RGB)
Advances in
Geosciences
Open Access
Natural Hazards
and Earth System
Sciences
Open AccessAnnales
Geophysicae
Open AccessNonlinear Processes
in Geophysics
Open AccessAtmospheric
Chemistry
and Physics
Open AccessAtmospheric
Chemistry
and Physics
Open Access DiscussionsAtmospheric
Measurement
Techniques
Open AccessAtmospheric
Measurement
Techniques
Open Access DiscussionsBiogeosciences
Open Access Open Access
Biogeosciences
Discussions
Climate
of the Past
Open Access Open Access
Climate
of the Past
Discussions
Earth System
Dynamics
Open Access Open Access
Earth System
Dynamics
DiscussionsGeoscientific
Instrumentation
Methods and
Data Systems
Open Access
Geoscientific
Instrumentation
Methods and
Data Systems
Open Access DiscussionsGeoscientific
Model Development
Open Access Open Access
Geoscientific
Model Development
DiscussionsHydrology and
Earth System
Sciences
Open AccessHydrology and
Earth System
Sciences
Open Access DiscussionsOcean Science
Open Access Open Access
Ocean Science
Discussions
Solid Earth
Open Access Open Access
Solid Earth
Discussions
The Cryosphere
Open Access Open Access
The Cryosphere
Discussions
Natural Hazards
and Earth System
Sciences
Open Access
Discussions
Impacts of dust deposition on dissolved trace metal concentrations
(Mn, Al and Fe) during a mesocosm experiment
K. Wuttig1, T. Wagener1,2, M. Bressac3,4, A. Dammsh¨auser1, P. Streu1, C. Guieu3,4, and P. L. Croot1,* 1GEOMAR Helmholtz Centre for Ocean Research Kiel, Marine Biogeochemistry, D¨usternbrooker Weg 20,
24105 Kiel, Germany
2Universit´e d’Aix-Marseille, CNRS/INSU, IRD, Institut M´editerran´een d’Oc´eanologie (MIO), UM 110,
13288 Marseille, France
3Laboratoire d’Oc´eanographie de Villefranche-sur-Mer, CNRS-INSU, UMR 7093, Observatoire Oc´eanologique, 06230,
Villefranche-sur-Mer, France
4Universit´e Pierre et Marie Curie - Paris 6, UMR7093, LOV, Observatoire Oc´eanologique, Villefranche-sur-Mer, France *now at: Earth and Ocean Sciences, School of Natural Sciences, National University of Ireland,
Galway (NUIG), Galway, Ireland
Correspondence to: K. Wuttig (kwuttig@geomar.de)
Received: 26 September 2012 – Published in Biogeosciences Discuss.: 11 October 2012 Revised: 1 March 2013 – Accepted: 21 March 2013 – Published: 18 April 2013
Abstract. The deposition of atmospheric dust is the primary
process supplying trace elements abundant in crustal rocks (e.g. Al, Mn and Fe) to the surface ocean. Upon deposi-tion, the residence time in surface waters for each of these elements differs according to their chemical speciation and biological utilization. Presently, however, the chemical and physical processes occurring after atmospheric deposition are poorly constrained, principally because of the difficulty in following natural dust events in situ. In the present work we examined the temporal changes in the biogeochemistry of crustal metals (in particular Al, Mn and Fe) after an artificial dust deposition event. The experiment was contained inside trace metal clean mesocosms (0–12.5 m depths) deployed in the surface waters of the northwestern Mediterranean, close to the coast of Corsica within the frame of the DUNE project (a DUst experiment in a low Nutrient, low chloro-phyll Ecosystem). Two consecutive artificial dust deposition events, each mimicking a wet deposition of 10 g m−2of dust, were performed during the course of this DUNE-2 experi-ment. The changes in dissolved manganese (Mn), iron (Fe) and aluminum (Al) concentrations were followed immedi-ately after the seeding with dust and over the following week. The Mn, Fe and Al inventories and loss or dissolution rates were determined. The evolution of the inventories after the two consecutive additions of dust showed distinct behaviors
for dissolved Mn, Al and Fe. Even though the mixing con-ditions differed from one seeding to the other, Mn and Al showed clear increases directly after both seedings due to dissolution processes. Three days after the dust additions, Al concentrations decreased as a consequence of scaveng-ing on sinkscaveng-ing particles. Al appeared to be highly affected by the concentrations of biogenic particles, with an order of magnitude difference in its loss rates related to the in-crease of biomass after the addition of dust. In the case of dissolved Fe, it appears that the first dust addition resulted in a decrease as it was scavenged by sinking dust particles, whereas the second seeding induced dissolution of Fe from the dust particles due to the excess Fe binding ligand con-centrations present at that time. This difference, which might be related to a change in Fe binding ligand concentration in the mesocosms, highlights the complex processes that con-trol the solubility of Fe. Based on the inventories at the meso-cosm scale, the estimations of the fractional solubility of met-als from dust particles in seawater were 1.44 ± 0.19 % and 0.91 ± 0.83 % for Al and 41 ± 9 and 27 ± 19 % for Mn for the first and the second dust addition. These values are in good agreement with laboratory-based estimates. For Fe no fractional solubility was obtained after the first seeding, but 0.12 ± 0.03 % was estimated after the second seeding. Over-all, the trace metal dataset presented here makes a significant
contribution to enhancing our knowledge on the processes influencing trace metal release from Saharan dust and the subsequent processes of bio-uptake and scavenging in a low nutrient, low chlorophyll area.
1 Introduction
Marine oligotrophic areas, also described as low nutrient, low chlorophyll (LNLC) areas, represent 60 % of the global ocean (Longhurst et al., 1995) and are suggested to con-tribute up to 50 % oceanic carbon export from the surface to the deep ocean (Emerson et al., 1997). These areas are char-acterized by low nutrient concentrations in oceanic surface waters resulting in reduced biological activity (Carr et al., 2006; Longhurst et al., 1995). Vast surfaces of these LNLC areas are subject to fluxes of lithogenic material through the atmospheric deposition of desert dust particles. Microcosm experiments performed previously in the oligotrophic east-ern Mediterranean by Herut et al. (2005) found that the ad-dition of fresh mineral dust to seawater resulted in the re-lease of nutrients and to a positive growth response by biota; however, they did not find a response of biota to pre-leached dust, suggesting it was the presence of water soluble compo-nents in the dust that provided the nutrient stimulus. Due to the elemental composition of the earth crust, the flux of dust particles constitutes a major source of trace metals to the sur-face ocean (Duce et al., 1991; K. Desboeufs, personal com-munication, 2013). For this reason, in addition to macronu-trients (phosphorus and nitrogen) transported by dust parti-cles, it has been suggested that the response of the biota to dust might be (partially) controlled by trace metals. During the last twenty years, due to its importance in high nutrient, low chlorophyll (HNLC) areas, iron (Fe) has received much attention (Jickells et al., 2005), but in recent years, a num-ber of studies have pointed to the importance of studying other trace elements in order to more completely describe the overall biogeochemical functioning of these LNLC areas (e.g. Heller and Croot, 2010; Noble et al., 2008; Obata et al., 2008; Saito and Moffett, 2002).
In order to assess the impact of atmospherically deposited micronutrients on the biogeochemical functioning of the LNLC areas, a variety of complex factors controlling the sol-ubility of trace metals – from the solid form in a dust particle to the dissolved form once it enters the water – have to be taken into account (Baker and Croot, 2010). Indeed, in addi-tion to atmospheric factors controlling the inherent solubility of the metal in the particle (size of the particles (Baker and Jickells, 2006), mineralogy (Journet et al., 2008), chemical composition (Sedwick et al., 2007)), there are a number of factors that can be important once the particle is deposited in seawater. These factors can be the initial concentration of dissolved metals in seawater (Liu and Millero, 2002; Mendez et al., 2010), photochemical processing (Fe(III) to Fe(II))
(Zhuang et al., 1992) and lability in the atmosphere and in seawater (Spokes and Jickells, 1996). Additional factors can be the mixing layer structure (Croot et al., 2007; Moore et al., 2006) as well as specific chelating substances in seawater at the time of the deposition, as in the case of Fe (Gledhill and Buck, 2012; Wagener et al., 2008).
The Mediterranean Sea is a LNLC area, especially in sum-mer when the surface is strongly stratified. The atmospheric load over the Mediterranean has been estimated to reach up to one billion tonnes per year, which is one of the highest dust loads reaching a LNLC area (Guerzoni et al., 1999). In Corsica, dust deposition events of ∼ 22 g m−2have been ob-served (e.g. Bonnet and Guieu, 2006). The Mediterranean is a suitable place to assess the impact of dust deposition on LNLC areas. This is the objective of the project DUNE (a DUst experiment in a low Nutrient low chlorophyll Ecosys-tem) based on an original experimental approach: dust addi-tion experiments into large, clean mesocosms. This experi-mental design constitutes an opportunity to study processes once particles have deposited at the surface ocean in a realis-tic way (Guieu et al., 2009, 2010).
During the first campaign in 2008 (DUNE-1), it was demonstrated that the mesocosms were sufficiently trace metal clean to study the Fe cycle (Wagener et al., 2010). Two major results concerning Fe chemistry were gained from this first experiment:
1. A clear decrease of the dissolved iron (Fe) inventory in the mesocosms, in which a wet deposition was simu-lated, compared to the mesocosms without addition of dust, has been observed. A simple 1-D model of the mesocosms demonstrated that during the experiment the addition of dust was a sink rather than a source of Fe due to scavenging on dust particles (Ye et al., 2011). 2. Additionally, a second addition of simulated aeolian
dust in batch experiments performed with filtered sea-water, obtained from the corresponding mesocosms 168 h after the first seeding, showed a clear increase in the Fe solubility. Wagener et al. (2010) postulated that the dust addition could have induced the production of Fe binding ligands and therefore increased significantly the solubility of Fe. This would imply that a second ad-dition of dust to the mesocosms might have a stimula-tory effect on Fe dissolution and a contrasting impact from the first addition.
A second experimental campaign was performed in June and July 2010 (DUNE-2) (Guieu et al., 2013). Based on the experience gained during the DUNE-1 experiment, the strat-egy for studying trace metals was slightly changed. Under-standing the processes that govern the fluxes of Fe to sea-water is a critical challenge in chemical oceanography today. While the importance of Fe to primary productivity in the ocean is well demonstrated (Blain et al., 2007; Boyd et al., 2000), we are only now beginning to examine the exchange
of Fe between different chemical forms in seawater (Croot and Heller, 2012; Gledhill and Buck, 2012; Baker and Croot, 2010). The ability of Fe to form organic complexes (Croot and Heller, 2012; Gledhill and Buck, 2012) helps to elevate Fe levels above the low solubility of inorganic Fe(III) in sea-water (Liu and Millero, 2002); however, colloidal Fe still dominates the dissolved fraction (Bergquist et al., 2007). The chemical reactivity and biological requirement for Fe result in it being easily scavenged onto other particles and subse-quently lost from the euphotic zone. For this reason, Fe bind-ing ligand measurements have been performed in addition to the dissolved Fe concentration measurements. Moreover, two additional dissolved trace metals have been examined during DUNE-2: the biogeochemically important micronu-trient manganese (Mn) and the crustal metal aluminum (Al). In contrast to Fe, there is no organic speciation known for Al and it is also considered to be negligible for Mn (Roitz and Bruland, 1997; Sa˜nudo-Wilhelmy et al., 1996). Al is a major and relatively invariant component of the earth crust and is not known to be actively assimilated by organisms. However, Al is strongly influenced by scavenging mecha-nisms and is therefore considered to be a potentially use-ful tracer for lithogenic input on relatively short time scales (Dammsh¨auser et al., 2011). On the other hand, Mn is a bioactive metal with a complex chemistry in seawater. While most of the Mn exists as soluble Mn(II) which is not thought to be organically complexed, dissolved Mn(III) and Mn(IV) organic species are possible, but have not yet been observed in oxygenated seawater. Soluble Mn(III) is rare in natural wa-ters because it hydrolyzes and precipitates as Mn(III) oxides or disproportionate into Mn(IV) oxides plus Mn(II) (Nealson et al., 1988; Stumm and Morgan, 1996). Another important difference compared to DUNE-1 is that DUNE-2 was carried out with two consecutive seedings with the same amount of evapocondensed dust. After measuring the initial concentra-tions, the seeding with dust was performed and all experi-mental variables were determined with a higher resolution in the first day and then daily for one week. After the sec-ond addition of dust the variables were measured again for one week with a similar resolution in order to assess if the biogeochemical response to a second seeding could be influ-enced by the response to the former seeding.
This paper presents the dissolved trace metal inventories of Fe, Mn and Al during the DUNE-2 experiment. Based on the revised experimental strategy after the DUNE-1 experi-ment, the specific objectives of this study are (1) to assess dissolution and loss rates of these trace metals after two con-secutive additions of dust and (2) to quantify the processes involved at different time scales.
2 Materials and methods
2.1 Experimental design and sampling
In June 2010, seven trace metal clean mesocosms were deployed in the Bay of Elbo in the conservation area of Scandola, Corsica (42.374◦N, 8.554◦E) during typical otrophic summer conditions (Millot, 1999). Marine olig-otrophic areas, also described as low nutrient, low chloro-phyll (LNLC) areas, are typically defined by a chlorochloro-phyll a content of less than 0.1 mg m−3(Carr et al., 2006; Longhurst et al., 1995). Giovagnetti et al. (2012) showed that during the DUNE-2 experiment the chlorophyll a content always remained below this threshold even after the seedings. Their initial chlorophyll a concentration was 0.02–0.03 mg m−3. The DUNE-2 mesocosm experiment design was based on the exact same protocol as described in detail earlier (Guieu et al., 2010) for the DUNE-1 experiment in 2008. The meso-cosms were entirely made out of plastic and were composed of a cylindrical section of 12 m length and 2.3 m in diameter. The conical bottom started at 12 m depth and ended with a sediment trap at 14.5 m depth. In each mesocosm, the total seawater volume was 52 m3 and, in general, the biological, chemical and physical properties of the water column were retained within the mesocosms. To protect the mesocosms against naturally occurring dust events, they were covered with a transparent cover which was designed to let natural light pass and to allow gas exchanges between the water body and the atmosphere. The three mesocosms to which the dust was added are referred to here as D1, D2 and D3 and “dust seeded mesocosms”. Further, three trace-metal clean meso-cosms were kept without seeding as the control mesomeso-cosms (labeled here C1, C2 and C3). For comparison between the control mesocosms and the environment, samples were also taken outside the mesocosms.
The seeding with dust was performed using the follow-ing protocol. After deployfollow-ing the mesocosms, they were left open for 24 h in order to let the water masses inside equili-brate with the water masses outside of the mesocosms. After closing the mesocosms, t0 was sampled and then the meso-cosms were seeded. Two consecutive seedings with cloud processed dust (Guieu et al., 2010) were performed at an in-terval of one week. Each seeding was followed for a week with high resolution sampling in the first 24 h and subsequent daily sampling. Therefore, DUNE-2 had a higher time reso-lution than DUNE-1 where sampling was performed daily for most parameters (Guieu et al., 2010). For each of the two consecutive seedings, 41.5 g of evapocondensed dust was di-luted in ultrapure water (hereafter referred to as MQ water – see below) and sprayed with an all-plastic spray bottle onto the surface of each of the mesocosms. This corresponds to a simulated wet deposition of 10 g m−2for each seeding. The first seeding took place on 26 June 2010 at 09:00 UTC (t0), the second on 3 July 2010 at 07:00 UTC (t166).
In each of the six sampled mesocosms, flexible reinforced PVC tubings were installed at 0.1, 5 and 10 m depth. Sam-pling was performed with a TeflonTM (polytetrafluoroethy-lene) diaphragm pumping system. For dissolved trace metals, samples were filtered inline through 0.2 µm filter cartridges (Sartorius Sartobran filter capsule 5231307H5, Germany). Additionally to DUNE-1, two dust seeded mesocosms (D1 and D2) were deployed with three supplementary tubings in-stalled at 2.5, 7.5 and 12.5 m depth in order to improve the resolution in the water body and to be able to follow the pro-cesses after a simulated dust storm on a smaller scale.
2.2 Chemical Analysis
2.2.1 Reagents and bottles
Strict attention was paid to avoiding contamination in this study. All manipulations were performed in class 100-laminar flow benches. All reagents that were used were of highest purity available (Fisher Scientific and Sigma-Aldrich) and were prepared using deionized (18 M cm−1 resistivity) water (MQ water) from a Milli-Q purification system (Millipore). Sub-boiled quartz-distilled hydrochlo-ric acid (hereafter Q-HCl) was made by single distillation from 25 % HCl. All plasticware and bottles (low density high polyethylene (LDPE) and polytetrafluoroethylene (PTFE)) used for acidified seawater samples for the total trace metal analysis were cleaned according to the trace metal clean pro-cedures (Bruland et al., 1979; Cutter et al., 2010) and then protected by double bags (MinigripTM). The filtered sam-ples for dissolved trace metal analysis were directly acidified with Q-HCl to pH 1.7 under a class 100-laminar flow bench in the lab at the port facilities used for servicing the meso-cosms. Samples for Fe binding ligands were directly frozen (−20◦C) upon collection in Corsica, transported frozen to Marseille, and thawed immediately prior to analysis. Sam-ple processing and analysis steps were performed in laminar flow benches inside class 100 clean rooms in Kiel (Germany) and in Villefranche-sur-Mer (France).
In this paper we only discuss the dissolved trace metals (referred to as Mn, Fe and Al).
2.2.2 Dissolved manganese analysis
Samples for dissolved manganese (Mn) were analyzed on site. The acidified samples were spectrophotometrically ana-lyzed using a slightly modified flow-injection analysis sys-tem (FIA) built following Aguilar-Islas et al. (2006). We used one 8-channel peristaltic pump (Rainin), two electron-ically actuated 6-port valves, one electronelectron-ically actuated 10-port sample valve (all VICI, Valco Instruments), one dry bath (Fisher) kept at 35◦C and a variable wavelength spec-trophotometer (USB-4000, Ocean Optics, Inc.) with an in-ternal Ocean Optics light source and a 1 cm quartz flow-through cell (100-QS, 10.00 mm, Hellma GmbH and Co.
KG). The flow rates were identical with those in Aguilar-Islas et al. (2006). The filtered and acidified seawater sample was preconditioned for 30 s by flushing with 0.05 mol L−1
ammonium borate rinse solution on a pre-concentration column (GLOBAL-FIA) filled with Toyopearl AF-Chelate-650M resin. The timing parameters were for precondition-ing, loadprecondition-ing, rinse and elution of the column: 30, 120, 30, 180 s, respectively.
Calibration curves were determined daily by the addi-tion of standards (0–10 nmol L−1)produced by serial dilu-tion of a 1000 ppm Mn(II) standard (Fluka) into 0.2 µm fil-tered Mediterranean seawater which had been taken before the first seeding at 5 m depth outside of the mesocosms at our external reference point (t0, outside, 5 m). For exter-nal validation, selected samples were also aexter-nalyzed in the clean laboratory in Kiel by graphite furnace atomic absorp-tion (ETAAS, Perkin-Elmer Model 4100ZL; this method is described in detail below).
Samples, standard additions and blanks were measured in triplicates. Analytical precision (expressed as percent rela-tive standard deviation) was typically < 8 % at 3.6 nmol L−1 under the conditions employed here. The accuracy of the analytical procedure was evaluated by daily measurements of SAFe intercalibration samples S and D2. It should be noted, however, that the SAFe concentrations are over a lower range (< 1 nmol L−1)than the seawater samples from the mesocosms (< 3.5 nmol L−1), which leads to lower pre-cision for the SAFe samples using our system optimized for Mediterranean surface waters. SAFe values determined while in Corsica were as follows: 0.85 ± 0.14 nmol L−1(S) and 0.35 ± 0.09 nmol L−1 (D2) of Mn (n = 8) (consensus
values are 0.79 ± 0.06 nmol L−1and 0.35 ± 0.06 nmol L−1,
respectively). We used a large volume of secondary standard (0.2 µm filtered Mediterranean seawater (t0, outside, 5 m)) throughout this work as the seawater in which standard ad-ditions were prepared. The complete Mn-FIA measurements over the course of the work in Corsica resulted in a value of 3.60 ± 0.30 nmol L−1, which was in good agreement with values measured by ETAAS in Kiel: 3.55 ± 0.08 nmol L−1. The detection limit (3σ of the blank) for the Mn flow injection system used here was estimated in the lab in Kiel by repeated measurements of low Mn Antarctic sea-water (< 0.2 nmol L−1; collected during ANTXXIV-3) at 150 pmol L−1. The use of a low Mn or Mn free seawater is preferred to running MQ blanks, as both in Corsica and in Kiel we found that there was detectable Mn in the MQ systems due to problems with the ion-exchange units of the systems.
A few samples of Mn, as a comparison to the di-rect analysis in Corsica (FIA), were analyzed by graphite furnace atomic absorption (ETAAS, Perkin-Elmer Model 4100ZL) in the clean laboratory in Kiel using solvent ex-traction modified after Klinkhammer (1980). Briefly, 200 g of filtered and acidified seawater were extracted with 8-hydroxychinoline in distilled chloroform as Mn-oxinates,
back-extracted with 3 mol L−1 distilled HNO
3 and then
analyzed with ETAAS. SAFe reference seawater D1 was determined as 0.423 ± 0.05 nmol L−1 (consensus value
(0.35 ± 0.06 nmol L−1); these Mn values for the validation are given in the supplementary information.
2.2.3 Dissolved iron and Fe binding ligand analysis
Fe concentrations were analyzed at Laboratoire d’Oc´eanographie de Villefranche-sur-Mer between 4 and 10 months after the experiment. A flow injection system with online preconcentration and chemiluminescence detec-tion was used as described in Bonnet and Guieu (2006). The detection limit (DL) was 25 pmol L−1on average and blanks were between 50 and 150 pmol L−1. An internal acidified seawater standard was measured in order to control the stability of the analysis during each series of measurements. The reliability of the method was controlled by analyzing the D2 SAFe seawater standard (Johnson et al., 2007), which was determined as 0.84 ± 0.04 nmol L−1 of Fe (n = 5) (consensus value is 0.90 ± 0.02 nmol L−1).
The concentration of Fe complexing ligands, [L] was de-termined by cathodic stripping voltammetry using the com-petitive ligand 2-(2-thiazolyazo-)-p-cresol (TAC) (Croot and Johansson, 2000) at Institut M´editerran´een d’Oc´eanologie, Marseille (France) 18 months after the experiment. After thawing of the samples, [L] complexing ligands were de-termined following the exact same protocol as described in Wagener et al. (2008). A µ-Autolab voltammeter coupled to a Metrohm VA663 electrode stand with a static mercury drop working electrode, a double junction Ag/AgCl refer-ence electrode and carbon rod counter electrode was used. The titration data were calculated using a single ligand fit with the van den Berg/Ruzic linearization method (see, for example, Croot and Johannsson, 2000).
2.2.4 Dissolved aluminum analysis
The aluminum analysis was conducted at GEOMAR, Kiel, a few months after the experiment using the fluorometric method described by Hydes and Liss (1976). In short, the reagent lumogallion was added to the sample, which was then buffered to pH 5 with ammonium-acetate, and heated to 40–50◦C for 3 h to accelerate complex formation. The fluorescence of the sample was measured with a Hitachi FL 2700 Fluorescence Spectrophotometer (excitation wave-length 497 nm, emission wavewave-length 572 nm). The detection limit varied between 0.1 and 0.3 nmol L−1, the blank values
between 0.4 and 0.6 nmol L−1for the different days of anal-ysis. In the SAFe reference seawater S1 (S1 543, S1 474), 1.81 ± 0.24 nmol L−1 of Al (n = 4) were determined (con-sensus value is 1.74 ± 0.09 nmol L−1).
3 Results
The complete set of data is available as supplementary infor-mation to this paper.
The nomenclature for samples of the DUNE-2 experiment is as follows: dust seeded mesocosms D1, D2 and D3; un-seeded control mesocosms C1, C2 and C3; and the sampling outside the mesocosms. Samples were taken at 0.1, 2.5, 5.0, 7.5, 10.0 and 12.5 m depth. The time tx is expressed in hours (x) since the first dust addition and in parentheses tx(y) the time (in h) since the second dust addition. The samples out-side the mesocosms were taken as an external reference point to the control mesocosms and the concentrations are not re-ported in the figures, but are available in the supplementary information.
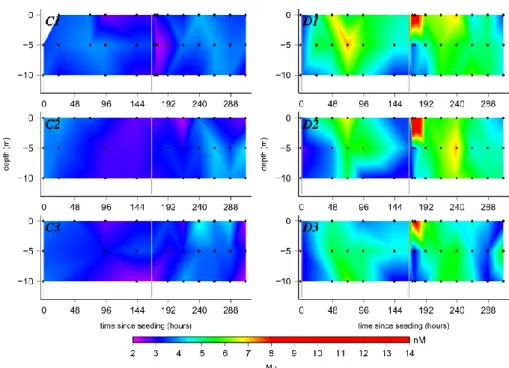
3.1 Evolution of dissolved manganese (Mn)
Figure 1 shows the evolution of the concentration of Mn as a function of time after the first seeding and depth in each of the mesocosms. The initial Mn concentrations outside, in the control and dust seeded mesocosms were 3.4 ± 0.6 nmol L−1. Directly on the first day (t23) after the first dust addition, the Mn concentrations increased to 4.9 ± 0.4 nmol L−1in the surface and at mid-depth (D1 and D2). D3 was not sampled at t23 after the first addition. At t48 the same trend as in D1 and D2 was seen with a continua-tion of the increase in Mn which was most pronounced in the surface. After the continuous increase since the first seeding with dust, at t71 Mn reached its maximum in all three dust seeded mesocosms and in D1 at 5 m depth the concentra-tion was as elevated as 7.2 nmol L−1. After this initial
eleva-tion of Mn, overall the concentraeleva-tion then decreased slowly in all three dust seeded mesocosms with time down to 3.0– 4.6 nmol L−1after a week. These values were in the range of the values before the first seeding.
After the second dust addition to the surface of the dust seeded mesocosms, the increase in Mn was more pronounced than after the first addition. Concentrations of Mn in the surface (0.1 m) in the first few hours after the second seed-ing increased strongly, especially in D2 to 13.2 nmol L−1at t171(5) and 11 nmol L−1at t175(9). In these first 24 h after the second dust addition the concentrations of Mn at 5 m and 10 m remained constant at 3.2 to 4.4 nmol L−1. While the values in the surface decreased slowly after the first strong pulse following the second addition, the Mn values increased at 5 m at t191(24) and even more at t215(49). At all depths the Mn concentrations in the dust seeded meso-cosms decreased again with time down to 3–5 nmol L−1after t287(121) (with the exception of D3 10 m with a Mn concen-tration of 5.7 nmol L−1).
Fig. 1. Evolution of dissolved manganese (Mn) in the 6 mesocosms (left hand side – control mesocosms: C1, C2 and C3; right hand side –
dust seeded mesocosms: D1, D2 and D3). The graphs are plotted as the time since the first seeding (h) versus the depth (m) in the mesocosms. Black dots show the points were samples were taken. The two grey vertical bars highlight the time points when the seeding took place (t0 and t166(0)).
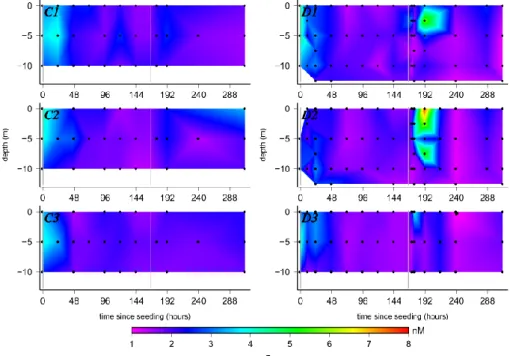
3.2 Evolution of dissolved iron concentration (Fe) and Fe binding ligands (L)
In Fig. 2, the evolution of Fe values in the control and dust seeded mesocosms are shown. The initial Fe values before the dust addition varied between 2.2 and 4.4 nmol L−1 in-side the mesocosms and outin-side (values available in the sup-plementary information). After the first addition of dust at t10, there was a direct decrease in the Fe concentrations to 2.5–2.9 nmol L−1 in the surface of the dust seeded meso-cosms and values as low as 1.5 nmol L−1 were measured in D2 and D3. At t23 the values inside the control meso-cosms still ranged from 3.0 to 3.5 nmol L−1. With more time elapsing, this decrease in the Fe concentrations continued in the dust seeded mesocosms but also occurred in the control mesocosms and outside. After t143 the Fe values in the con-trol mesocosms varied from 1.4–2.1 nmol L−1and in the dust seeded mesocosms from 1.6–2.0 nmol L−1.
After the second dust addition, a significant increase in Fe was observed in the dust seeded mesocosms, whereas Fe val-ues remained constant in control mesocosms. Directly after this addition there was a strong increase in the surface with a maximum at t191(25). In D1 and D2, the Fe concentration increased up to 6.1 nmol L−1at 2.5 m and up to 3.8 nmol L−1 in the surface of D3. In the first 24 h after the second addi-tion the Fe values had increased in all the dust seeded meso-cosms. However, after t215(49), the Fe concentrations
de-creased quickly again down to 1.0–1.8 nmol L−1. This range remained the same until the end of the experiment.
Fe complexing ligands in the dissolved phase [L0] were measured on a limited subset of samples collected at 5 m depth. The evolution of the arithmetical means [L’] for the dust seeded and the control mesocosms is presented in Fig. 3. Before and after the first seeding, ligands were close to sat-uration or over-saturated, i.e. ([L]+[FeL) < total dissolved Fe, with values ranging from 1.3 to 3.3 nmol L−1at t0–t143. In the control mesocosms the values remained in this range for the whole experiment. The saturation and over-saturation made a full analysis of the ligand complexation parameters complicated as the ambient system was already over titrated. This situation indicated a limited capacity to take up more Fe in the dissolved phase and a potential for greater scavenging rates as increases in dissolved Fe can only be achieved by processes that do not impact the ligand concentration. This is because as the soluble and colloidal ligand pools are sat-urated, and the inorganic solubility is also maximized, any more Fe that dissolves will lead to Fe being incorporated into existing colloidal aggregates or onto particles. However, af-ter the second dust addition, the ligand concentration rose significantly in the dust seeded samples with values reaching 6.8 nmol L−1at t191(25), indicating a higher complexing ca-pacity for Fe. At t239(73) and t311(145) the values decreased to 5.2–5.3 nmol L−1.
Fig. 2. Evolution of dissolved iron (Fe) in the 6 mesocosms. This graph is plotted in the same way as Fig. 1.
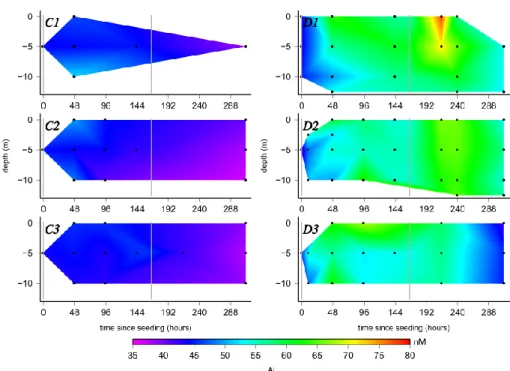
3.3 Evolution of dissolved aluminum (Al)
The evolution of the concentrations of Al is displayed in Fig. 4. In all three control mesocosms, similar features were observed: the values decreased nearly linearly with time over the two weeks of the experiments, from 44 nmol L−1 to 38 nmol L−1. Values from outside the mesocosms were in the same range as those in the control mesocosms.
In the dust seeded mesocosms, directly after the first ad-dition of dust at t10, the surface Al values increased to 54 nmol L−1 and the rest of the water column was also el-evated (48–50 nmol L−1). The increase continued
through-out the dust seeded mesocosms (50–56 nmol L−1), but most
distinctive in the surface with concentrations up to 60– 63 nmol L−1at t47. At the end of the first dust addition the Al concentrations were constant in all dust seeded mesocosms at approximately 55 nmol L−1.
After the second dust addition the Al concentrations in-creased by approximately 10 nmol L−1 (t215(49)), for ex-ample up to 78 nmol L−1 in the surface in D1. At t239(73), the minimum value was 58 nmol L−1and the maximum was reached with 66 nmol L−1 at several depths. At the end of the experiment, the values decreased to 53 nmol L−1in D1 and 55–60 nmol L−1in D2. In D3, a similar decrease with time could be observed, but the initial increase after the sec-ond addition was smaller compared to D1 and D2. At the end of the experiment (t311(145)), the values dropped to 42– 46 nmol L−1. 0 2 4 6 8 L (nM) 0 24 48 72 96 120 144 168 192 216 240 264 288 312 Time since seeding (hours)
0 2 4 6 8 Fe (nM) 0 24 48 72 96 120 144 168 192 216 240 264 288 312 Time since seeding (hours)
DUST Fe DUST L
CONTROL Fe CONTROL L
Fig. 3. Evolution of the arithmetical means of the iron binding
lig-and (L) concentrations (nmol L−1)of the dust seeded mesocosms (red circles) and the control mesocosms (blue squares) at 5 m depth with time since the seeding. The evolution of the arithmetical means of the dissolved iron (Fe) concentrations (nmol L−1) of the dust seeded mesocosms (red empty circles) and the control mesocosms (blue empty squares) at 5 m depth with time since the seeding.
4 Discussion
4.1 Trace metal concentrations at the DUNE site
All the total dissolved trace metal concentrations measured at the DUNE sampling site before the seeding are representa-tive for the western Mediterranean basin (Boyle et al., 1985; Copin-Montegut et al., 1986; Kremling and Petersen, 1981; Morley et al., 1997; Sherrell and Boyle, 1988; Yoon et al., 1999). The average values of the total dissolved trace metal concentrations (± standard deviation) before the addition of
Fig. 4. The evolution of dissolved aluminum (Al) in the 6 mesocosms. This graph is plotted in the same way as Fig. 1.
dust at 5 m depths at the DUNE site are given in Table 1. For all the trace metals measured during DUNE-2, no signif-icant differences could be observed between the initial val-ues inside and outside the mesocosms. This indicates that the deployment protocol of the mesocosms, developed for the DUNE experiment (Guieu et al., 2010), does not contami-nate the water column trapped inside for the trace element measured in this study. The concentrations are given as sup-plementary information and will not be discussed here any further. This is in agreement with the results obtained for Fe during DUNE-1 (Wagener et al., 2010).
Sherrell and Boyle (1988) report a limited set of data for total and dissolved Fe in the western Mediterranean. They found maximal values in the core of the Atlantic inflow jet to the Mediterranean in the Strait of Gibraltar of 53.0 nmol kg−1 total Fe, with dissolved Fe making up only 30 % of this value, indicating a high particulate load. Outside this plume of Fe, total surface concentrations were around 5 nmol kg−1. The
range of reported Fe concentrations is similar to those previ-ously published for the western Mediterranean basin (Bon-net and Guieu, 2004; Sarthou and Jeandel, 2001; van den Berg, 1995). However, the initial Fe values in the mesocosms were in the higher range of reported data for the open wa-ters of the western Mediterranean Sea, but similar coastal Fe concentrations were determined in the Bay of Villefranche at different times of the year (Bressac and Guieu, 2013). A study by Statham et al. (1985) of Mn concentrations in the Mediterranean also showed a surface enrichment up to 4.19 nmol L−1. Our observed Al concentrations are in the same range as previously reported surface values of about
56 nmol L−1close to our study site off the coast of Corsica in 1977 (Caschetto and Wollast, 1979). Similar Al concentra-tions have also been observed in the western Mediterranean basin (Chou and Wollast, 1997; Hydes et al., 1988; van den Berg et al., 1994).
4.2 Changes in trace metal inventories: dissolution and scavenging after the seeding
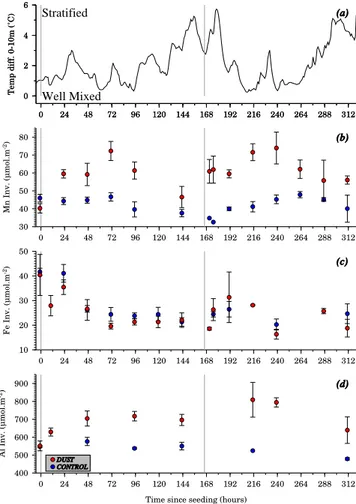
The temperatures measured at four depths (0, 3, 6 and 10 m) inside and outside the mesocosms are the only available physical continuously monitored parameters measured dur-ing the entire experiment. In Fig. 5a, the calculated temper-ature difference between the surface and the bottom of the mesocosm is plotted (0–10 m). The temperature difference between 0 and 10 m measured inside the mesocosm is there-fore used as an indicator for mixing or thermal stratification in the mesocosm in order to discuss the changes in the inven-tories within the mesocosms. If there was little or no temper-ature difference between 0 and 10 m, we interpreted this as an indication that the water column in the mesocosm was well-mixed. The more significant the temperature difference, the more likely the mesocosm was stratified. The main feature this proxy provides is that the course of the experiment can be separated into four periods. A relatively well-mixed meso-cosm during the first four days (t96) of the experiment, fol-lowed by a stratification of the water column (t96–t180). The second addition of dust therefore occurred in a more strati-fied water column than the first one. After t180 the water col-umn was mixed again until t240 when a new stratification fol-lowed until the end of the experiment (Bressac et al., 2013).
Table 1. Trace metal concentrations before the start of the
experi-ment.
Concentration Concentration (nmol L−1) (nmol L−1) inside the outside the mesocosmsc mesocosmsd Al (FIA) 43.8 ± 1.4 36.97a Cd (ETAAS)e 0.052 ± 0.007 0.05b Co (ETAAS)e 0.099 ± 0.007 0.12b Cu (ETAAS)e 1.83 ± 0.30 1.42b Fe (FIA) 3.78 ± 0.67 4.44 Mn (FIA) 3.36 ± 0.37 3.50 Ni (ETAAS)e 3.47 ± 0.40 3.34b Pb (ETAAS)e 0.104 ± 0.017 0.09b Zn (ETAAS)e 2.14 ± 0.67 1.01b aThis value was measured at t47 after the start of the experiment. bThese values were measured at t143(−23) after the start of the experiment.cThe errors presented with the mean values in this table correspond to the standard deviation (1σ ) calculated on the values at 5 m in the 6 mesocosms directly after their deployment. dWe only had one reference point outside the mesocosms and therefore cannot give an error for the outside concentrations.eThe graphite furnace atomic absorption method (ETAAS) for the dissolved trace metal concentrations (cadmium (Cd), cobalt (Co), copper (Cu), nickel (Ni), lead (Pb) and zinc (Zn)) is described in the supplementary information (Grasshoff et al., 1983; Danielsson et al., 1978).
Mesocosms are closed systems without lateral advection. Therefore, after the addition of dust, its effect on the cycling of trace metals can be completely assessed by using invento-ries over the water column of the mesocosms. For this rea-son the inventories were calculated for all three trace met-als for each 5 m depth layer (0–5 m and 5–10 m). The final conical section of the mesocosms was neglected. The few missing values were interpolated if necessary by using the average values between two depths, or the values at the ex-tremes (surface and bottom). The inventories for the 5 m in-crements were then added up as an inventory for the corre-sponding mesocosm at the correcorre-sponding time point tx. Fig-ure 5 shows the evolution of the Mn (B), Fe (C) and Al (D) inventories as a function of the time since the addition of dust. The plotted inventories were calculated as arithmeti-cal means for the control and the dust seeded mesocosms. For all three elements (Fe, Al and Mn), the inventories in the dust seeded and control mesocosms were equivalent be-fore the start of the experiment. The Mn and Al dust seeded inventories were always higher than the Mn and Al control inventories, which remained constant or decreased slightly throughout the whole experiment, whereas the inventories in the dust seeded mesocosms showed a remarkable increase during t47–t73 after both the seedings, followed by a de-crease in the inventories in the following days. Fe inventories showed a different trend with a distinct quicker and stronger decrease in the dust seeded compared to the control meso-cosms after the first dust seeding. This decrease until t73 was
400 500 600 700 800 900 Al Inv. (µmol.m -2) 0 24 48 72 96 120 144 168 192 216 240 264 288 312 Time since seeding (hours)
CONTROL (d) DUST 10 20 30 40 50 Fe Inv. (µmol.m -2) 0 24 48 72 96 120 144 168 192 216 240 264 288 312 (c) 30 40 50 60 70 80 Mn Inv. (µmol.m -2) 0 24 48 72 96 120 144 168 192 216 240 264 288 312 (b) 0 2 4 6 Temp diff. 0-10m (˚C) 0 24 48 72 96 120 144 168 192 216 240 264 288 312 0 2 4 6 Temp diff. 0-10m (˚C) 0 24 48 72 96 120 144 168 192 216 240 264 288 312 Well Mixed Stratified (a)
Fig. 5. Evolution of the temperature difference (0–10 m) (a) and
the arithmetical means of the dissolved trace metal inventories (µmol m−2) (Mn (b), Fe (c) and Al (d) from top to bottom) of the dust seeded mesocosms (red circles) and the control mesocosms (blue circles).
followed by constant inventories during the rest of the ex-periment. Only a very transient, but strong increase could be observed in the dust seeded mesocosms one day after the sec-ond addition of dust (t191(25)).
Based on these inventory calculations, changes are dis-cussed (1) in terms of absolute inventories based on estima-tions of trace metal solubilities from dust particles and (2) in terms of relative changes of the inventories based on estima-tions of dissolution and loss rates of the three elements.
4.2.1 Estimation of dissolution during the mesocosm experiment
The fractional solubility (FracSol %) of an element from the dissolution of dust particles in seawater (Baker and Croot, 2010) is typically expressed as the percentage of the soluble element compared to the total element in the dust particle. This percentage allows an estimation of the impact of the at-mospheric particle flux on the dissolved (and bioavailable)
stock in the ocean (Landing and Paytan, 2010). In recent years, two major experimental protocols have been used to assess the solubility of collected dust particles in seawater: flow through protocols (e.g. Buck et al., 2006) and batch ex-periments (e.g. Bonnet and Guieu, 2004). As discussed in Wagener et al. (2010), mesocosms allow us to estimate sol-ubility from dust particles in a somewhat in situ way: the settling of the particles through the water column and inter-actions with naturally occurring particles are both integrated in this approach. However, two main limitations are inher-ent to this approach: (1) the dust addition is based on arti-ficially produced dust particles which might not completely reproduce natural particles and (2) the results obtained are only relevant for the area where the mesocosms have been deployed. For a given element at a given time, the fractional solubility is the ratio between the increase in the dissolved metal concentrations ([M]) due to dust dissolution in seawa-ter (in this case integrated over the entire mesocosm) and the total amount of this element introduced with the dust parti-cles (6MDust)– as indicated below.
Here, the solubility of each element from the added dust is estimated at the time point (t) when the inventory of this dis-solved element in the mesocosms is at its maximum after the dust addition. In the present work we utilized Eq. (1) (below) for the phase of the first dust addition, in which the amount of the dissolved element introduced by the dust is estimated as the difference between the inventories in the dust seeded mesocosms (DM) and the control mesocosms (CM). The to-tal amount of the element introduced by dust is estimated from the amount of dust introduced to the mesocosm and its elemental composition (K. Desboeufs, personal communica-tion, 2013). It is assumed here that no dust was lost when it was sprayed at the surface of the mesocosm (see Sect. 2.1.):
FracSol (%) = max ( A 0 R z [M]DM∂z t − 0 R z [M]CM∂z t !) 6MDust (1)
Case 1: first addition
Where A is the surface area of the mesocosm and as-suming it is a perfect cylinder, t represents the time since the first dust addition.
It is important to notice that in the case of this experiment, using the difference of the inventories between dust seeded and control mesocosms to estimate the dissolved amount al-lows us to take into consideration the ongoing changes in the dissolved concentrations observed in the control mesocosms during the experiment. The inventory changes for the dis-solved metals in the control mesocosms are independent of the added dust and must therefore not be taken into account in the solubility calculation. This is an important difference with classical abiotic batch protocols where the amount of dissolved element is estimated from the difference in
concen-tration before and after the dust addition. However, in order to estimate FracSol % induced by the second dust addition only, the amount of the dissolved element introduced needs to be calculated by comparison with the inventories in the dust mesocosms (DM) immediately prior to the second seed-ing (t143(−23)) and we therefore utilized Eq. (2) for the sec-ond seeding. An estimation of FracSol % based on Eq. (1) for the second dust addition would cumulate the effect of the two additions. Values of fractional solubility are reported in Table 2. FracSol (%) = max ( A 0 R z [M]DM∂z t − 0 R z [M]DM∂z t143 !) 6MDust (2)
Case 2: second addition
The fractional solubility for Al after the first and sec-ond dust addition was, respectively, 1.44 ± 0.19 % and 0.91 ± 0.83 %. There is no significant difference between these additions and the high variability for the second addi-tion, which is due to the much lower values for Al observed in D3. In this mesocosm, significantly higher concentrations of bacteria were also observed, indicating that some other processes were occurring in this mesocosm compared to D1 and D2. Our data are consistent with results from Measures et al. (2010) who measured fractional Al solubilities of 0.087 to 14.3 % (average 4.6 %) in seawater with Hawaiian aerosol samples. For Saharan dust, fractional Al solubilities of 1.9– 5.5 % in pH 4.7 solutions have been published by Baker et al. (2006), so our data are consistent with these results given the higher pH in seawater. For Mn, the fractional solubili-ties are higher, but after both dust additions in the same or-der of magnitude with values of 41 ± 9 and 27 ± 19 %. Re-cently, Mendez et al. (2010) reported values of 12 to 14 % for Saharan dust in laboratory experiments with seawater, while Baker et al. (2006) reported values of 50–64 % in pH 4.7 so-lutions. Earlier, Guieu et al. (1994) have shown fractional Mn solubilities of 30–35 % in pH 7 solutions. Values obtained with the “mesocosm” method are thus comparable to other experimental setups.
During the DUNE-1 experiment no dissolution from the dust particles was observed for Fe and therefore no value for the fractional solubility of Fe was obtainable (Wagener et al., 2010). Here, during DUNE-2, the same result was obtained after the first seeding, but a fractional solubility of 0.12 ± 0.03% was estimated after the second addition of dust. The reasons for this change in the amount of the dis-solved element introduced by the dust and the induced frac-tional solubility are discussed in Sect. 4.4. Literature values for fractional Fe solubility range over more than three or-ders of magnitude (Baker and Croot, 2010; Sholkovitz et al., 2012) with large differences depending on atmospheric and
Table 2. Estimation of the elemental relative dissolution of dust in seawater.
Mn Fe Al
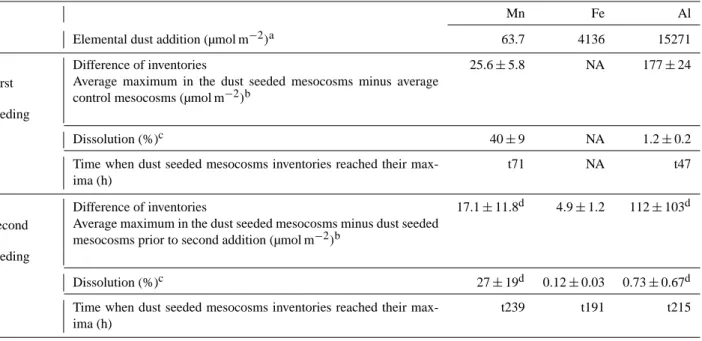
Elemental dust addition (µmol m−2)a 63.7 4136 15271
First
Difference of inventories
Average maximum in the dust seeded mesocosms minus average control mesocosms (µmol m−2)b
25.6 ± 5.8 NA 177 ± 24
seeding
Dissolution (%)c 40 ± 9 NA 1.2 ± 0.2
Time when dust seeded mesocosms inventories reached their max-ima (h)
t71 NA t47
Second
Difference of inventories
Average maximum in the dust seeded mesocosms minus dust seeded mesocosms prior to second addition (µmol m−2)b
17.1 ± 11.8d 4.9 ± 1.2 112 ± 103d
seeding
Dissolution (%)c 27 ± 19d 0.12 ± 0.03 0.73 ± 0.67d
Time when dust seeded mesocosms inventories reached their max-ima (h)
t239 t191 t215
aEstimation based on the addition of 10 g m−2of dust with an elemental composition of Mn = 0.0342 %, Fe = 2.26 % and Al = 3.32 % (Desboeufs, personal
communication, 2013).bEstimated with mean values for control and dust seeded mesocosms.cEstimated as the ratio between the difference of inventories and the amount of element added with dust.dHigh variability here related to differences in D3, also seen in bacterial numbers and phytoplankton abundance.
marine processes as well as on the experimental design used. In summary, based on a much more realistic protocol than the commonly used laboratory protocols, the fractional solu-bility of Mn and the fractional solusolu-bility of Al in dust are in the range of previously published values. This overall gives more confidence in consensus ranges for fractional Al and Mn solubility from dust. For Fe, the complex processes that control the fractional solubility are clearly shown here, and indicate that the use of a single absolute value for the frac-tional solubility of Fe is not realistic.
4.2.2 Dissolution and loss rates
The rates of the decreases or increases in the inventories were quantified by estimating loss and dissolution rates. These es-timated rates for Mn, Al and Fe are reported in Table 3.
An overall trend, observed for the three dissolved trace metals, was a general decrease in the inventories in the con-trol mesocosms with low loss rates. This could correspond to scavenging onto particles, which is a common physical-chemical process occurring in the ocean for trace metals (Turekian, 1977). The loss rate was well defined for Al, which is not known to have a bioactive role, whereas some variations over the general decreasing trend were observed for Fe and Mn. This might be due to changes in biological utilization in response to the changes in stratification in the mesocosms.
In the dust seeded mesocosms, the inventories of Mn and Al increased with apparent dissolution rates which were quite similar for both dust additions. It is interesting to note that,
even if the dust additions occurred under different stratifica-tion condistratifica-tions (Fig. 5a), the increase in the inventories and the dissolution rates were the same when integrated over the entire mesocosm. However, Fig. 1 clearly shows that the in-crease in Mn concentrations was occurring throughout the whole water column for the first compared to the second seeding, in which the increase was concentrated in the first few meters of the mesocosms. This implies that the overall rate of dissolution and fractional solubility was apparently not affected by the vertical mixing of the water column, but that mixing diluted the maximal concentration observed for the dissolved elements. This has important implications, il-lustrating that the sampling resolution can impact the assess-ment of the influence of dust addition. For example, the de-termination of vertical gradients, using finer spatial sampling resolution within the mesocosms, helps better define the pro-cesses occurring.
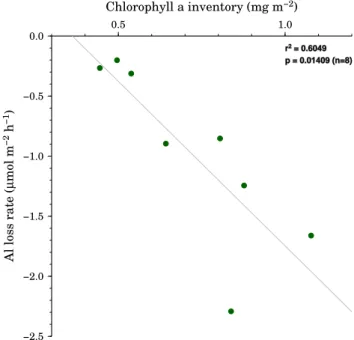
The loss rates of Al and Mn behaved differently. Mn showed quite equivalent loss rates for the first and the sec-ond seeding, whereas the Al loss rate was approximately one order of magnitude higher after the second seeding (−1.9 µmol m−2d−1) in comparison to after the first one (−0.07 µmol m−2d−1). Scavenging of Al is sensitive to the amount of biogenic particles in seawater (Moran and Moore, 1988). During DUNE-2, an increase of chlorophyll a in the dust seeded mesocosms is reported by Giovagnetti et al. (2012), suggesting an increase of biomass, which could explain the observed significant change in the loss rates for Al. Correlations of leachable Al and chlorophyll a were also previously observed by Moran and Moore (1988), suggesting
Table 3. Mn, Fe and Al dissolution and loss rates in µmol m−2d−1(±1σ ). They were calculated as the increase/decline of each metal in each of the dust seeded mesocosms by applying a linear regression to the inventory as a function of time. For the dissolution rates the calculation was started at the point before each of the seedings until the point in time when the concentration reached its maximum. For the loss rates the calculation was started at the point after each of the seedings when the concentration was the highest.
dissolved seeding Dissolution Time intervals loss rate Time intervals
trace rates (h) used [µmol m−2d−1] (h) used
metal (µmol m−2d−1) Mn 1 0.43 ± 0.09 t0–t71 −0.35 ± 0.04 t71–t143 Mn 2 0.27 ± 0.05 t143(−23)–t239(73) −0.25 ± 0.08 t239(73)–t311(145) Control −0.006 ± 0.013 t0–t311(145) Fe 1 NA NA NA NA Fe 2 0.67 ± 0.15 t171(5)–t191(25) NA NA Control NA NA -0.01 ± 0.01 t47– t311(145) Al 1 2.8 ± 1.3 t0–t47 −0.07 ± 0.17 t47 – t143 Al 2 1, 1 t143(−23)–t215(49) −1.9 ± 0.3 t215(49)–t311(145) Control −0.24 ± 0.07 t0–t311(145)
a link between scavenging of Al and chlorophyll a. During DUNE-2 we also observed a similar correlation (Fig. 6) us-ing the chlorophyll a inventory (Giovagnetti et al., 2012). Figure 6 shows an increase of the chlorophyll a inventory related to an increase of the Al loss rate. Previous studies in the vicinity of Corsica have shown that Al is strongly covari-ant with silicate (Mackenzie et al., 1978), suggesting removal of dissolved Al by incorporation in diatoms with subse-quent remineralization at depth. In the present case, however, non-siliceous pico-plankton (Synechococcus and Prochloro-coccus) and nano-plankton (Haptophytes and Chlorophytes) showed the major response to the dust additions, particularly after the second addition (Giovagnetti et al., 2012). There-fore, it appears that the loss of dissolved Al was related to adsorption into organic matter on these cells and not incor-poration into biogenic silica. Stratification after the second dust addition may have accentuated this Al removal at this time, as higher concentrations of cyanobacteria and hapto-phytes were also observed at this time in the surface waters (Giovagnetti et al., 2012).
In the case of Mn, there was no appreciable difference in the loss rate after the first and second additions of dust, suggesting that the loss of Mn was not affected by up-take or adsorption into phytoplankton. Scavenging of Mn by particles requires the oxidation of Mn(II) prior to parti-cle loss, as Mn(II) is only weakly complexed or adsorbed to particles (Yeats and Strain, 1990; Sunda and Huntsman, 1987). Abiotic oxidation of Mn(II) is normally considered to be too slow to account for the adsorbed loss rates and instead it is believed that bacterial oxidation is the major pathway in the ocean (Morgan, 2005; von Langen et al., 1997). During this experiment bacterial numbers were rela-tively constant throughout the experiment in all mesocosms, suggesting that the Mn oxidation rate was relatively constant (Pulido-Villena et al., 2013). The dissolved Mn loss rates ob-served here are equivalent to 6.5–10.8 % d−1of the dissolved
Mn pool, which is significantly above the range of rates (0.2– 1.5 % d−1)observed in oligotrophic regions (Moffett, 1997)
but similar to that seen in coastal regions (Sunda and Hunts-man, 1987). Thus, the turnover time of the Mn pool was about 10 to 16 days in the dust amended mesocosms. The slower turnover of Mn in the control mesocosms presumably indicates that Mn oxidation by bacteria may have been lim-ited by another substrate, in this case presumably suitable organic carbon sources. Our rates are also integrated over the whole day and it is also likely that a diel cycle in Mn ox-idation was occurring due to photo-reduction of MnO2 via
reaction with humics or photo-produced H2O2, and
poten-tial photo-inhibition of Mn oxidizing bacteria, as it has been observed in coastal waters and the Sargasso Sea (Sunda and Huntsman, 1988, 1990). Thus, it is likely that Mn oxidation rates were maximal at night.
Changes in the Fe inventories were complex with regard to the dust addition. In the first day (t0–t23), the loss rate in the dust seeded mesocosms was −45.5 µmol m−2d−1, whereas it was slightly positive in that time frame in the control meso-cosms. The control inventories only started to decrease af-ter t23. The loss rate in the dust seeded mesocosms on the first day was comparable to the one reported for DUNE-1. This might demonstrate an assimilable scavenging onto dust particles, which had been demonstrated for DUNE-1 (Wa-gener et al., 2010). Until t72, an overall sharp decrease in the loss rates was observed in both the control and the dust seeded mesocosms. This decrease had not been observed in the control mesocosms during DUNE-1. A plausible reason for this decrease could be adsorption onto the mesocosms’ plastic walls, by which the walls were not in equilibrium with the seawater initially during DUNE-2. It has been demon-strated in bottle experiments (e.g. Fischer et al., 2007), that this could represent up to 50 % of Fe in bottles. But, as the surface to volume ratio is much lower for large mesocosms,
wall adsorption cannot explain entirely the Fe loss in the con-trol mesocosms.
After the second addition, a transient dissolution of Fe was observed within the first day (t166(0)–t191(25)) with a dis-solution rate of 0.67 ± 0.15 µmol m−2d−1, which was higher than the loss rate observed after the first seeding. In the ear-lier DUNE-1 experiment, Wagener et al. (2010) estimated a maximal biological uptake of Fe in the mesocosms of 0.5 to 1.0 µmol m−2d−1for the productive conditions encountered during this experiment. During DUNE-2, the productive con-ditions were in the same order of magnitude compared to DUNE-1 in terms of autotrophic and heterotrophic organ-isms. We therefore postulate that dissolution from dust parti-cles could therefore sustain biological activity in terms of re-lieving any potential Fe limitation. This transient dissolution observed after the second addition corresponds with a signif-icant increase in Fe binding ligands in the dust seeded meso-cosms in comparison to the control mesomeso-cosms (Fig. 3). The ligand concentration increased about 5 nmol L−1between the mean concentrations measured at t95 before the second dust addition and the mean concentrations measured at t191(25) after the second dust addition. This increase of the Fe bind-ing capacity is compatible with the transient increase in Fe concentration, with values up to 7.64 nmol L−1 observed at t191(25) in the surface of D2. In any case, the observed ex-cess of ligands would have helped to maintain Fe in solu-tion and drive the observed transient dissolusolu-tion on addi-tion of the dust. A similar occurrence was also seen during SOIREE, Southern Ocean Fe enrichment, where Fe binding ligand concentrations increased after successive Fe additions, leading to an increase in the retention of Fe in the water col-umn (Croot et al., 2001).
4.3 Insights into the time scales and possible mechanisms of dissolution and scavenging processes during a dust event
Our unique dataset allows a first order look at the scavenging mechanisms following atmospheric deposition events. Pre-vious work on this has been done over much larger tempo-ral (week to month) and vertical (hundreds of meters) scales through the use of sediment traps (Brust et al., 2011; Brust and Waniek, 2010). The DUNE-2 experiment is unique in the sense that optical measurements in the water column were made simultaneously, allowing an assessment of the particle residence time. This particulate export was controlled partly by the formation of organic–mineral aggregates (Bressac et al., 2012). The mass of material exported into the sediment traps (collected every 24 h) was the highest at t48. At the end of the first seeding experiment, the optical parameters were homogenous from 0 to 10 m depth, but still slightly higher than before the first addition of dust (Bressac et al., 2012). During the second part of the DUNE-2 experiment, optical measurements were also performed in order to follow the particle dynamics (Bressac et al., 2013). These optical
−2.5 −2.0 −1.5 −1.0 −0.5 0.0 Al loss rate ( µ mol m −2 h −1 ) 0.5 1.0 Chlorophyll a inventory (mg m−2) r2 = 0.6049 p = 0.01409 (n=8)
Fig. 6. Correlation of Al loss rate vs. the chlorophyll a inventory.
measurements revealed an accumulation of particles in the upper 2.5 m layer directly following the second dust addi-tion, likely due to the stratification of the water column (Fig. 5a). This particle maximum was apparently partly due to in-creases in phytoplankton abundance triggered by the second dust addition (Giovagnetti et al., 2012). This longer residence time of particles in the subsurface could explain the high Fe dissolution observed after the second addition of dust. How-ever, the mass of material exported into the sediment traps was the highest at t191(25). Indeed, the mixing of the water column occurred between t179(13) (maximum of the tem-perature difference (0–10 m)) and t215(49) (Fig. 5a). Simul-taneously, a sudden decrease of the beam attenuation in the subsurface was observed between t176(8) and t191(25), re-vealing the activation of the particulate export (Bressac et al., 2013). The optical measurements indicate that part of the Saharan dust was rapidly lost from the mixed layer (esti-mated sinking rates ∼ 24–86 m d−1). As reported above, af-ter the first seeding with dust, part of the Saharan dust pool was rapidly exported. The physical characteristics of the wa-ter column differed widely between both dust addition ex-periments. This difference in physical conditions, especially marked during the first hours after the seedings, likely im-pacted the particulate export dynamics and could partly ex-plain the differences observed in the kinetic dissolution be-tween the two additions of dust. These findings are impor-tant in the present context as they represent the removal of particulates and the adsorbed or scavenged metals they con-tain. Our observations are consistent with field studies from the Atlantic Ocean which have shown that the residence time of Fe in surface waters is strongly influenced by Saharan
dust deposition (Croot et al., 2004), while that of Mn and Al are much less so (Jickells et al., 1994; Jickells, 1999). In the case of Fe in the surface waters, Croot et al. (2004) showed that the fractional mean residence time was short-ened with increasing Saharan dust fluxes. Earlier laboratory studies have shown that scavenging and export are controlled by the formation of organic–mineral aggregates (Balistrieri et al., 1981; Hunter, 1983), with scavenging related to par-ticle concentration (Honeyman et al., 1988). For parpar-ticle re-active elements, e.g. Fe, the transfer of colloidal to particu-late phases (colloidal pumping) is also important (Honeyman and Santschi, 1991). Combining the optical data with the dis-solved trace metal data suggests that the larger dust particles sunk out quickly (Bressac et al., 2013) but played a small role in scavenging both Mn and Al from the water column, as release processes dominated at that time. Thus, scaveng-ing by smaller particles (dust and phytoplankton/bacteria) appears to be the more important removal term over the du-ration of the experiment. In particular, the production of or-ganic material by bacteria and phytoplankton would lead to increased formation of organic–mineral aggregates and lead to increased scavenging.
4.4 Effect of two successive dust additions on the biogeochemistry of trace metals
During the DUNE-1-P experiment, batch reactor dissolution experiments of dust performed with filtered seawater col-lected in the dust seeded and the control mesocosms have shown that the solubility of Fe increased significantly in the dust seeded mesocosms 7 d after the addition of dust (Wagener et al., 2010). A probable mechanism could be the production of specific Fe binding ligands by heterotrophic bacteria in the dust seeded mesocosms in response to a change in the bioavailability of Fe after the settling of par-ticles. This hypothesis was supported by observations of changes in the diversity of the bacterial community attached to the dust particles (Laghdass et al., 2011).
Here during DUNE-2, this hypothesis was completely ver-ified for Fe where a comparable response to the first addi-tion of dust was observed with an increased scavenging of Fe, whereas after the second addition of dust, dissolution of Fe from the dust particles was observed. No additional dust dissolution batch reactor experiments were performed dur-ing DUNE-2, but Fe binddur-ing ligand measurements by lig-and competition lig-and cathodic stripping voltammetry showed a significant increase of Fe binding ligands at t191(25), in complete accordance with the increase in Fe solubility ob-served for DUNE-1. As mentioned earlier, this increase in Fe binding ligands can explain the transient increase in Fe inventory. However, it is interesting to note that the increase of Fe concentration by the second addition of dust was only very limited in time (24 h), whereas the ligand concentration in the dust seeded mesocosms remained high until the end of the experiment. The Fe inventory after the second dust
ad-dition rapidly decreased to the pre-adad-dition values when a massive export of lithogenic particles was observed with the release of the stratification of the water column (Fig. 5a).We observed different behavior for Mn and Al in comparison to Fe and this can be explained by differences in their specia-tion in seawater. Whereas the solubility of Mn and Al is con-trolled solely by inorganic species, the solubility of soluble and colloidal Fe is controlled by organic complexes (Gled-hill and Buck, 2012). Indeed, opposing effects were observed for Al and Fe. The consecutive additions of dust did not im-pact the dissolution of Al but did imim-pact the loss rate through the increase of scavenging onto biogenic particles induced by biomass increase subsequent to the first dust addition. However, this mechanism was not observed for Mn, which is certainly subject to more complex redox and photochemical processes (Sunda and Huntsman, 1987, 1988). Overall, this demonstrates that the biogeochemistry of the surface ocean responds in a nonlinear way to the atmospheric flux of dust to the seawater. The frequency of the depositions needs to be taken into account because it will condition the impact of the deposited particles. This has important consequences on the time scales that have to be studied in order to obtain a realistic picture of the impact of dust deposition.
Supplementary material related to this article is available online at: http://www.biogeosciences.net/10/ 2583/2013/bg-10-2583-2013-supplement.zip.
Acknowledgements. This study was financially supported by
ANR-DUNE under the contract ANR-07-BLAN-0126-01. Funding for the participation of K. Wuttig and support of the work per-formed during DUNE-2 were provided by grants from the DFG to P. L. Croot (CR145/15-1 and CR145/17-1). The financial sup-port by the BMBF Verbundprojekt SOPRAN (FKZ 03F0462A and 03F0611A), which is a German contribution to SOLAS (Surface Ocean – Lower Atmosphere Studies), is also gratefully acknowl-edged. T. Wagener was supported by a Marie Curie IEF (Grant agreement No. PIEF-GA-2009-236694, DAPOP). M. Bressac ac-knowledges a PhD grant provided by the ACRI-ST company and the French National Association for Research and Technology (ANRT). J. M. Dominici and collaborators of the R´eserve naturelle de Scan-dola, Parc naturel r´egional de Corse are gratefully acknowledged for their cooperation and help in performing the experiment in the Bay of Elbo. We thank all of the participants of the DUNE-2 experiment for their involvement. Special thanks are also due to F. Malien and M. Lohmann (GEOMAR) for their nutrient laboratory work on very short notice and to Sandrine Chifflet (MIO) for all her Fe binding ligand measurements. We would like to acknowledge the editor and four anonymous reviewers for improving this paper.
The service charges for this open access publication have been covered by a Research Centre of the Helmholtz Association.