HAL Id: insu-03022927
https://hal-insu.archives-ouvertes.fr/insu-03022927
Submitted on 25 Nov 2020
HAL is a multi-disciplinary open access archive for the deposit and dissemination of sci-entific research documents, whether they are pub-lished or not. The documents may come from teaching and research institutions in France or abroad, or from public or private research centers.
L’archive ouverte pluridisciplinaire HAL, est destinée au dépôt et à la diffusion de documents scientifiques de niveau recherche, publiés ou non, émanant des établissements d’enseignement et de recherche français ou étrangers, des laboratoires publics ou privés.
Enhancement of oil recovery by emulsion injection: A
pore scale analysis from X-ray micro-tomography
measurements
Kamila Scheffer, Yves Méheust, Marcio Carvalho, Marcos Mauricio, Sidnei
Paciornik
To cite this version:
Kamila Scheffer, Yves Méheust, Marcio Carvalho, Marcos Mauricio, Sidnei Paciornik. Enhance-ment of oil recovery by emulsion injection: A pore scale analysis from X-ray micro-tomography measurements. Journal of Petroleum Science and Engineering, Elsevier, 2021, 198, pp.108134. �10.1016/j.petrol.2020.108134�. �insu-03022927�
Journal Pre-proof
Enhancement of oil recovery by emulsion injection: A pore scale analysis from X-ray micro-tomography measurements
Kamila Scheffer, Yves Méheust, Marcio S. Carvalho, Marcos H.P. Mauricio, Sidnei Paciornik
PII: S0920-4105(20)31188-8
DOI: https://doi.org/10.1016/j.petrol.2020.108134
Reference: PETROL 108134
To appear in: Journal of Petroleum Science and Engineering
Received Date: 30 June 2020 Revised Date: 6 November 2020 Accepted Date: 12 November 2020
Please cite this article as: Scheffer, K., Méheust, Y., Carvalho, M.S., Mauricio, M.H.P, Paciornik, S., Enhancement of oil recovery by emulsion injection: A pore scale analysis from X-ray micro-tomography measurements Journal of Petroleum Science and Engineering, https://doi.org/10.1016/ j.petrol.2020.108134.
This is a PDF file of an article that has undergone enhancements after acceptance, such as the addition of a cover page and metadata, and formatting for readability, but it is not yet the definitive version of record. This version will undergo additional copyediting, typesetting and review before it is published in its final form, but we are providing this version to give early visibility of the article. Please note that, during the production process, errors may be discovered which could affect the content, and all legal disclaimers that apply to the journal pertain.
Kamila Scheffer: investigation, Writing - Original Draft
Yves Méheust: Formal analysis, Writing - Original Draft, Writing -Review & Editing Marcio S. Carvalho: Conceptualization, Writing - Review & Editing
Marcos H. P Mauricio: investigation
Sidnei Paciornik: Supervision, Writing - Review & Editing
1
Enhancement of oil recovery by emulsion injection:
A pore scale analysis from X-ray micro-tomography measurements
Kamila Scheffer1, Yves Méheust2, Marcio S. Carvalho3, Marcos H. P Mauricio1, Sidnei Paciornik1
1
Department of Chemical and Materials Engineering, Pontifícia Universidade Católica do Rio de Janeiro, Rio de Janeiro, Brazil
2
Univ. Rennes, CNRS, Géosciences Rennes, UMR 6118, 35000 Rennes, France
3
Department of Mechanical Engineering, Pontificia Universidade Católica do Rio de Janeiro, Rio de Janeiro, Brazil
Abstract: The efficiency of emulsion injection as an enhanced oil recovery (EOR)
method is investigated in a synthetic porous medium consisting of sintered bi-disperse glass beads, which emulates the porosity and permeability of real oil-bearing rocks. Synthetic seawater and an oil-in-water emulsion are successively used to displace a mineral oil which initially saturates the porous space. Micro-CT images with a 4 µm resolution are acquired at the end of the different stages of the process; the water phase is doped with KI to optimize the contrast between the liquid phases. Thus, three-dimensional (3D) images showing the beads, doped water and residual oil present a 3-modal histogram. After denoising with a non-local means filter, alignment and segmentation, the 3D images provide the spatial distributions of the water and oil phases, and thus allow comparing the populations of residual oil ganglia prior to and after the injection of the emulsion. Visual comparison of the spatial phase distributions show that the oil droplets of the oil-water emulsion divert the water path, mobilizing previously trapped oil ganglia. The probability density functions (PDFs) of different geometrical properties of the trapped oil ganglia (104 ganglia with volumes spanning
6 orders of magnitude) after water injection show well defined power law behaviors between a size corresponding to the typical pore throat and that typical of 10 typical pore volumes, and a few very large clusters of sizes between 10 and 5 × 10 typical pore volumes. The largest of them alone accounts for 97% of the trapped oil. The same PDFs after emulsion injection demonstrate successful fragmentation of these few very large ganglia, which in this case is the key to efficient EOR procedure through diversion of the water flow by emulsion oil droplets to less permeable regions.
2
Keywords: EOR; Emulsion; Secondary Recovery; Microfluidics; micro-CT; 3D Image
analysis
1 Introduction
Emulsions are mixtures of at least two liquids that are immiscible. In emulsions obtained from two such liquids, one of the liquid phases consists of droplets dispersed inside the other, continuous, liquid phase. The flow of emulsions through porous media is of primary interest in several scientific fields, including bioengineering (Peng et al., 2011) and environmental science where it occurs in subsurface applications such as soil and groundwater remediation (Jain, Vivek and Demond, 2002; Ouyang, Y and Mansell, RS and Rhue, 1995) and enhanced oil recovery (EOR) (Arhuoma, Mohamed and Dong, Mingzhe and Yang, Daoyong and Idem, 2009; Mandal et al., 2010a; McAuliffe, 1973; Sarma et al., 1998).
In these applications, emulsions injected from the surface or formed in situ by the action of natural surfactants (Feng et al., 2018; Jain, Vivek and Demond, 2002; Ouyang, Y and Mansell, RS and Rhue, 1995; Yoon et al., 2016; Zhao et al., 2020) change the flow dynamics inside the porous medium during oil displacement and may lead to substantial increase in the volume of oil recovered. McAuliffe (McAuliffe, 1973) reported a pilot field test with significant increase in the produced oil volume after the injection of 0.4 pore volumes of an oil-in-water emulsion. The results indicated that the sweep efficiency of water injection was strongly enhanced following the injection of the emulsion, with lower-oil ratio in the production wells. Field results presented by Bai et al. (Bai et al., 2000) also demonstrated the potential of emulsions as conformance agents, i.e., their capacity to improve the uniformity of the flood front of the injected drive fluid. Various core flooding experiments confirmed that injection of emulsions between two water floodings can improve the oil recovery by 20% or more (Demikhova et al., 2016; Kumar et al., 2012; Mandal et al., 2010b) .The mechanism responsible for the improved oil displacement involves the blocking by the emulsion’s dispersed oil droplets of larger pore throats already swept by the water phase, which leads to diversion of subsequent water flow to smaller pores that are still fully saturated by oil (Mandal et al., 2010a; Soo et al., 1986; Soot and Radke, 1986), thus improving the homogeneity of the sweep (Chen et al., 2021; Pei et al., 2017) This diversion mechanism is only efficient if the size of emulsion droplets is matched to the pore throat width (Liu et al., 2019) In oil-wet rock formations, dewetting of oil adsorbed to rock surfaces by emulsification is another observed mechanism of oil mobilization (Ning et al., 2018) Guillen et al. (Guillen et al., 2012) showed that emulsion flooding affects oil displacement by the water phase in a
3
multi-scale fashion, by (i) lowering the mobility of the injected fluid, which leads to a more uniform macroscopic sweep, and (ii) better mobilization of trapped ganglia, which leads to a lower residual oil saturation. The multi-scale effect is clearly reflected in the relative permeability curves of oil and oil-in-water emulsion (a water phase containing dispersed oil droplets) flow presented by Engelke et al. (Engelke, Bernardo and Carvalho, Marcio S and Alvarado, 2013) and in the saturation maps presented by de Farias et al. (de Farias et al., 2016), which were obtained by X-ray tomography after water flooding and emulsion. The relative permeability curves of oil and an oil-in-water emulsion have been used in reservoir-scale models to study oil displacement by emulsion injected or formed in situ (Arhuoma, Mohamed and Dong, Mingzhe and Yang, Daoyong and Idem, 2009; Ponce F. et al., 2014).
Baldygin et al. (Baldygin et al., 2014) proposed alternating water and emulsion injections to
maximize the oil recovery and minimize the amount of emulsion injected. Most of these studies were done at ambient pressure and temperature. Various such studies focus on the impact of the emulsion’s concentration (Zhou et al., 2018) and properties (Pang et al., 2019) on the efficiency of oil recovery. Interesting accounts of the current knowledge on emulsion flows for EOR can be found in the following recent review papers: refs. (Perazzo et al., 2018; Zhou et al., 2019) while a review on spontaneous emulsification in the context of EOR can be found in ref. (Li et al., 2020)
The pore scale dynamics of emulsion flows in porous media are particularly complex since they feature both liquid-liquid interface instabilities that are characteristic of immiscible two-phase flow, and a non-Newtonian rheology. Despite the recent progress on emulsion flooding, the pore scale mechanisms by which emulsion droplets displace trapped oil ganglia are still far from fully understood, which hinders full comprehension of macroscopic emulsion flooding. Recent developments in flow visualization techniques and in the fabrication of microfluidic devices have led to a wider use of flow visualization at the pore scale to gain detailed information on the multiphase flow and spatial distribution of trapped oil ganglia (Berejnov et al., 2008; Kumar Gunda et al., 2011; Xu et al., 2017). Flow visualization on porous media models using two-dimensional (2D) micromodels have improved the fundamental understanding of different two-phase flow phenomena related to viscoelastic (Clarke et al., 2015) and wettability effects (Avendaño et al., 2019; Lee et al., 2015; Zhao et al., 2016) in porous media flow. However, the simpler topology and pore connectivity of 2D models may not allow them to capture entirely the physical phenomena occurring in 3D (in particular, natural) porous media structures, as previously demonstrated for advective mixing (Heyman et al., n.d.; Turuban et al., 2019, 2018) which explains the
4
growing interest in 3D visualization measurement methods (Blunt et al., 2013).
Visualization and measurement of transport phenomena in 3D pore structures is challenging. Nuclear magnetic resonance (NMR) (Sankey et al., 2009; Sheppard et al., 2003), confocal microscopy (Amber T. Krummel and Sujit S. Datta, 2009; Anbari et al., 2018; do Nascimento et al., 2019), and X-ray micro-CT (Iglauer et al., 2010; Oughanem et al., 2015) have been used to visualize two phase flow and final phase distributions in 3D porous media. To our knowledge, none of these measurement techniques has yet been used to investigate oil displacement by emulsion flow. Among them, X-ray micro-tomography (micro-CT) provides the lowest spatial resolution and has been used to characterize the pore space, i.e. determine the porosity, fracture network structure and mineralogy of the pore walls (Bera et al., 2011; Sok et al., 2010), to study phase distribution after oil displacement processes (Feali et al., 2012; Gunde et al., 2010; Iglauer et al., 2010; Oughanem et al., 2015) and evaluate damage caused in subsurface formations by the invasion of drilling fluids (Ma and Chen, 2014). In this study, we use X-ray micro-CT to investigate emulsion-based EOR.
X-ray tomography is a non-destructive technique that provides the 3D distribution of a sample’s absorbance (sometimes denoted optical density), thus allowing to determine the surface (whether internal or external) and internal structure of a porous medium, and the spatial distribution of fluids phases present in its pore space, provided that their absorbances are sufficiently different from each other. To form the 3D image, the measurement process consists in the acquisition of several 2D projections while the sample is rotated by small regular angular intervals. Each of these projections is a radiography image of the sample taken along the particular direction defined by the sample orientation; the grey levels in the image represent the X-ray attenuation coefficient of the material. During acquisition of each projection, the X-ray beam is transmitted through the sample along many different paths and directions, and then reaches a scintillator, which transforms the beam into visible light (Bouxsein et al., 2010). The light is captured by a photo detector for each angular position of the sample and the corresponding data is recorded in the form of a projection image relative to that particular orientation of the sample with respect to the incoming X-ray beam. The data acquisition is completed after rotation of the object by 360°; the 3D absorbance distribution is then reconstructed from the set of 2D projection images.
In the present work, high-resolution X-Ray micro-CT is used for the first time to study displacement of oil by an oil-in-water emulsion in a consolidated porous medium. Image processing of the 3D data, coupled to statistical analysis of the trapped oil ganglia’s geometric properties, evidence the pore-scale flow diversion caused by oil droplets from the
5
injected emulsion, and allow for quantitative analysis of the resulting changes in the population of trapped oil ganglia. The experimental method is described in section 2, while the results are presented and discussed in section 3. Section 4 is the conclusion.
2 Experimental setup and procedure
2.1 Porous medium
Our model porous medium consisted of a consolidated packing of glass spheres. A prismatic quartz column of square cross section (3 x 3 mm) and height 12 mm was filled with a binary mixture of borosilicate glass beads of diameters d = 106 and D = 250 µm (MO-SCI Specialty Products, L.L.C) in equal volumetric parts. The volume fractions of the large and small spheres were thus xD = xd =0.5. The permeability of the porous medium was measured from a
single-phase flow experiment using Darcy´s law, to K = 8.8 D = 8.8 10-12 m2.
Emulsion injection is effective as a flow divergent agent when the dispersed droplet size is larger than the pore throat (de Farias et al., 2016). So, in order to estimate the diameter of the emulsion droplets that would best enhance oil recovery, it was important to estimate the average pore throat diameter. In a monodisperse sphere packing with spheres of diameter , the pore size probability function follows a log-normal distribution with a peak close to
0.4 × and largest pores close to 0.8 × ; the pore throat size varies from 0.15 × to 0.25 × (Roozbahani et al., 2014). Following Ref. (M.Mota, J.A. Teixeira, 2001), we
estimated the average particle diameter for a monodisperse packing with the same permeability of our bidisperse packing as the harmonic average of d and D weighted by their volume fraction (0.5 here):
= + = + = 148.8 μm ≈ 150 μm (1)
Therefore, the typical pore size varies between 60 and 120 µm, and typical pore throats vary between 25 and 40 µm.
Note that the simple emulsion preparation method (see section 2.2. below) does not provide control of the emulsion droplet size, and that for the emulsion flow to be efficient at improving oil recovery, the largest pore sizes found in the medium have to be of same order as the most likely oil droplet diameter in the emulsion (Liu et al., 2019) (see section 2.2. below). Hence this constraint imposed the bead sizes in the setup. The resulting permeability is one order of magnitude larger than that of the most permeable oil reservoirs. However, downscaling the emulsion’s droplet sizes and the bead sizes while ensuring that their ratio
6
remains identical would provide the same results. Hence our results are relevant to EOR by emulsion flows.
2.2Fluids
The oil phase, which initially saturated the porous medium and was the dispersed phase of the injected emulsion, was the paraffinic mineral oil 500 PS, code number OBLP005LT, produced by Agecom Produtos de Petróleo Ltda. Its dynamic viscosity and density at 20°C are respectively
µ
= 0.268 Pa.s andρ
= 885.4 kg/m3, and therefore its kinematic viscosity isν
= 3.027 × 10⁻⁴ m2/s; its surface tension (i.e., interfacial tension with respect to air) isσ
= 30.2 mN/m. The water phase and the continuous phase of the injected emulsion consisted of a surfactant (STEOL CS-370, from Stepan Company) solution in synthetic sea water (see ref. (American Society For Testing and Materials - ASTM D1141, 2013) for its composition). The critical micelle concentration (CMC) of the surfactant was determined experimentally using Du Noüy ring technique and the DCAT 25 tensiometer (from Dataphysics), by measuring the interfacial tension as a function of surfactant concentration. The CMC found was 0.036g per 100mL of synthetic seawater. The concentration of the surfactant solution used in all experiments was twice the CMC and the surface tension wasσ
= 31.2 mN/m. The water phase also contained 1.7 g/10 mL of Potassium iodide (KI) to improve the contrast between the oil and the water phases in the experimental images, as explained in section 2.5 below. The addition of Potassium iodide slightly reduced the value of the aqueous phase surface tension toσ
= 28.7 mN/m. The interfacial tension between the oil and the aqueous phase used in the experiments (with KI) wasσ
ι = 0.9 mN/m. The properties of the liquids used are summarized in Table 1.Table 1. Summary of liquid properties.
Water phase Oil phase
Composition Synthetic sea water ([44]) + 0.072 g/100 mL STEOL CS-370 + 1.7 g/10 mL KI
paraffinic mineral oil 500 PS
ρ 1145.5 kg/m3 885.4 kg/m3
µ 1.206 mPa.s 268 mPa.s
σ 28.7 mN/m 30.2 mN/m
The oil-in-water emulsion was prepared by mixing the oil and aqueous phases in
7
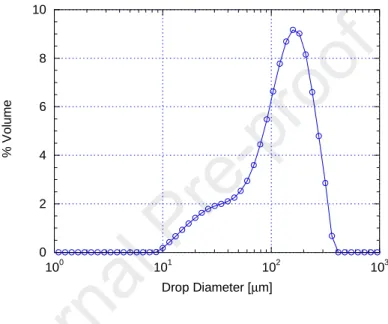
equal proportions by volume. Both phases were placed in a small vessel which was hand agitated vigorously for 15 seconds. The resulting droplet size distribution was measured by laser diffraction using a Malvern Mastersizer 2000 Particle Size Analyzer coupled to a Malvern Hydro 2000MU dispersing unit; it is shown in Figure 1. The time of agitation was chosen such that resulting emulsion had droplets from 10 to 300 µm, with a peak in volumetric distribution which was close to the largest pore size diameter of 120 µm. The dispersion procedure was able to generate emulsions with repeatable characteristics.
0 2 4 6 8 10 100 101 102 103 % V o lu m e Drop Diameter [µm]
Figure 1: Droplet size distribution of the injected oil-water emulsion.
2.3Immiscible multiphase displacement experiments
The experimental setup for the multiphase displacement experiments is sketched in Figure 2. Two Harvard Apparatus Withdraw Elite 11 syringe pumps were used to inject the fluids in the synthetic porous medium. One of the syringes was filled with the aqueous phase and the second with either the oil phase or the 50% by volume oil-in-water emulsion, depending on the step of the experimental procedure. All fluids used in the experiment were filtered to eliminate impurities in the system and unexpected artifacts in the micro-CT images. Millipore membranes with meshes of 0.22 µm and 0.8 µm were used for this purpose.
8
Figure 2 – Experimental setup for fluid displacement, consisting of two syringe pumps and a packing of glass spheres.
Initially, CO2 was injected for approximately three hours to eliminate any air trapped
in the pore space. Immediately after the injection of CO2, the aqueous phase was injected at
different flow rates, from 2.7 × 10 to 5.55 × 10 ! m3/s. The pressure difference measured as a function of the imposed flow rate was used to evaluate the glass bead packing’s permeability (see its value in section 2.1 above). The porous medium, fully saturated with the aqueous phase, was taken to the micro-CT setup for the first tomography image (see section 2.4 below).
The aqueous phase was then displaced by injecting oil at a constant flow rate of Q = 20 µL/h until there was no aqueous phase flowing out of the porous medium. A second tomography image, with an irreducible water saturation in the porous medium, was recorded after this step.
The oil phase was subsequently displaced by injecting the aqueous phase at a constant flow rate of Q = 20 µL/h until there was no oil flowing out of the glass bead packing. The capillary number, evaluated in terms of the aqueous phase’s viscosity and interfacial tension between the aqueous and oil phase, was "# = 7.4 × 10 $. The volume of oil trapped inside the porous media corresponds to the remaining oil saturation. A third tomography image was acquired at this point.
The following step consisted in emulsion injection. The concentrated emulsion (50%/vol) was injected at a flow rate of Qe = 0.86 µL/h while the continuous aqueous phase
continued to be injected at Q = 20 µL/h. This particular combination of flow rates was chosen such that the resulting emulsion injected in the glass bead packing had a volumetric concentration of 3%. The emulsion was injected in this manner during te = 3.125 h, which
corresponded to one pore volume of the porous medium (or 65 µL). After the end of the
9
emulsion injection, the aqueous phase continued to be injected until the oil phase flow out of the porous media ceased entirely, which occurred after more than two pore volumes of water had swept the medium. A fourth tomography image acquisition was then performed.
2.4 3D Image Acquisition
A Zeiss-XRadia 510 Versa X-ray micro-tomograph (Figure 3) was used to obtain 3D images of the glass bead packing at the different stages of the experimental procedure, as described above. This equipment combines traditional geometrical magnification controlled by the source-sample-detector distances with optical magnification provided by optical lenses fitted with scintillators to convert X-rays to light. The use of lenses allows imaging a smaller volume of interest (VOI) with higher resolution.
Figure 3 – Internal view of ZEISS XRadia 510 Versa with mounted sample and connected tubing.
For the experiments described herein, a 4X lens was used, allowing the visualization of the full cross section of the sample with a pixel size of 4.6 µm. X-ray energy was set to 60 keV and 5W power. A suitable filter was used to reduce the well-known effect of beam hardening. 1601 projection images were acquired in a full 360o sample rotation. Special care was taken to guarantee that the connected tubing was flexible enough to allow for the required rotation. To image the full height of the sample, the system was programmed to automatically capture images at different heights and stitch them together. The total acquisition time for each complete 3D image was 30 hours.
One of the difficulties in imaging water and oil by micro-CT is their low and similar X-ray absorbance, which renders them very difficult to discriminate in the X-ray data. A
10
well-known solution (de Farias et al., 2016) is to mix potassium iodide (KI) with water to increase its absorbance. By varying the concentration of KI one can fine tune the system to obtain good contrast between water, oil and the glass beads. Tests were performed with five different concentrations of potassium iodide for 10 mL of synthetic sea water: 1.1, 1.3, 1.5, 1.7 and 2 g. The best contrast was obtained for 1.7 g/10 mL.
2.5 Image Processing and Analysis
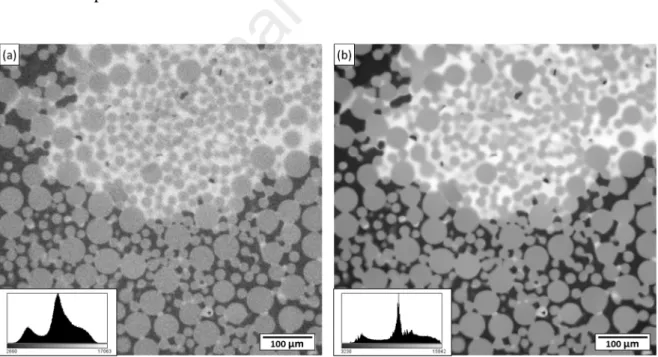
The acquired 3D images were processed and analyzed using the Dragonfly Pro software (Object Research Systems, Montreal). As a pre-processing step, the Non-Local Means filter (Kervrann et al., 2007) was used to reduce noise. This is a very efficient low-pass filter that preserves object edges. The effect of the filter is shown in Figure 4. In these images, oil, glass beads and doped water appear dark grey, middle grey and (very) light grey, respectively. The impact on the image histogram is also shown. In the raw image the peaks for glass beads and water overlap and the valley between the peaks for oil and glass beads is not very shallow. Indeed, dark noise pixels inside the glass beads are easily mixed with pixels belonging to the oil phase. After noise reduction, these effects were mitigated and the separation between phases was improved.
Figure 4 – Images before (a) and after (b) the application of the non-local means filter. Oil, glass beads and KI-doped water appear dark grey, middle grey and very light grey, respectively. The insets show the grey level
histograms of the corresponding images.
The following step was image segmentation, in which the component phases were discriminated from each other and from the background. Given the very good contrast achieved between oil, glass and doped water, a simple manual thresholding procedure was
11
used based on the image’s grey level histogram minima between the three peaks corresponding to the three phases. Figure 5a shows the results of the segmentation procedure with oil in red, the glass beads in green, and the doped water in blue. There is some remaining overlap between the grey level ranges for the solid and water phases, which corresponds to the region shown in cyan in Figure 5a. However, the most relevant phase for our study – oil – is accurately segmented as shown by the yellow outlines superimposed on the filtered image in Figure 5b.
Figure 5 – (a)Segmentation of oil (red) glass beads (green) and doped water (blue). Cyan regions represent the overlap between glass beads and water intensity ranges. (b) The segmented oil phase is outlined in yellow and
superimposed onto the filtered image of Figure b.
Once segmented, the phases were quantified. Both global measurements such as total volume and volume fraction for each phase, and measurements specific to connected regions such as volume, surface and various shape observables, were obtained. For the specific case of oil recovery analysis, the distributions of volume, surface area and aspect ratios of the oil ganglia remaining in the porous medium were obtained.
3
Results and Discussion
3.1 Visual comparison of 3D images and global changes in oil and water saturation
Figure 6 shows 2D Y-Z cross sections in the mid-vertical plane of the porous medium at the irreducible water saturation (a), after the first water injection (b), and after emulsion injection followed by water injection (c). Because the glass beads are preferentially wetted by water, the irreducible water was present as small liquid bridges between neighboring spheres, as appears clearly in Figure 6a. The proportions of the sample volume occupied by the
12
phases, as obtained from the 3D images, were: water 2.53%, oil 36.75% and matrix 60.72%. The sum of the percentage of water and oil corresponds to a porosity of % = 0.39. The initial oil saturation was ()* = 0.94 and the irreducible water saturation was (+* = 0.06.
After the first water injection, shown in Figure 6b, a preferred water path is clearly visible, leaving large regions with trapped oil phase. The amount of displaced oil was then approximately 45% of the original oil volume. The remaining oil saturation after water injection was (),+ = 0.51.
After the emulsion injection step (including continuous injection of water after emulsion injection was completed), the aqueous phase is much more widespread, as shown in Figure 6c. The volume of remaining oil is clearly much reduced. The emulsion droplets blocked previously formed preferential flow paths for the water phase, diverting the flux to regions containing previously immobilized oil phase. The extra volume of oil displaced after emulsion injection was approximately 32% of the original oil saturation, leading to a remaining oil saturation of approximately (),- = 0.22.
13
Figure 6 – 2D Y-Z cross sections of the sample at irreducible water saturation (a), after water injection (b) and after emulsion injection followed by water injection (c). Oil appears dark grey, glass beads grey and doped water
light grey.
14
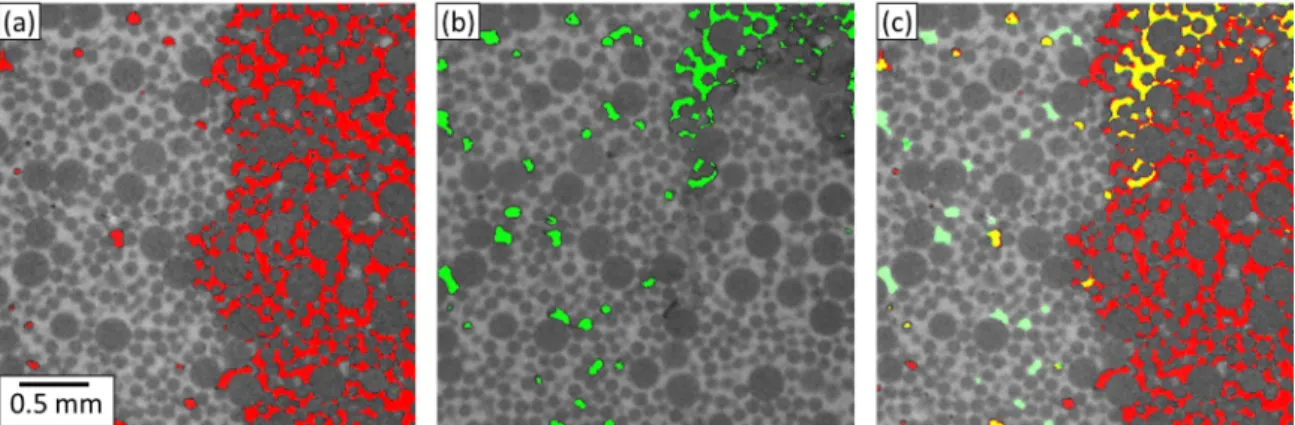
To obtain a more in-depth understanding of the effects of water and emulsion injection, further image processing and analysis was performed on the 3D images. First, the 2 images were aligned manually in 3D using as reference a brilliant glass bead visible at the surface of the sample. An automatic registration procedure involving translation and rotation was then used to allow voxel-per-voxel comparison between them. Figure 7 shows the resulting cropped and magnified view of the same Y-Z plane after first water and emulsion injection. Residual oil is shown in red and green respectively. The strong impact of emulsion injection is clearly visible.
Once aligned, the 3D images can be directly compared, as shown in Figure 7(c) where a composite image shows the difference between the two images. Regions of the pore space where oil is present after water injection, in Figure 7(a), but does not appear in Figure 7(b), which means that it has been removed or displaced by the emulsion injection (followed by water flooding), are shown in red. Regions of the pore space where oil is present both in Figures 7(a) and 7(b), thus corresponding to the presence of oil both before and after the emulsion injection, are shown in yellow. These regions correspond either to oil ganglia that have not been displaced by the emulsion injected, that have been fragmented with one fragment not having been displaced by the injection, or that have been displaced but replaced by other ganglia. New ganglia created after emulsion injection (followed by water flooding) are shown in light green; they most likely correspond to emulsion droplets among the largest, which have been trapped by the medium upon injection. The change in volume and configuration of the trapped oil ganglia can then be accurately measured. After the first water injection, 10.51 mm3 of oil remained in the medium. After emulsion followed by water injection, this volume was reduced to 4.82 mm3.
Figure 7 – A cropped, magnified view of a Y-Z plane (a) after water injection and (b) after emulsion injection. Notice the accurate alignment between the images. Residual oil is shown in red and green in (a) and (b), respectively. (c) Composite image showing differences in oil localization between (a) and (b): regions where oil
15
is present in (a) but not in (b), are shown in red, while regions where oil is present in (a) and (b) are shown in yellow, and new oil ganglia (present in (b) but not in (a)) in light green,.
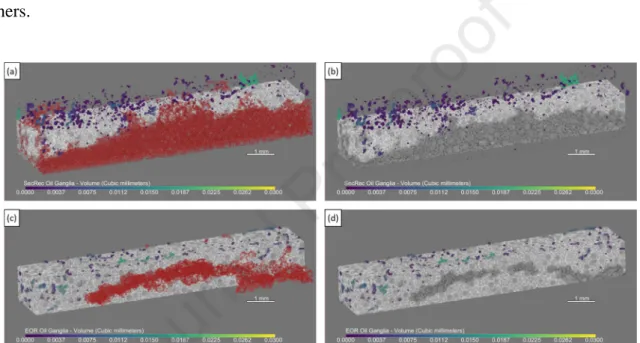
In Figure 8, 3D renderings of the medium and residual oil are depicted after first water injection (top row) and emulsion injection followed by water injection (bottom row). Oil ganglia volume is color coded according to the color bar underneath each image. In Figures 8a and 8c, the largest oil ganglion is shown in red. This ganglion was not included in the color scale for volumes because it is at least 2 to 3 orders of magnitude larger than all others and would impair the visualization of the volume variation of the remaining ganglia. In Figures 8b and 8d, that largest ganglion is hidden to allow for better visualization of the others.
Figure 8 – 3D renderings of the medium (in gray) and oil ganglia (in colors) after water injection (top row) and emulsion (bottom row). The largest connected oil ganglion in each case is shown in red (a and c) or hidden (b
and d).
3.2Statistical analysis of oil ganglia geometry
Statistical analysis of the geometrical features of trapped oil ganglia after water and emulsion injection was performed in order to better understand the mechanisms associated with oil displacement during emulsion injection. These geometrical features include the volume, surface, volume to surface ratio, and aspect ratio of the ganglia. Below the typical pore throat size of 40 µm, the distributions of these geometric features appeared very sensitive to the threshold used to segment the images. Therefore we chose not to consider ganglia of volume smaller than (4/3)π(203) µm3=344 voxel volumes, or ~1/27th of the typical pore volume .p of 9295 voxel volumes (for pore diameters of 120 µm). This is also consistent with the fact that spherical ganglia of diameter smaller than the typical pore throat would not remain trapped in
16 the medium; they would be flushed out of it.
0
Figure 1: Log-binned histograms of oil ganglia volumes (a) and surface areas (b) at the end of water and emulsion injection. The bin is 0.02 for both histograms.
Volumes of the oil ganglia: The log-binned histogram of oil ganglia volumes
(normalized by the typical pore volume) remaining in the sample after the first water injection is shown as solid black circles in Figure 9a. It shows that the very large ganglion seen in red in Figure 8a is at least three orders of magnitude larger than each of all other ganglions in the population. That single largest ganglion accounts for more than 97% of the residual oil. If one
17
excludes it as well as the two next largest ganglia, all other ganglion sizes fall on a strikingly-regular power law behavior . .⁄ min .$ ± . , over 2.5 orders of magnitudes (0.03 <
./.6< 15). Such a power-law behavior has been observed in ganglia trapped in sandstones
(Iglauer et al., 2012; Oughanem et al., 2015), however the ganglia sizes and the associated size range were much smaller than the ones reported here for glass bead packing.
After the sample has been further flushed by the emulsion and the subsequent water flooding, the distribution of remaining oil ganglia (blue stars in Figure 9a is modified in the following manner: the largest ganglion, though still 2 orders of magnitude larger than the second largest, is 2.6 times smaller than before. A peak is observed between log :./.p; =
−0.5 and log :./.p; = 0, i.e. for ganglia radii varying from 0.68=p = 82 µm to 120 µm. It
probably results from an accumulation of droplets of the injected emulsion in the medium. For ganglia volume in the range of 1 < ./.6 < 15, the distribution exhibits a power-law behavior, . .⁄ min . >± . , which results from (i) the fragmentation of the largest ganglion into three large clusters of volumes equal to 23, 92 and 9204 pore volumes, respectively, and smaller ganglia present after the first water injection over a range of sizes between 1 and 15 typical pore volumes, and (ii) the coalescence of droplets from the injected emulsion with oil ganglions of sizes in that range and already present in the medium. This means that the oil droplets from the injected emulsion, partly by coalescing with already present oil ganglia, have managed to block the preferential water paths and divert the subsequent water phase flow, allowing it to fragment the main oil ganglion. This is consistent with the qualitative picture inferred from Figure 8.
Surface areas of the oil ganglia: The histogram of oil ganglion surface areas, S,
shows a behavior (Figure 9b) similar to that of the volumes (Figure 9a). The largest ganglion present in the medium after water injection has a surface area more than three orders of magnitude larger than any of the other ganglions, which, apart from the second largest ganglion of surface 1580 times smaller than the latter, all fall on a power law behavior with exponent -1.01±0.02, over two orders of magnitude. After the medium has been swept by the emulsion and the subsequent water injection, there remain two ganglia of surface much larger than the rest of the distribution, but smaller than the previously-largest ganglion, and more ganglions in the intermediate surface range 10? μm < ( < 10@.@ μm2, corresponding to a power law of identical exponent (-1.01±0.02) as that observed prior to injecting the emulsion. That power law forms from a shoulder in the plot that corresponds to a surface 10?.@@ µm2; this is exactly the volume of a sphere of volume .p. Hence the interpretation of the ganglia’s
18
surface distribution is fully consistent with that of the distribution of ganglia volumes.
Shape parameters of the oil ganglia: The morphology of the trapped oil ganglia can
be analyzed from the histograms of volume-to-surface ratio V/S, presented in Figure 10a. Small values of V/S correspond to elongated ganglia. After emulsion injection, the distribution is strikingly similar to what it was after the first water injection, except for the appearance of a peak around log ./( = 1.04. That peak at . (⁄ ≈ 11 is most likely associated with almost spherical emulsion oil droplets of the injected emulsion. A sphere has a volume to surface ratio equal to the third of its radius, hence for it to be 11 µm, the sphere’s diameter must be 66 µm. This size is somewhat off the value estimated from to the peak in Figure 8a (82 µm, see above), but not overwhelmingly so (20 % discrepancy between them).
The histogram of the ganglia’s aspect ratios also changed as a result of the emulsion injection, as shown in Figure 10b. The population of ganglia exhibits an increase at aspect ratios between 0 and 0.4 after emulsion injection (and subsequent water flooding), corresponding to elongated clusters. It could correspond to ganglia resulting from the coalescence of ganglia that were already present in the medium prior to the emulsion injection with either other similar ganglia which got displaced, or with injected emulsion droplets.
Figure 10 – Histograms of oil ganglia’s volume to surface area ratio (a) and aspect ratio (b) after water and emulsion injection. The histogram bins are 0.025 in both cases (but (a) is log-binned while (b) is linear-binned).
Dependence of the cumulative oil volume of ganglia smaller than V on V: The
difference in size distribution and morphology is directly linked to the remaining oil saturation. To analyze in more detail the reduction of the remaining oil saturation associated with the emulsion injection, Figure 11 shows a plot of the cumulative volume of all ganglions smaller than a given ganglion as a function of that ganglion volume. The figure clearly shows that for both displacement processes, the largest ganglion has a dramatic impact on the
19
volume of trapped oil and that emulsion injection reduces the residual oil saturation by breaking the largest oil ganglia into smaller ones. Consequently, the exponent of the power law part of the curves (valid only over 1.5 orders of magnitude) is more than doubled between the two data sets.
These morphological changes of the ganglions coincide with a decrease of the global saturation in oil of the porous medium. The changes in the morphological attributes of oil ganglia can be interpreted as follows: the emulsion sweep has contributed to fragmenting the largest ganglion into ganglions of much smaller sizes, many of which were small enough to be swept out the porous medium.
Figure 2 – Cumulative volume distribution of the oil ganglia after water and emulsion injection.
Figure 3 – Histograms of the volumes of connected oil clusters that were present in the data measured after the first water injection, here denoted as (i), but are not seen in the data measured after emulsion injection, here denoted as (ii) (black squares), and of connected clusters that are present in (ii) but were not present in (i) (blue
dots). The histograms bins are 0.2 for both curves.
Volumes of connected regions in combined images: It is also interesting to analyze
20
the volumes of connected regions in images obtained by combining the 3D data recorded after the first water injection (let’s denote it as (i) for simplicity) and that recorded after emulsion injection (denoted here as (ii)). Similarly, to what is shown in 2D in Figure 7c, one can consider the connected oil regions present in (i) and not in (ii), and conversely, the connected regions present in (ii) but not in (i). These data are presented in Figure 12. They look similar to the same plots for real oil ganglia present in (i) and (ii) (see Figure 9a) but feature steeper power laws, which means that in the intermediate size range between 1/30 and 15 typical pore volumes there are less larger clusters compared to smaller clusters than in the data (i) and (ii). This is consistent with clusters of sizes towards the upper range of that intermediate size range having been displaced and swept out of the medium preferentially by the emulsion flow.
4
Conclusion
We investigated the displacement of oil through synthetic sea water flooding (secondary recovery) followed by oil-in-water emulsion flooding and a second water flooding, in a packing of bidisperse glass beads. The first time use of high-resolution micro-CT to image the fluid phases, associated to 3D image processing and statistical analysis of the trapped oil ganglia’s geometry at the end of the two stages of EOR, (i) injection of water injection and (ii) emulsion injection followed by second water flooding, demonstrated the efficiency of the diversion mechanism induced by the emulsion flow, and allowed quantifying the effect of emulsion flooding on the trapped oil ganglia. Indeed, the spatial distribution, size and shape of a vast population (~ 10,000) of these ganglia, spanning a wide volume range (between 1/30 and 2.5 × 10 typical pore volumes), were compared between their states after stage (i) and stage (ii) of the EOR procedure.
Emulsion injection reduced the remaining oil volume from (),+ = 0.51 after stage (i) to (),+ = 0.22 after stage (ii). A well-defined power-law behavior was obtained for the probability density functions (PDFs) of ganglia volumes and surface areas at the end of stage (i), for ganglia sizes ranging between 1/30 and 15 typical pore volumes, with only a couple of much larger clusters present in the medium. These very large clusters, in particular the largest one (> 97% of the residual oil saturation), are responsible for most of the residual oil saturation. The major stake for emulsion-based EOR is therefore to block the largest channels and thus divert the subsequent flow of water so as to fragment that largest ganglion into intermediate size ganglia which can be displaced out of the porous medium by the subsequent
21
water flow. Comparison of the PDFs of ganglia volumes and areas after stage (ii) with those after stage (i), demonstrates efficient breakup of the largest oil ganglia into smaller ones, thus confirming the efficiency of the desired diversion effect of emulsion droplets.
The distribution of ganglia aspect ratios is not much affected by stage (ii) of the EOR procedure, but shows an increased presence of more elongated resulting from the coalescence of emulsion droplets with oil ganglia already present in the medium. After emulsion injection, the PDF for the volume to surface ratios of the ganglia displays a peak at 11 µm, possibly corresponding to a preferential size that is characteristic of the emulsion.
Prospects to this study are numerous and include systematic studies of the effect of the capillary number, the mean emulsion droplet size, and the water-to-oil ratio, on the efficiency of emulsion-based EOR. These studies will be performed on larger samples at a much coarser resolution, since scales smaller than the medium’s typical pore throat do not need to be finely resolved. Ultimately, experiments will be performed on real rock cores.
Acknowledgments
This study was financed in part by the Coordenação de Aperfeiçoamento de Pessoal de Nível Superior - Brasil (CAPES) - Finance Code 001. The authors also acknowledge the support of CNPq and FAPERJ, Brazilian agencies. The French National Research Agency (ANR), under project CO2-3D, is gratefully acknowledged for funding of travels and accommodation allowing collaboration between the two institutes.
References
Amber T. Krummel and Sujit S. Datta, 2009. Visualizing Multiphase Flow and Trapped Fluid Configurations in a Model Three-Dimensional Porous Medium. IFAC Proc. Vol. 7, 405– 410. https://doi.org/10.1002/aic
American Society For Testing and Materials - ASTM D1141, 2013. Standard Practice for the Preparation of Substitute Ocean Water. ASTM Int. 98, 1–3. https://doi.org/10.1520/D1141-98R13.2
Anbari, A., Chien, H.T., Datta, S.S., Deng, W., Weitz, D.A., Fan, J., 2018. Microfluidic Model Porous Media: Fabrication and Applications. Small 14, 1–15. https://doi.org/10.1002/smll.201703575
Arhuoma, Mohamed and Dong, Mingzhe and Yang, Daoyong and Idem, R., 2009. Determination of water-in-oil emulsion viscosity in porous media. Ind. \& Eng. Chem. Res. 48, 7092--7102.
22
Avendaño, J., Lima, N., Quevedo, A., Carvalho, M., 2019. Effect of surface wettability on immiscible displacement in a microfluidic porous media. Energies 12. https://doi.org/10.3390/en12040664
Bai, B., Han, M., Li, Y., Wei, M., Gao, Y., Coste, J.P., 2000. Selective water shutoff technology study and application of W/O emulsions. SPE - DOE Improv. Oil Recover. Symp. Proc. 1–8.
Baldygin, A., Nobes, D.S., Mitra, S.K., 2014. Water-alternate-emulsion (WAE): A new technique for enhanced oil recovery. J. Pet. Sci. Eng. 121, 167–173. https://doi.org/10.1016/j.petrol.2014.06.021
Bera, B., Mitra, S.K., Vick, D., 2011. Understanding the micro structure of Berea Sandstone by the simultaneous use of micro-computed tomography (micro-CT) and focused ion beam-scanning electron microscopy (FIB-SEM). Micron 42, 412–418. https://doi.org/10.1016/j.micron.2010.12.002
Berejnov, V., Djilali, N., Sinton, D., 2008. Lab-on-chip methodologies for the study of transport in porous media: Energy applications. Lab Chip 8, 689–693. https://doi.org/10.1039/b802373p
Blunt, M.J., Bijeljic, B., Dong, H., Gharbi, O., Iglauer, S., Mostaghimi, P., Paluszny, A., Pentland, C., 2013. Pore-scale imaging and modelling. Adv. Water Resour. 51, 197–216. https://doi.org/10.1016/j.advwatres.2012.03.003
Bouxsein, M.L., Boyd, S.K., Christiansen, B.A., Guldberg, R.E., Jepsen, K.J., Müller, R., 2010. Guidelines for assessment of bone microstructure in rodents using micro-computed tomography. J. Bone Miner. Res. 25, 1468–1486. https://doi.org/10.1002/jbmr.141
Chen, D., Zhao, H., Liu, K., Huang, Y., Li, B., 2021. The effect of emulsion and foam on anti-water coning during nitrogen foam injection in bottom-water reservoirs. J. Pet. Sci. Eng. 196, 107766. https://doi.org/10.1016/j.petrol.2020.107766
Clarke, A., Howe, A.M., Mitchell, J., Staniland, J., Hawkes, L., Leeper, K., 2015. Mechanism of anomalously increased oil displacement with aqueous viscoelastic polymer solutions. Soft Matter 11, 3536–3541. https://doi.org/10.1039/c5sm00064e
de Farias, M.L.R., Campos, E.F., de Souza, A.L.S., Carvalho, M.S., 2016. Injection of Dilute Oil-in-Water Emulsion as an Enhanced Oil Recovery Method for Heavy Oil: 1D and 3D Flow Configurations. Transp. Porous Media 113, 267–281. https://doi.org/10.1007/s11242-016-0692-0
Demikhova, I.I., Likhanova, N. V., Hernandez Perez, J.R., Falcon, D.A.L., Olivares-Xometl,
23
O., Moctezuma Berthier, A.E., Lijanova, I. V., 2016. Emulsion flooding for enhanced oil recovery: Filtration model and numerical simulation. J. Pet. Sci. Eng. 143, 235–244. https://doi.org/10.1016/j.petrol.2016.02.018
do Nascimento, D.F., Vimieiro Junior, J.R., Paciornik, S., Carvalho, M.S., 2019. Pore Scale Visualization of Drainage in 3D Porous Media by Confocal Microscopy. Sci. Rep. 9. https://doi.org/10.1038/s41598-019-48803-z
Engelke, Bernardo and Carvalho, Marcio S and Alvarado, V., 2013. Conceptual darcy-scale model of oil displacement with macroemulsion. Energy \& Fuels 27, 1967--1973.
Feali, M., Pinczewski, W. V., Cinar, Y., Arns, C.H., Arns, J.Y., Turner, M., Senden, T., Francois, N., Knackstedt, M., 2012. Qualitative and quantitative analyses of the three-phase distribution of oil, water, and gas in bentheimer sandstone by use of micro-ct imaging. SPE Reserv. Eval. Eng. 15, 706–711. https://doi.org/10.2118/151609-PA Feng, H., Kang, W., Zhang, L., Chen, J., Li, Z., Zhou, Q., Wu, H., 2018. Experimental study
on a fine emulsion flooding system to enhance oil recovery for low permeability reservoirs. J. Pet. Sci. Eng. 171, 974–981. https://doi.org/10.1016/j.petrol.2018.08.011 Guillen, V.R., Romero, M.I., Carvalho, M. da S., Alvarado, V., 2012. Capillary-driven
mobility control in macro emulsion flow in porous media. Int. J. Multiph. Flow 43, 62– 65. https://doi.org/10.1016/j.ijmultiphaseflow.2012.03.001
Gunde, A.C., Bera, B., Mitra, S.K., 2010. Investigation of water and CO2 (carbon dioxide) flooding using micro-CT (micro-computed tomography) images of Berea sandstone core using finite element simulations. Energy 35, 5209–5216. https://doi.org/10.1016/j.energy.2010.07.045
Heyman, J., Lester, D.R., Turuban, egis, Le Borgne, T., n.d. Stretching and folding sustain microscale chemical gradients in porous media. https://doi.org/10.1073/pnas.2002858117/-/DCSupplemental.y
Iglauer, S., Favretto, S., Spinelli, G., Schena, G., Blunt, M.J., 2010. X-ray tomography measurements of power-law cluster size distributions for the nonwetting phase in sandstones. Phys. Rev. E - Stat. Nonlinear, Soft Matter Phys. 82, 10–12. https://doi.org/10.1103/PhysRevE.82.056315
Iglauer, S., Fernø, M.A., Shearing, P., Blunt, M.J., 2012. Comparison of residual oil cluster size distribution, morphology and saturation in oil-wet and water-wet sandstone. J. Colloid Interface Sci. 375, 187–192. https://doi.org/10.1016/j.jcis.2012.02.025
Jain, Vivek and Demond, A.H., 2002. Conductivity reduction due to emulsification during surfactant enhanced-aquifer remediation. 1. Emulsion transport. Environ. Sci. \&
24 Technol. 36, 5426--5433.
Kervrann, C., Boulanger, J., Coupé, P., 2007. Bayesian non-local means filter, image redundancy and adaptive dictionaries for noise removal. Lect. Notes Comput. Sci. (including Subser. Lect. Notes Artif. Intell. Lect. Notes Bioinformatics) 4485 LNCS, 520–532.
Kumar Gunda, N.S., Bera, B., Karadimitriou, N.K., Mitra, S.K., Hassanizadeh, S.M., 2011. Reservoir-on-a-Chip (ROC): A new paradigm in reservoir engineering. Lab Chip 11, 3785–3792. https://doi.org/10.1039/c1lc20556k
Kumar, R., Dao, E., Mohanty, K.K., 2012. Heavy-oil recovery by in-situ emulsion formation. SPE J. 17, 326–334. https://doi.org/10.2118/129914-PA
Lee, H., Lee, S.G., Doyle, P.S., 2015. Photopatterned oil-reservoir micromodels with tailored wetting properties. Lab Chip 15, 3047–3055. https://doi.org/10.1039/c5lc00277j
Li, Z., Xu, D., Yuan, Y., Wu, H., Hou, J., Kang, W., Bai, B., 2020. Advances of spontaneous emulsification and its important applications in enhanced oil recovery process. Adv. Colloid Interface Sci. 277, 102119. https://doi.org/10.1016/j.cis.2020.102119
Liu, Z., Li, Y., Luan, H., Gao, W., Guo, Y., Chen, Y., 2019. Pore scale and macroscopic visual displacement of oil-in-water emulsions for enhanced oil recovery. Chem. Eng. Sci. 197, 404–414. https://doi.org/10.1016/j.ces.2019.01.001
M.Mota, J.A. Teixeira, W.R.B. and A.Y., 2001. Binary spherical particle mixed beds: Porosity and permeability relationship measurement.
Ma, T., Chen, P., 2014. Study of meso-damage characteristics of shale hydration based on CT scanning technology. Pet. Explor. Dev. 41, 249–256. https://doi.org/10.1016/S1876-3804(14)60029-X
Mandal, A., Samanta, A., Bera, A., Ojha, K., 2010a. Role of oil-water emulsion in enhanced oil recovery. ICCCE 2010 - 2010 Int. Conf. Chem. Chem. Eng. Proc. 190–194. https://doi.org/10.1109/ICCCENG.2010.5560393
Mandal, A., Samanta, A., Bera, A., Ojha, K., 2010b. Characterization of oil-water emulsion and its use in enhanced oil recovery. Ind. Eng. Chem. Res. 49, 12756–12761. https://doi.org/10.1021/ie101589x
McAuliffe, C.D., 1973. Crude-Oil-in-Water Emulsions To Improve Fluid Flow in an Oil Reservoir. JPT, J. Pet. Technol. 25, 721–726. https://doi.org/10.2118/4370-PA
Ning, J., Wei, B., Mao, R., Wang, Y., Shang, J., Sun, L., 2018. Pore-Level Observations of an Alkali-Induced Mild O/W Emulsion Flooding for Economic Enhanced Oil Recovery. Energy and Fuels 32, 10595–10604. https://doi.org/10.1021/acs.energyfuels.8b02493
25
Oughanem, R., Youssef, S., Bauer, D., Peysson, Y., Maire, E., Vizika, O., 2015. A Multi-Scale Investigation of Pore Structure Impact on the Mobilization of Trapped Oil by Surfactant Injection. Transp. Porous Media 109, 673–692. https://doi.org/10.1007/s11242-015-0542-5
Ouyang, Y and Mansell, RS and Rhue, R., 1995. Emulsion-mediated transport of nonaqueous-phase liquid in porous media: A review. Crit. Rev. Environ. Sci. Technol. 25, 269--290.
Pang, S., Pu, W., Xie, J., Chu, Y., Wang, C., Shen, C., 2019. Investigation into the properties of water-in-heavy oil emulsion and its role in enhanced oil recovery during water flooding. J. Pet. Sci. Eng. 177, 798–807. https://doi.org/10.1016/j.petrol.2019.03.004 Pei, H., Zhang, G., Ge, J., Jiang, P., Zhang, J., Zhong, Y., 2017. Study of polymer-enhanced
emulsion flooding to improve viscous oil recovery in waterflooded heavy oil reservoirs. Colloids Surfaces A Physicochem. Eng. Asp. 529, 409–416. https://doi.org/10.1016/j.colsurfa.2017.06.039
Peng, C.C., Bengani, L.C., Jung, H.J., Leclerc, J., Gupta, C., Chauhan, A., 2011. Emulsions and microemulsions for ocular drug delivery. J. Drug Deliv. Sci. Technol. 21, 111–121. https://doi.org/10.1016/S1773-2247(11)50010-3
Perazzo, A., Tomaiuolo, G., Preziosi, V., Guido, S., 2018. Emulsions in porous media: From single droplet behavior to applications for oil recovery. Adv. Colloid Interface Sci. 256, 305–325. https://doi.org/10.1016/j.cis.2018.03.002
Ponce F., R. V., Carvalho, M.S., Alvarado, V., 2014. Oil recovery modeling of macro-emulsion flooding at low capillary number. J. Pet. Sci. Eng. 119, 112–122. https://doi.org/10.1016/j.petrol.2014.04.020
Roozbahani, M.M., Graham-Brady, L., Frost, J.D., 2014. Mechanical trapping of fine particles in a medium of mono-sized randomly packed spheres. Int. J. Numer. Anal. Methods Geomech. https://doi.org/10.1002/nag.2276
Sankey, M.H., Holland, D.J., Sederman, A.J., Gladden, L.F., 2009. Magnetic resonance velocity imaging of liquid and gas two-phase flow in packed beds. J. Magn. Reson. 196, 142–148. https://doi.org/10.1016/j.jmr.2008.10.021
Sarma, H.K., Maini, B.B., Jha, K., 1998. Evaluation of emulsified solvent flooding for heavy oil recovery. J. Can. Pet. Technol. 37, 55–62.
Sheppard, S., Mantle, M.D., Sederman, A.J., Johns, M.L., Gladden, L.F., 2003. Magnetic resonance imaging study of complex fluid flow in porous media: Flow patterns and quantitative saturation profiling of amphiphilic fracturing fluid displacement in
26
sandstone cores. Magn. Reson. Imaging 21, 365–367. https://doi.org/10.1016/S0730-725X(03)00140-1
Sok, R.M., Varslot, T., Ghous, A., Latham, S., Sheppard, A.P., Knackstedt, M.A., 2010. Pore scale characterization of carbonates at multiple scales: Integration of micro-CT, BSEM, and FIBSEM. Petrophysics 51, 379–387.
Soo, H., Williams, M.C., Radke, C.J., 1986. A filtration model for the flow of dilute, stable emulsions in porous media-II. Parameter evaluation and estimation. Chem. Eng. Sci. 41, 273–281. https://doi.org/10.1016/0009-2509(86)87008-7
Soot, H., Radke, C.J., 1986. A Filteration Model for the floe of dilute stable emulsions in porous media I. Chem. Eng. Sci. 41, 263–272.
Turuban, R., Lester, D.R., Heyman, J., Borgne, T. Le, Méheust, Y., 2019. Chaotic mixing in crystalline granular media. J. Fluid Mech. 562–594. https://doi.org/10.1017/jfm.2019.245
Turuban, R., Lester, D.R., Le Borgne, T., Méheust, Y., 2018. Space-Group Symmetries Generate Chaotic Fluid Advection in Crystalline Granular Media. Phys. Rev. Lett. https://doi.org/10.1103/PhysRevLett.120.024501
Xu, K., Liang, T., Zhu, P., Qi, P., Lu, J., Huh, C., Balhoff, M., 2017. A 2.5-D glass micromodel for investigation of multi-phase flow in porous media. Lab Chip 17, 640– 646. https://doi.org/10.1039/c6lc01476c
Yoon, K.Y., Son, H.A., Choi, S.K., Kim, J.W., Sung, W.M., Kim, H.T., 2016. Core Flooding of Complex Nanoscale Colloidal Dispersions for Enhanced Oil Recovery by in Situ Formation of Stable Oil-in-Water Pickering Emulsions. Energy and Fuels 30, 2628– 2635. https://doi.org/10.1021/acs.energyfuels.5b02806
Zhao, B., MacMinn, C.W., Juanes, R., 2016. Wettability control on multiphase flow in patterned microfluidics. Proc. Natl. Acad. Sci. U. S. A. 113, 10251–10256. https://doi.org/10.1073/pnas.1603387113
Zhao, X., Feng, Y., Liao, G., Liu, W., 2020. Visualizing in-situ emulsification in porous media during surfactant flooding: A microfluidic study. J. Colloid Interface Sci. 578, 629–640. https://doi.org/10.1016/j.jcis.2020.06.019
Zhou, Y., Yin, D., Cao, R., Zhang, C., 2018. The mechanism for pore-throat scale emulsion displacing residual oil after water flooding. J. Pet. Sci. Eng. 163, 519–525. https://doi.org/10.1016/j.petrol.2018.01.027
Zhou, Y., Yin, D., Chen, W., Liu, B., Zhang, X., 2019. A comprehensive review of emulsion and its field application for enhanced oil recovery. Energy Sci. Eng. 7, 1046–1058.
27 https://doi.org/10.1002/ese3.354
Highlights
• Synthetic porous medium was investigated at pore scale with micro-CT
• Oil recovery was quantified after water flooding and emulsion injection
• 3D images revealed the effect of trapping for oil ganglia and preferential paths for water
• Distribution of sizes and shapes of oil ganglia allowed quantifying the effect of emulsion injection
Declaration of interests
☒The authors declare that they have no known competing financial interests or personal relationships that could have appeared to influence the work reported in this paper.
☐The authors declare the following financial interests/personal relationships which may be considered as potential competing interests: