HAL Id: hal-02326755
https://hal.archives-ouvertes.fr/hal-02326755
Submitted on 22 Oct 2019
HAL is a multi-disciplinary open access
archive for the deposit and dissemination of
sci-entific research documents, whether they are
pub-lished or not. The documents may come from
teaching and research institutions in France or
abroad, or from public or private research centers.
L’archive ouverte pluridisciplinaire HAL, est
destinée au dépôt et à la diffusion de documents
scientifiques de niveau recherche, publiés ou non,
émanant des établissements d’enseignement et de
recherche français ou étrangers, des laboratoires
publics ou privés.
SAHARAN DUST ON FUERTEVENTURA ISLAND
(CANARIES): CHEMICAL AND MINERALOGICAL
CHARACTERISTICS, AIR MASS TRAJECTORIES,
AND PROBABLE SOURCES
G Coude-Gaussen, Pierre Rognon, G. Bergametti, L Gomes, B. Strauss, J. M.
Gros, M Le Coustumer
To cite this version:
G Coude-Gaussen, Pierre Rognon, G. Bergametti, L Gomes, B. Strauss, et al..
SAHARAN
DUST ON FUERTEVENTURA ISLAND (CANARIES): CHEMICAL AND MINERALOGICAL
CHARACTERISTICS, AIR MASS TRAJECTORIES, AND PROBABLE SOURCES. Journal of
Geophysical Research: Atmospheres, American Geophysical Union, 1987, 92 (D8), pp.9753-9771.
�10.1029/JD092iD08p09753�. �hal-02326755�
JOURNAL OF GEOPHYSICAL RESEARCH, VOL. 92, NO. D8, PAGES 9753-9771, AUGUST 20, 1987
SAHARAN DUST ON FUERTEVENTURA ISLAND (CANARIES):
CHEMICAL AND MINERALOGICAL CttARACTERISTICS, AIR MASS TRAJECTORIES,
AND PROBABLE SOURCES
1 1 2 2
G. Coude-Gaussen, P. Rognon, G. Bergametti, L. Gomes, B. Strauss,
J. M. Gros,
3 and M. N. Le Coustumer
4
Abstract. From April 12 to 19, 1984, dust was [Windom, 1975; Chester et al., 1979; Sarnthein et
collected by cascade impactor on Fuerteventura al., 1982] and, probably, to the mineral feeding
Island, 100 km from the Saharan coast. The sam- of marine plankton. The dust outbreaks from
ples were analyzed by X ray fluorescence spectro- northwestern Africa to the middle Atlantic and metry (elemental composition), by X ray diffrac- Western Europe have been much less studied. The
tion (mineral constituents), and by scanning only samplings were carried out during oceanic
electron microscope (SEM) and energy dispersive X cruises [Chester and Johnson, 1971; Parkin et
ray analyzer (EDXA) examination (shape, surface
al.,
1972] and the results were compared
to the
features, and mineralogy of particles), with the marine sedimentation [Tetzlaff and Wolter, 1980; aim of determining the possible source areas of Sarnthein et al., 1982]. On the other hand, thethe dust. On the scale of dust clouds, another fallout on the islands was not considered, except
method allowed us to define the displacements of in a short note about the sampling of dust on
the dust: using remote sensing (METEOSAT
II,
Tenerife island
[Fernandez-Navarro, 1921] and
National Oceanic and Atmospheric Administration another about the dust effects upon the under-
(NOAA)) and computing trajectories for any star- ground water chemistry in the Gran Canaria
ting or ending point at any time. These various [Logan, 1974].
methods gave complementary results and pointed A research project, supported by the French
out two successive episodes of dust with two Centre National de la Recherche Scientifique
different continental origins. The first ori- (CNRS), started with the purpose of characteri-
ginated from a nearby source in the Souss plain
zing Saharan
dust [Coud•-Gaussen,
1982, 1984;
(southern Morocco) and was characterized by very
Coud•-Gaussen
and Rognon, 1983]. Fuerteventura
fine quartz particles. The second drifted above Island (eastern Canaries) is a particularly inte-more remote calcareous regions. This study allows resting area for this study because aeolian par-
us to show how different methods can be used to ticles have been encountered in various silty
characterize dust and to find the source areas. deposits of surface formations: desert quartz,
The results suggest some general questions about allochthonous minerals, feltlike grains of fi-
the occurrence of coarse particles in the atmos- brous clays, etc. [Chamley et al., 1987]. Rela- phere and their role in the atmospheric deposi- ting to this project, dust samples were collected tion flux budget. from April 12 to 19, 1984, on Fuerteventura Is-
land. This island is 100 km from the Saharan
Introduction coast and, at that distance, the dust clouds
become a little more homogeneous than over the
So far, the studies on Saharan dust have most- source regions. Factory or city pollution is very
ly concerned the trajectories from the Sahelian scarce on this island. Moreover, the mineral
belt to either the Gulf of Guinea [Bertrand et assemblage coming from its volcanic substratum
al., 1974; Domergue, 1980] or the Caribbean Sea would be very different from ones of possible
[Carlson and Prospero, 1972; Glaccum and Saharan origin. The island climate is characteri-
Prospero, 1980; Sch•tz, 1980; Morales, 1979]. The zed by varied weather systems which are favorable
authors chiefly gave data on the size distribu- to Saharan dust transport. In winter, Fuerteven-
tion [Sch•tz and Jaenicke, 1974; Lepple, 1975; tura is on the southern boundary of cyclonic
Jaenicke, 1978; D'Almeida and Sch•tz, 1983], tracks. In the intermediate seasons the island is
mineralogy [Lange, 1982] and geochemistry [Delany on the trajectories of the polar outbreaks or
et al., 1967; Rahn et al., 1976] of the dust tropical thunderstorms along the discontinuities
particles and their effects upon the optical between marine and continental tropical air mas-
properties of the atmosphere [Carlson, 1979; ses. Finally, in winter or in summer the so-
Carlson and Benjamin, 1980]. These studies have called "Levante" wind may blow from southern
pointed out the possible contribution of dust to Morocco toward the Canaries. So, Saharan aerosols
the present or Quaternary oceanic sedimentation may be brought over Fuerteventura Island any time
during the year, as has been shown by both clima-
1Unit• Associ•e 722, Centre National de la tic data [Huetz de Lemps, 1969] and a statistical
Recherche Scientifique,
Universit• Pierre et
study on the year 1979 from the imagery given by
Marie Curie, Paris, France.
the GOES
East and METEOSAT
satellites
[01iva et
2 Laboratoire de Physico-Chimie
de l'Atmosph•-
al., 1983].
re, Universit• Paris VII, Paris, France. Our study tries to connect five distinct
3 M•t•orologie Nationale, Paris, France.
branches of natural
science: chemistry, mine-
4 Centre de G•omorphologie du Centre National
ralogy,
micromorphology, atmospheric physics,
de la Recherche Scientifique, Caen, France. and remote sensing. The complementary results arevery useful to understand the "behavior" of dust.
Copyright 1987 by the American Geophysical Union.
Thanks to these various methods, it is also pos-
sible to consider the different scales from the
Paper number 7D0504. elementary particle to the dust cloud.
0148-0227/87/007D-0504505.00 Chemical composition, mineralogy, and morpho-
9754 Coude-Gaussen et al.: Saharan Dust
•
calcareous
rocks
'•'
'"• aI[uv•um
'+•L•
siticeous
rocks
volcanic rocks:'-:'":•
high
mountain
100 Km EASTERN CANARY + + + + + + + + +Casab[anca
+ + + + + +
+ + + + + + + + + + + + + + + + + + + + + + + + + + + + + + + + + + + + + + + + + + + + + + + + + + + + + + + + + +• + + + + + + + + + + + + + + + + •- + + + + i- + + + + S at:i • t- + + + + ::::::::::::::::::::::::::::::::: -I- + + + + + + C.$im + + +'T'L'AN
T I
CRhir
ß - ...ATL
+ ++ + + + +
+ + + + + -+ + + + + + + + + + + + +i.++
+ + + + + + + + + + + + + +v•(•
LANZAROT
E
•
Pødet
Rosario
FUERTEVENTURA
•
c.J.y
S A H A R A
/
Fñõ. 1, gocal&zat&on map w&th 1&tholog&ca1 data.
logy of particles collected on Fuerteventura Nuclepore 0.4-•m filters have been used for im-
Island allowed us to separate the sampling period paction supports and final filtration.
into three phases. Two of these correspond to The collected samples have been successively
contributions of mineral dust from African arid analyzed by X ray fluorescence, X ray diffrac-
areas. These are separated by an interval with tion (XRD), and by scanning electron microscopy
low mineral concentrations which is characteris- (SEM). This order had been chosen on account of
tic of a mean oceanic situation. Among the pe- the more and more destructive effects of each
riods, corresponding to inputs of African dust, manipulation.
the first results from an outbreak coming from Elemental analyses (A1, Si, Fe, Ca, Ti, P)
the coastal Moroccan Atlantic Atlas. The dust have been performed by wavelength dispersive X
cloud was thick but very settled by a long travel
ray fluorescence spectrometry (Compagnie
G•n•rale
over the Atlantic Ocean. The second is more bound de Radiologies10), according to the method des-
to an air mass loaded with particles from Moroc- cribed by Elichegaray et al. [1981]. The sample
can and Algero-Moroccan regions, without a dust was placed in an irradiation chamber and the
outbreak event. excitation is produced by a X ray tube with a Cr
target. The sample was counted two times for at
Sampling and Analytical Procedures least 50 s on a proportional gaseous flux detec-
tor, using the Ks ray of each element. Total
The aerosol sampling was performed in a little countings were corrected for blank filter coun-
harbor called Puerto del Rosario (Figure 1). The tings. Analytical precision is better than 7% for
apparatus consisted of a five-stage cascade im- every analyzed element.
pactor EGAI 80 [Bergametti et al., 1983] and was Mineral components were identified using X
puF on a 20-m-high building. A nominal flow rate ray diffraction. Filters were lightly loaded, and
of 1 m3 h-1 was used during the sampling period,
it
was not possible to recover the grains either
which had a duration of 12 hours. No rains occur- by scraping the filter or by chemical dissolution
red during the sampling. of the polycarbonate filter for carrying out a
For this airflow the nominal size cutoffs powder diffraction. The X ray diffraction was ma-
(D50) are about 7, 3.5, 2, 1.25, and 0.5 •m for de directly on the filter by setting the point of
stages 1 to 5, respectively. Particles smaller impact of the dust particles in the center of a
than 0.5 Hm were sampled on a final filter; the vertical goniometer (Philips diffractometer PW
largest (> 7 •m) were collected qualitatively by 1130, using Fe -filtered Co Ks). Some filters we-
washing the wall of the first stage with alcohol re not perfectly flat, and it was necessary to
Coude-Gaussen et al.: Saharan Dust 9755 x 8/4 [o 12/4 12h GMT o 9/4 to 13/4 -F (hPa) •- ... 500 ... 700 ... 850 _, , , I _ 1000 Oh Oh Oh Oh -t + 10/4 to 14/4 ß 11/ 4 to 15/4 / / E(hPa) 500 ' _ 700
+•__•
-
• _..•...•
x
850
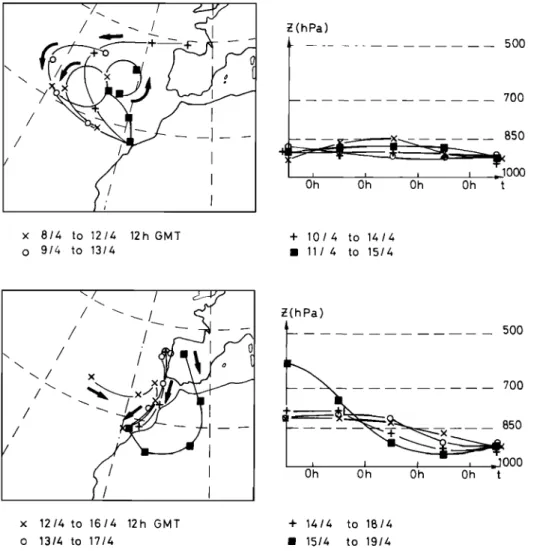
_ O0 I I Oh Oh Oh Oh t x 12/4 to 16/4 12h GMT o 13/4 to 17/4 + 14/4 to 18/4 ß 15/4 to 19/4Fig. 2. Trajectories arriving on Fuerteventura at 925 hPa from April 12 to 19, 1984.
(Left) Horizontal projection. (Right) Vertical section.
the filter. The X ray record of an unexposed cessed four times a day by the ECMWF (European
filter
shows a strong line between 4.5 and 5.7 •
Center for Medium-Range
Weather Forecasting). The
and reaches a maximum
at 5.10 •.
This area was
software allows us to compute trajectories
for
consequently unusable. any starting or ending point at any time. The
On the whole, XRD traces were correct, with vertical level is specified for the initial
some minerals giving narrow peaks (for instance, point, and the trajectories are computed taking halite, calcite, gypsum). However, small peaks account of the vertical velocity values given by
were difficult to measure, and we had some pro- the EC•F [Martin et al., 1984].
blems trying to determine some constituents, Seven trajectories arriving on Fuerteventura
particularly zeolites, which have three small at 925 hPa are reported in Figure 2. The arrival
peaks at 8.1, 4.07 and 3.18 •.
dates are each day between
April 12 and 19 at
Another problem affecœs the significance of 1200 UT. The trajectories' duration is 96 hours.
missing peaks when the filters are very lightly The 925-hPa level is selected for this first
loaded. In this case the nondetection of a major investigation because it is intermediate between
mineral might be due to the small amount of the lowest levels available on the ECMWF data
matter collected on the filter with respect to base.
the detection threshold of this mineral, rather At this stage, two periods seem to be well de-
than a total absence of it in the aerosol. This fined: one from April 12 to 16, of quasi-exclusi-
is the case, for example, of the sample collected ve oceanic influence, and another from April 17
during the day of April 14, which corresponds to to 19, with a possible continental origin.
the lowest air volume sampled over the whole
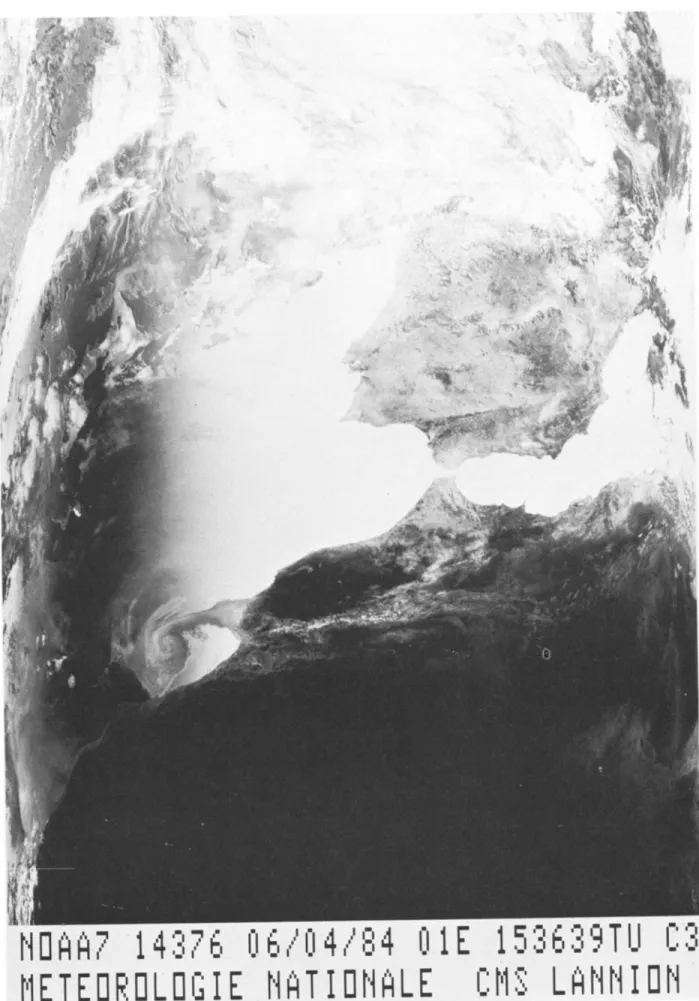
period, and for which the determination of cal- The Drift of Dust on April 6
cite is not possible.
The satellite images (Figures 3 and 4) show a
Trajectory Analysis dust cloud originating over the Sahara at about
9000 UT on April 6 and moving towards the Canary
Several trajectories were computed for the Islands until 1600 UT. Meteorological measure-
9756 Coude-Gaussen et al.: Saharan Dust .. '1• '-•" "'• '" . • •? :. • .•. ' • .... • •. • ..'- ... '•' "•'-"-*" f• •."" *'"'":-' • '.' ..: ""'; '" ... ,•-.• ... .- :... '::'"':':•"•' ** ß '- : ' '- *;:: .:' .':-...'•'. .... ...
:j,.tj
. ,;,:..:;..:...:...;.,-
-•: . :!•..•:.,.,
•,•:.:....•..
•
... - ..-:•?-'-.?
....
-.•
. :....,...;?.:.,,•.?:.,...•...,•:..,,..•.!..•-:
I½tF' . ,, ., .- .'-: .- '.'? :½ ' '•4 .... '.:... -' . ..*' ..2•:.'....::. ß ... "...',... '*..-.-"' ,: :"•:... ß •::. .... ,'•I., : ... -:.: ' ' '"' '-"'• , -:. '-:"::.• •'-. •..• *'-;":' .. ,' •. ' :': ':'. ":':':' :-.'•'.... ": ... '½ .".?" :-...:.. i•--' ':... -•."-....:. ' , •-'•:.-?.;: ' :-% •' ,¾' ':' .. '•,..•,. "' •:..:. :::.•'-: '"•"."!"* * '• ,•-:•. '"-::2.!..'.:"-.--..:. .... '-- :.2:-•-:;....•-..:..' "i.'•::t.. %.-.. ... ....;..'... ::' .. : ".':%:. '"':'"" '. .. ,,'.". :'::::... .'-•' .. ,a, .•4:- , -•.-:.*•." •: ..-:- •.1 "tit ... .7* '". .... "•"-::'..';.'".. .'..:.'.: •" - ' .'-'-•i,.':"...X:" .... ""..--:'.'-':•'.'-..-.'- " :.': ..: ... ':;:; .:.•....-' 4'7 . -"' • .• ':•:; .... ' .... -•!i'•;" '•' ?'.-'• '•::---.' '*:, -•,..c-:•::: :'"!:.:' --•., '-.*;,.."•:'•a .... '• -" ":- '- . 7:. '%:'-'"- ½'?". • ß !1.7•,"i:i.: ::.;:-:• '•'i.& '-,'... '". ":'-' '•-.. •-.-.': 7•:', - -' ... •' '"'" ':2 '*'
" .... ' •' :- "
..J•
'•;::., , • ...
' '" ':it-' • :•'';
.q!!:•:-'
*?/:::;i: ../.-.--'
,";,-r"
':½:"
7•;. ';' -.:.•:'27;::•
.:--,*.::•,•
...
-' ":::i:....'-,.
*-¾"'--,..
... "i½ ,..::.'
•'":'"-'.'-...
":::,.-- '-"-,.•: ?-'
"-; '. '...'C .... :::i-'7:'..,:'•-'t7-:':-?....'.,:,.--:
... ... ;:'"'•:;: ;'•':•":"':'•:--::,;:;:•:i•":-:•*.:•,:'•**.:.:;:-:,'...•.
'::4 ... .', :-- .. ":';'' ...
'"k•--'L'::/'.•::•,-;'-.2
.*... •!;:•.•:?:-:t?
"'- .7.. '-: ">'< ... ., ... r '.'•!:':' * ... :":"*'::" •' .... ':-'*- *."'"'•? "*' • ... *' '"• ... ' '"' ... •: ½ '* ' :'""*"4 ... ' ... - ... %•-•!:.*.zt ... ' ':. • .... , . f;'; .,. ,. -½.,½-..:.%;,..: - '•. '=:-- :•:'... **:•:..:.:[•:'-..•¾,.*..-:'-•.7":1•::,:.-: ... ' •:::. ' .-'. .... i!.:.-' .""i'.'. c•-.i".'•2 ".""',.,."---'"'" •:-:i.. '=-.•: '*•!i:'"•_'•i½: . .-.:. •;' -:.':' ':=:' ... Y:• ':': '. =':.•'-h•.. --'.-.%:-" ..'
...
• ..-. •. :- • • •.:•-*-?-
...
...' :<'---:
...
:;
...
• -:: •;•",•qp'-.,??
...
':':--,".•
'.?...
"-,1;,::.:•.
'.':'"::•.N•
•'-
:.... * :..
"::•'."•-.--;
I•;:..,*...?-
'". "'-",•:
,' •:---
- . . -i • :'- t- .: /,-. ,.•... •; t,• ... •::.•;& .:•:&:. :..-....:....,.,..•... • ....:....: .. :--:-...;• ... ..; .. . - .•.-::..•-....,,.:.z .... ' •-" '-,•.. ;::•- -:•.•.--::". :• '.. • .... .---•%....: ... •*'*--.:.•-!::. •i::' --i
,. '.-.
-....
,:-..•.
.:-.:•;..•...•..:
. ..• --2:. --,::...;
:: .--•a•:,-::-;•..•.?ß •....:..:
,?
;. ...?
..-.' ' f::....:'.G"•-'.--".;•.,...
.... ,-•...:.•...-,•:.•:-...:.•.;::•
.-' •:::---' '. ... -4: ... . .... !...
.:-::..:•-
...•-......
- . ...:::•....:
.:--...;:.:;:.--,•'
... .•..- .-• ... ß
.--,. ,:.... .......
•::?.•..
::.4....,-::....- ...
...,.:
...-•..,..-.
" •...•;.' .::. : • •"':.."".--:'-. •-•:; ---.'..' ' .-. •½'.:.-2::.- ,.::-v: ... ... '... '. 17'" ..' ."?-".' •" '- '• *: ;"•:.-: i-:-.:.: ... '. :":•:-:" . '"•.":'• ß ":" ' .":.". :::. ::'... ' ... '• :::' :'•; :. : :" • .... ?..-':..,?-/.'.:,•....;, •t; "- .... ß ... '" ' ,-;..".':;'.;' .,;...:..:'" ';;":' . ... . .... -.-: :½:..--,- .... ,'"-.-.-c'.,:,. •...: ' ..;.. ,-./ :•.•;•;•%... :•. ß
....
.:
•,•;:.
... ...
..•. ...
•.--.•:
....
•
1: .' :.:::
...
.-...,:
:.
•-
•-::
.... -
...
-.
:-
ß
.•
....
...:
....
:•::7 .:.. ß -'. ':•..•' •. .' .•.':•:•':'...;":,. * -. ,.. :%.-... '?'" '..•..?.:6: :•. *.: ... ...-c,?.-,/.:,..,'" .,...,....-'.. ... ,;': •.--. •:-e.:•. X-?.';'/":" .'.: *, "•.7 '"•...' !• (i"" ;'. .... ' :. "* .... .,:,':'•..;;•:::.... .:,..½::•?•:..' ;.. ;!::;;• 11::i .... ,--•.. ... ;.?.::,:.:...-.-- ...?: - ... ,! ... ,:.•--:.: ..<?:., ....,-•<4•:.;;.?. ... ;;•.-,,. ... ::.:-.,.,.,.--.. ß .:--.. '-.!:;..::::•i;•.•:--:';-•½,-(''.
• .'=.=2.
.'=i?72;.•?•
.... :-:::•ii • :.•?; ..../2'-'Z•<=,
½-,•:".,-':::' -•"
'...*12.
?" ..;i•..•!;;..:,...-i./•=i•
..:' ... ,. :';;:;•..- ....==.=.
....
*'-:'.===7/'7'•;=.•¾..;..::'•
.... :•...;.::•:' ,,, "', :.-.".:-e:...?.•
... !!...
:
'*"•-•;2½2:.!Z¾'•½•=-•'..-&;:?
... '"..7'. /..;•: -'• ;'::•;'•;:;;-::..:;...
.... :::**'. ':--'
='"2•:%.W'"
. ... '*-:-X-*-'"";.i.. '"
... "..' ....?'i•:=-•.==..
..'- .. :'"'-?:•:•."'
... =.'==.'
'::--' -.....
.::'...-.
: -'.,.,:' "•.-;:;•::•;•"f..' ;" 'i..:1;•..'9:::•:.' ..'f ::! .:. . ::•;•,":'::':;•i•:•:":::: .:...::...:'•2-• -'½•::;,:.;..•. ... ::.i' .•::•.•:.:•:...,..•:;!•::;c .... !,•i!•:--.'•:?:: ... 'i.-•....•:<t::' :...:.• ..w.::' ..:•:•:,.-:... •*'•--:':b :. '•'::•;- X?: .... "ß 'e½•.,.•
.. ," :,'."•" ..,-":':•-': •:::•':-.*.•; .... '" ....;'. --• "::::... ' :.• ... '--.-•:k.::::'":;':•:,,."•::' :'-: '" ::4. ' ' •:•'• "• .... o "..-' •"L',*;;* ... .• '•"".1. '"'.."•.-..,• .' -.::.:':'-".' ::-•,.. •-' ... •:.-•:'::•'• '.- -'-'**" ."•'l*'•
ß .t -."' :.::-:..-!.. I::•...• . •..: '.e:'•.:.,!:.. '"' :.•-:.•.'" :.: •:--.•'.•.'.•:• .--•..'..,,' ':73: "':.::::.z½;:.. :':-- ' •-- ::.. '...• -, :•...-•.:':•?•-': ;-..,t•.•- ::..'..:-:'"".•':-.•:--..'"'• .... a•:•'"...:'.•":i' '•." "*'-,'"•'
. # .-" ß ,:.-:'k,,.•: r ;., '½:r:'":x:-:{:., : ':•::• ,:--.-' .,.',.:. --'- ... ..'•: .,::•!:•'::' .... .o,;-.... -.*:::i&'.::': ::-- ... ' ' •,, .:. ".. :..- '• . '•..'•': ..--...,• '...-...•. '• -' *,..:•-.:..., .:...' :w.,..,.. , ;k-'...:.'k' -:-:' ..- -?:':•::-: -.•,._.F-,? ß -
' -' .' . ... "•:•" .•;" ....: ... •-,:... •-:"a-• "*• .... -.:: ;-:"•/• .... .•.--.-.• .::• .½•- .:.. -:.:..' ... '-•'-?.-.•:' :.•:,' .... •',., ::::. . ... .... -...•.,•;..;!,...:-,.,:*•...-'..,-.•...,..'...,:.::.'.--.:.. . * .•. -...,?- .-:;• .:-, ,•.. • .:.... /.•:::•.b'•;.•::**. ... •--.,1 - •. ... ..::.-::'.:, '• ..
. ..:' .-:i ".z½•' ½ .;?:6'.:.---?*::•:."..:. •:'•:::-•i:•i•'-"•" "..--! ... .,,,.." ;•::,,,,';:; ":•*'"'..:; "-"•;..--%-:•; "• ...'i..;...'":::• 0-.'•" "•-•;!:.-•-::i:.'-.•'.•.i.•'•.;",-:.::•':'"'- ' •'•.•-:::;.:; ... .* .... :" ':';':½; ... ;;:";;::!'"';': .,";!::•..•;;-!½,-, ": ' --;•.•%:..•'--;':'"" .7: . ' ::'•;:.?- :.?.• ' :7--::'-::-i::-;:.•.•," • ... '-. %.•' . .'
•' .,' :-:-::•:":. '• ;:.?-;ic':•/f"•*•.•*•:?.$::?•i.,::.., ... .c.. -•':,::i '.,.•?.'..i•.• :.:..? "• ... ' '":?•' ß ... '".':';';-'!X;:•'.--*:i: • ...
.-
.... ':'S
' .,:.
;i:-;,;:::;:;/$•i
':•'•;"'•':•,;:•i•'•i:;i::,:!:•-,.:.--.:,:•
'::-.-'e•'--'
:?:"
*.½"
•:';;•--;:•'•'.,
...
:'
'?";'
:::':'
... •'?•
"?;7,::.:/'
.'/';-
.:. - .::!: .' . ' ... :*'::: ..•';•!i•:•*:!;'" '$ .... ":•½.--'".:' ...;.' ß" .." '! . ':.":-:!:;:.' '? . .. '";;*.:;"'-;:.-.?:;:. ',: . •-•½i•' .:,": '...•-.::!: ":;:::•': ' !•":½•:i:' •-• " .:'.-,:?':•;::--':;:':.•:•:::.'::.-.; ... .-.,4•i;; .... ...'•;?::; '••::•;::i:;.i;½,: ' '" ":".•
[•,' ,::.,;;'
'%,!
....
:;•;•,•,::•,
...
.:•.:. . ...
.
...
..;%
;.::;::...:.
.:;:..
...
, ...
'<';;•,•
...
-•::?:!?,.,
'.'-' ':..•:;- - .• :;-:: '•,'.. '-- s:.•- ... -..:'%* ,•:•'" ... ".:.,.;.:,.-.::..:... "' :':k':'L . .:.::•.'•,.•::•.:•?" •;-::-" b..'- ;". .•' .' ß ß
**
.:.•:';;;•t.-. ,: ' ...
*'.'::';:•
.':'-
.,.c
..•-."•::'"-:..:,..--',:.".:•;
,• ..
?.•
...
•'•M
...
,•- ' .:•;....-....,-::
ß
.:' •: '
:.,'"'•'•:":'::'i;!i';!;.;...:.:-::
,/'
' -•
...
' ...
?'-":'::•:::.•:•*"':*" ..
?
'.
:: ,:,?:•-•..';:---.:....:.. .. •.... -:,:...-.,::• ,..,. ..,. .. ... .!:/;'-':, '":•i•:• -.2;?:'.:/*"':Q??'::%•:::'. "::,;..<:,"-• ,, :., .... -:':?"' i.:.% ::; '...l -!:: ... .:'.•.,". :':;a;t::.;if .... ' ... ß ... :;....' " ;"• •'- . '*: '" • :{:..?"::•': . ... ':': ':.'/-:!' :':.'*:'" .::::'•;i½i$,:•! •:: ..?:?•-:•';'½ii'. ::;.:' :e, *:;:,:•i•: •. .i ::'"'""•'-',.'..'•,
.;;:'"* j¾-:;•::*:::.;:...-.-.:.: .,.•t . if:;½;$*-*'<•S:•;:,; ... '%7,-.•,?. "' ...'. . .... .;', !•;;:• :i?; ;S." .;::;;. :•::' ,.. •.,.. :"•:..a; ,
IOA,'
METE
O6
E MATIBMALE Ct'l':.;:
LAMMION
....4/84
Coude-Gaussen et al.: Saharan Dust 9757
ME
'
•-' /04 '4 0
376 u 6
TEOR'OLOi].I'E
H,AT
I OH"ALE
•E •536:39TU
CS
C.
MS L.
ANH
I E
IN
Coude-Gaussen et al.: Saharan Dust 9759
z
9760 Coude-Gaussen et al.: Saharan Dust Starting points ß x 31 30N 12 30W + 28 10N 12 20W o2900N 1320W ß 30 20N g 30W •(hPa) ... 500
x •x
•
•x•
X
, ,, i , 1000ving eastward and the other westward. Finally,
one trajectory comes back to the Canaries area,
after a 6-day transportation over the ocean. It
is important to notice that this trajectory was
going upward during the first 60 hours, until the
750-hPa level. We obtain a similar frame by com-
puting trajectories beginning at 1800 UT. Conse-
quently, this dust is probably sub-Saharan layer
dust, and it seems to originate below the main
maritime air near its base. Thus it is possible
to explain highly divergent trajectories and the
mixed air mass character.
The Last Period
The April 17, 18, and 19 trajectories of Figu-
re 2 are computed in view of arriving exactly on
Fuerteventura; we also determined (Figure 6) four
trajectories arriving at about 170 km away from
Fuerteventura, to the north, east, south, and
west, on April 18 (170 km is chosen because it
is the typical dimension of a Gaussian puff at
the one standard deviation concentration level
after a 4-day transport). We can see that a
noticeable part of the air mass components over
Fuerteventura is unquestionably of Algerian and
Moroccan Sahara origin.
In summary, one can make out three periods
during the sampling experiment: (1) from 12 to 14
April the Canary Islands are under direct oceanic
influence, but they are also in the deposition
area of a dust cloud which originated on April 6
over the African continent (phase A); (2) on
April 15 and 16, oceanic influence only (phase
B); (3) April 17, 18, and 19, matching of con-
Fig. 5. Four forward trajectories from April 6,
tinental and oceanic origins (phase C).
1200 UT to April 13, 1200 UT, starting from the
dust cloud boundaries as determined by satellite
Elemental and Mineral Analyses:
(one plot every 24 hours). (a) Horizontal proJec-
Filter by Filter
tion. (b) Vertical section.
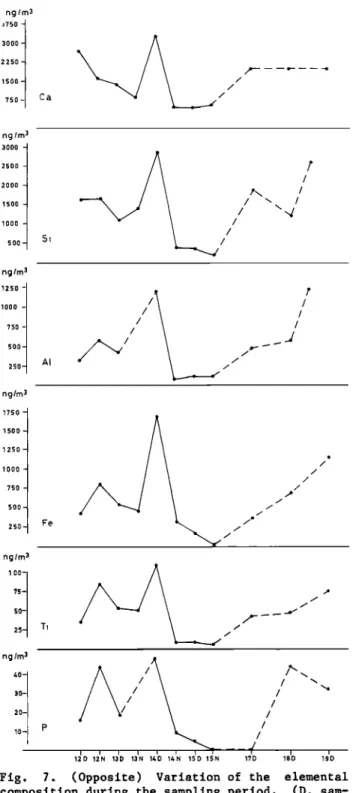
The concentrations of elements in aerosol sam-
0000 UT was 20 m s-1 (easterly); at the 700-hPa ples obtained by summing up all sizes for each
level, the wind is westerly. sample are plotted in Figure 7. If a similar
The NOAA 7 1536 UT images show a well-develo- variation for all elements can be observed during
ped vortex, the diameter being about 150 km. The
METEOSAT
cloud
between
images
Cape
show
Sim
the
and
genesis
Cape
Rhir
of the
at 0930,
dust
and
its motion
towards
Lanzarote
and
Fuerteventura
ß .islands at 1530. The vortex is probably born in a ß
stable air mass, in front of a very unstable
/
cold-air inflow. This cold front stands at a dis-
tance
about
400
km
away
from
the
Canary
Is
lands
until April 8, then vanishes. In a similar case
of February 1982, described previously [Oliva et
al., 1983], there was no warm airstream toward
the NE along the front. Thus the vortex was
probably generated locally, i.e., by thermal
(sea-land temperature gradient) and/or dynamical (due to the Atlas area orography) processes.
After 1530 UT, the evolution of the cloud can
no longer be determined by the satellite images,
and a simulated trajectory analysis is needed.
This analysis is reported in Figure 5. We compute
four forward trajectories during 7 days, from
April 6 at 1200 UT to April 13 at 1200 UT. The
starting points are selected as the limits of the
cloud seen by the satellite. The motion during
the first 12 hours is almost zero, then the cloud Fig. 6. Frame of the four backward trajectories
appears in a southerly stream after about 36 arriving at 170 km away from Fuerteventura on
hours with little difference. Then, a spectacular April 18, 1800 UT (starting on April 14 at 1800
Coude-Gaussen et al.: Saharan Dust 9761 ng/m3
3750
2250
1500
750-•
/ / ng/m 3 3000 2500 2000 1500 1000 5oo 5• / ng/m 3 1250lOOO
///
750 /5oo •-.,• /
250 / ng/m 3 1750 - 1500- 1250- 1000 - 750 - 500- 250- Fe ß / / / / /- ng/m 3 100- 75- 50- 25- T• ng/m 3//
/
/ /•o-
/
/
20- / lO P / [ i i i i l I•D 12'N 13D 13N 14'D 141N 15•D 15N 17D I•D 19DFig. 7. (Opposite) Variation of the elemental
composition during the sampling period. (D, sam-
pling from 0800 to 2000 UT; N, sampling from 2000 to 0800 UT.)
other hand, our highest values are comparable to
atmospheric concentrations obtained over the
North Atlantic Ocean and the Mediterranean Sea
during transport of mineral material from North
African arid regions [Chester et al., 1972;
Prospero and Carlson, 1972; Prospero, 1979 (for
Atlantic Ocean); Chester et al., 1984; Dulac,
1986; G. Bergametti (unpublished results, 1986)
(for Mediterranean Sea)].
Figure 8 illustrates the temporal variation of
Ca/Si ratios. These are very high (in most cases
larger than 1, i.e., a predominance of Ca concen-
trations versus Si ones). These values are grea-
ter than those obtained from abundances of the
elements in the principal types of sedimentary
rocks (between 0.08 and 0.10) and igneous basal-
tic rocks (0.131). Only carbonated rocks show
Ca/Si ratios greater than 1 (12.6) (data from
Turekian [1971]).
On the other hand, we observe that the Ca/Si
ratio values are opposite to those of Ca and Si
concentrations. The high values of Ca/Si during
the low-concentration period (B), suggest a pos-
sible and significant marine contribution for Ca
during this time.
However, the similar profile of variation for
Ca and crustal elements (A1, Fe, Si) during the
high-concentration periods (A and C) indicates a
major crustal component for Ca at that time. Thus
the Ca/Si ratios (which are between 1 and 2) in
these two continental periods could be associated
with a source region.
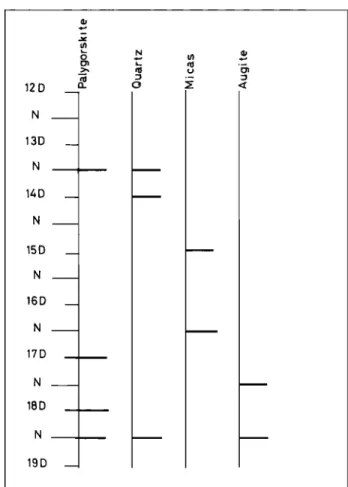
Mineral compounds identified by X ray diffrac-
tion are classified into three groups: (1) mine-
rals which appear only occasionally, i.e., paly-
gorskite, mica, and augite (Figure 9); (2) major
minerals (Figure 10) (A number code from 0 to 4
is given to each mineral according to intensity
XRD line. For each sample, this value is relative
to the sampled volume.); (3) minerals noted by
"occurrence" or "lack" (1 or 0 code), i.e., zeo-
lites, pyrolusite, and gypsum.
Some of these minerals are present all during
the sampling in low amounts: zeolite and pyrolu-
site are typical of volcanic rocks, and their
occurrence is probably indicative of local con-
tribution. Gypsum appears in impactor stages 2,
3, and 4 and may originate in part from the marl-
Ca/Si
2.5
the sampling period, their concentration range is
relatively large (more than 1 order of magnitu-
1.5
de). Thus the concentrations of Si and A1 ranged
from 210 to 2900 ng m-3 and from 85 to 1210 1
ng m-3, respectively.
The highest values are significantly greater
than the mean ones for the marine atmosphere: in 0.5
the North Atlantic, Duce et al. [1975] observed a
concentration range for aluminium between 8 and
\
\\
' '
I 14'D
I •Di•N
12D
12N
13'D
13N 14N
1
\ \ \ \ \ 17D 11•D 19D370 ng m-3 and Buat-M•nard and Chesselet [1979]
Fig. 8. Variation of the Ca/Si ratios. (D,sampling
obtained a mean value of 160 ng m-3 of A1 in the from 0800 to 2000 UT; N, sampling from 2000 to 08009762 Coude-Gaussen et al.: Saharan Dust
12D
•--
N 13D N ,,__., 140 _ 150 __ 16D __ 170 N 180 190 m N •ACCESSORY IqlNERAL CONSTITUENTS
Fig. 9. Episodic mineral constituents of aero-
sols during the sampling period.
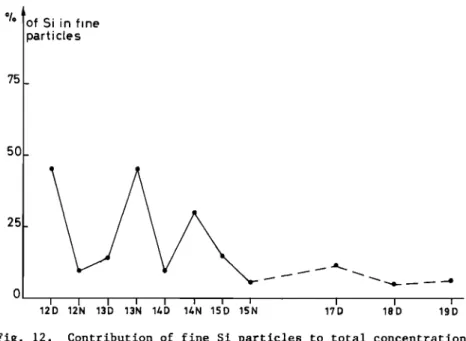
cles to the total concentration of Si, shows that
the fine component is significant only during
the first mineral period (A) and could be more
than 40% of the total collected mass of Si. At
the same time, X ray diffraction shows that only
palygorskite is associated with quartz. Their si-
multaneous occurrence suggests an allogenous
origin, which is confirmed by aeolian traces ob-
served on these grains by SEM (Figure 13).
2. The low elemental concentration period (B)
from April 14 to the day of April 16, shows
concentrations of Si and A1 which are very stable
and fall to 0.21 and 0.085 •g m-3, respectively.
These lower values are comparable to Atlantic
atmospheric "background." During this period the
A1/Si ratios become greater (> 0.47) than that of
the mean aerosol and are in the range of A1/Si
ratios for clay minerals. This result agrees with
the lack of allogenous minerals (palygorskite,
quartz), which were present during the preceding
phase, and by the abundance of mica (whose ac-
curate determination was hindered by the peak of
the filter). The SEM examination shows the pre-
ponderance of biotite in micas.
3. The last phase (C) corresponds to the se-
cond intensive mineral period, from April 17 to
the end of the sampling period. The elemental
concentrations are close to those obtained during
the first period. Size-differentiated A1/Si ra-
tios do not differ significantly from the mean
range for aerosols. Nevertheless, the C period
differentiates itself from phase A by the presen-
ce of augite from April 17 to 19 (whereas it is
not observed during outbreak phase A) and also by
a greater amount of calcite during the end of
sampling.
From April 17, among the other major species,
the XRD patterns show new, well-defined, and so-
metimes strong, peaks. These are present on all
recordings of the end of sampling. Occurrence of
ne source, as indicated by the presence of hali- ammonium sulfate has been confirmed by SEM. A
te, which is found in all filters (except the fi-
line at 3.88 • might be assigned to sulfur. These
nest particles). These four minerals form a kind minerals are regarded as anthropogenic. It is
of "background" and therefore are not useful for difficult to attribute an accurate origin to the
the identification of the source region of the other minerals.
transported dust. In conclusion, elemental and mineral analyses
On the other hand, considering elemental con- allow us to corroborate the meteorological study
centration levels and "episodic" mineral com- with regard to the origin of the sampled air
pounds, it is possible to distinguish three suc- masses. In addition, the occurrence of a charac-
cessive periods: teristic mineral in each of the two mineral pe-
1. During the first phase (A) from April
12
riods (A and C) and the variability
of the A1/Si
to the night of April 14, Si concentrations were ratios allow us to emphasize the different nature
always higher than 1 •g m-3 and A1 concentrations of the sources contributing to each mineral e-
were higher than 0.3 pg m-3, with a significant vent. Concerning these two mineral episodes, we
major peak during the day of April 14. Figure 1! try to display a specifically allogenous charac-
shows the variation of A1/Si ratios for the dif- ter of these dusts with the help of the analysis
ferent stages of the cascade impactor over the of the elementary particles by SEM and energy
sampling period. This ratio changes with particle dispersive X ray analyzer (EDXA).
size. Thus for this first phase the finest parti-
cles (corresponding to the backup filter of the SEM and EDXA Examinations:
c•scade impactor, i.e., particle diameter less Particle by Particule
than 0.5 •m) have an A1/Si ratio significantly
lower than that of mean aerosol, or even of mean Only the two periods of African contributions
soil. This indicates the occurrence of a compo- are of concern for the SEM and EDXA analyses. The
nent of fine Si particles which are not, for characterization of particle shape, surface fea-
their major part, associated with A1. The same tures, and mineralogy was emphasized by this
result obtained for the Fe/Si ratio allows us to grain-by-grain examination. It allows us to de-
assume that this granulometric range is essen- termine: (1) the processes resulting from aeoli-
tially dominated by fine quartz particles, which zation since the liberation from the source
have been observed by SEM examination. Figure 12, substrata; (2) the mineralogy of particles, in
Coude-Gaussen et al.: Saharan Dust 9763 O • \ / \ ¾ •o • • c • Z • Z • Z • Z • Z • Z • Z • o •u o o o .r-)
9764 Coude-Gaussen et al.: Saharan Dust o• [] w [] ß ß o oo • r'r' o r. • o LL:•Z ._•<• tJ') -• Z OZ
•o
[] o ß > E rib om 0 0 0 0 0 0Coude-Gaussen et al.: Saharan Dust 9765 ø/o ?5 50_ 25 o of Si in fine partictes
•
i
i
•
•
5IN
12D 12N 13D 13N 14D 14•N
15•D
1
I?D 18D 19Fig. 12. Contribution of fine Si particles to total concentration.
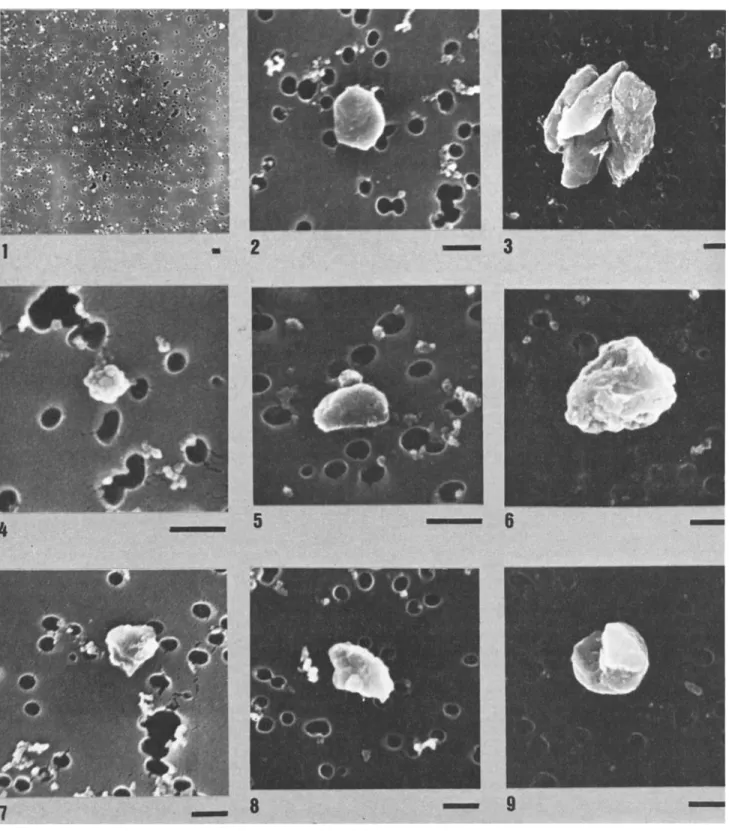
there is a chemical characterization by EDXA with At these sizes, most of the quartz grains have
SEM examination. a subrounded or rounded form (Figure 13-1), and
A particle is allogenous when its mineralogy their previous morphoscopical examination has
is different from that of the local substratum. often shown their stained and reddened characters
Our first aim is to display significant markers (Figure 13-5). Moreover, the SEM examination
of African and desert area origin for these indicates that on such grains there is a thicker
dusts, without relation to the island volcanic surficial silica film and a frequent coating by
substratum. In this one-by-one particle analysis, crushed palygorskite fibers, more or less spread
our examination concerns, on the one hand, the on the surface or trapped in quartz caries (Figu-
finest sizes deposited on the different filters re 13-6). Finally, rounded grains entirely compo-
and, on the other hand, the coarser grains di- sed of palygorskite are noticeable in the dusts
rectly sampled on the pump inlet funnel by alco- (Figure 13-8).
hol washing and filtration. These gold-plated Micromorphological interpretation. On one
samples were examined by Jeol JSM 2 SEM with hand, the shapes of the finest particles show a
energy dispersive system (EDS-Ortec). micromorphology of dust immediately loaded in
suspension by wind and without any trace of me-
Mineralogical Constituents of Each chanicai processes related to initial rolling and
Particle Size saltation. The irregular particles of varied form
can come from sand or rock blasting. Fluffy chain
Finest particles. The size of these particles aggregates are very common in aerosols [Julien et
is between 0.5 and 10 •m, mainly between 2 and 5 al., 1985].
•m. Three types of shape are seen: (1) shapes On the other hand, the shapes of the coarse
where mineral crystalline structures are always components are indicative of the previous shaping
occurring, for example, spindles of weathered and loading aeolian processes. For example, the
micritic (Figure 14-3), geometrical albite parti- mica chips have upturned and crushed edges (Figu- cles, Ca carbonate grains (Figure 14-5), AI-Ca re 13-7) related to mechanical impacts during carbonate grains (Figure 14-6), and silica (Figu- their mobilization and transport by wind. The re 14-4) or hematite (Figure 14-9); (2) fluffy rounded quartz grains' characteristics are also
chain aggregates with unknown mineralogical com- inherited from their previous desert "history,"
position, i.e., carbonated mixing, mixings of before their aeolian exportation to the Canary
carbonates and silica in the same proportions, Islands. Their stained and reddened aspects are
and alumino-silicated grains with K and Fe; (3) often used to describe Saharan sandy particles.
any form particles, i.e., alumino-silicated mi- In other respects the silica film on such grains
xings with K and Fe of rounded shapes, irregular has a well-known explanation, the surficial amor-
particles of varied carbonates, micaceous clays, phization of quartz by mechanical actions during
and quartz. the early grain saltation [Le Ribault, 1977].
Coarse grains. These, sometimes, exceed 100 Moreover, during these initial aeolian processes,
•m, but they are mainly between 20 and 80 •m. fibers of palygorskite, which is a very common
Generally speaking, the particles have a smooth clay in the limestone plateaus of the northern
and often rounded shape, with a few exceptions Sahara, were loaded on the quartz grains and al-
such as some angular quartz (Figure 13-2) and tered by impacts. Thus the occurrence of rounded
mica flakes. palygorskite particles is also a very good indi-
In the rounded shape components, Ca carbonate cation for the desert origin of the dust. Indeed,
and phosphate, iron oxide, and altered K feldspar such grains are wind-shaped from varied clayey
grains occur. There are also vegetal fragments, substrata of Sahara and exported beyond the de-
9766 Coude-Gaussen et al.: Saharan Dust