Design for structural and energy performance of long span
buildings using geometric multi-objective optimization
The MIT Faculty has made this article openly available. Please share how this access benefits you. Your story matters.
Citation Brown, Nathan C. and Caitlin T. Mueller. “Design for Structural
and Energy Performance of Long Span Buildings Using Geometric Multi-Objective Optimization.” Energy and Buildings 127 (September 2016): 748–761 © 2016 Elsevier B.V.
As Published http://dx.doi.org/10.1016/j.enbuild.2016.05.090
Publisher Elsevier
Version Author's final manuscript
Citable link http://hdl.handle.net/1721.1/118400
Terms of Use Creative Commons Attribution-NonCommercial-NoDerivs License
Design for Structural and Energy Performance of Long Span
Buildings Using Geometric Multi-Objective Optimization
Nathan Brown*a, Caitlin T. Muellera
a Massachusetts Institute of Technology, Building Technology Program, Department of Architecture, Cambridge, MA 02139, USA
* Corresponding author. Address: 77 Massachusetts Avenue, Room 5-418, Cambridge, MA 02139, USA. Tel. +1 814 404 9959. Fax. 617 253 6512. Email address: [email protected]
Abstract
This paper addresses the potential of multi-objective optimization (MOO) in conceptual design to help designers generate and select solutions from a geometrically diverse range of high-performing building forms. With a focus on the long span building typology, this research employs a MOO approach that uses both finite element structural modeling and building energy simulations simultaneously to generate optimized building shapes that are not constrained to regular, rectilinear geometric configurations. Through a series of case studies that explore performance tradeoffs of enclosed arches and static overhangs in different climates, this paper shows how MOO can yield architecturally expressive, high-performing designs, which makes the process more attractive to designers searching for creative forms. It also provides new insight into specific design responses to various climatic constraints, since optimization that considers both structure and energy can shift best solutions in unexpected ways. Finally, by displaying performance results in terms of embodied and operational energy, this paper presents new data showing how considerations of structural material efficiency compare in magnitude to total building energy usage. Together, these three contributions can influence current sustainable design strategies for building typologies that have significant structural requirements.
Keywords
Multi-objective optimization; conceptual design; embodied energy; operational energy; design tradeoffs
1. Introduction
In the conceptual design of buildings, many traditional optimization methods have seen only limited application, despite the emphasis contemporary designers place on building performance. This is largely due to the complex requirements of contemporary architecture, and the fact that human intuition and judgment are still central to the design process. Even as early as the conceptual design phase, architects must simultaneously consider and prioritize a multitude of interrelated design objectives, and while an increasing number of these objectives are quantitatively measureable, many are not. Two of the most important objectives related to building performance are the embodied and operational energy used in a building’s materials and operations, respectively. Often, the goals of reducing each of these quantities trade off with one another, as well as with other qualitative design goals, in unexpected ways.
1.1 Embodied and operational energy
In contemporary design, a high-performance, sustainable building has been identified as one that minimizes energy consumption throughout the four main stages of a building’s lifetime: materials manufacturing, construction, use and maintenance, and end of life [1]. The International Energy Agency estimates that buildings accounted for nearly a third of total final energy consumption globally in 2013 [2], a number which includes the substantial embodied energy of building materials as well as the operational energy used to keep buildings lit, heated, and cooled. The need for a reduction in energy consumption and carbon emissions due to buildings has been well documented. In light of this, a conceptual designer could simply convert every aspect of the design to a unit of
emissions and run a traditional optimization to find a single solution. However, in practice this would hamper the ability of designers to express preference, and also ignore financial constraints and other architectural complications that influence the development of a real building. As such, architects often find a pure performance optimization approach reductive, overly simplified, and deterministic, which can lead to resistance towards the adoption of optimization methods in design [3].
Furthermore, for long-span roofs and other large structures with specific spatial requirements, consideration of form can dominate the conceptual design phase. This is especially true because structural efficiency depends more on the geometry of a building than on material, sizing, and other building characteristics developed in later stages, and because structural material makes up a more sizable portion of the overall embodied energy. For example, De Wolf [4] found that the amount of embodied energy within a building’s 50-year lifecycle usage can range from 4-22% of the total. When considering carbon emissions instead of energy consumption, the embodied portion can rise to as high as 80% of total emissions, depending on which exact source is consulted. As shown by Kaethner and Burridge [5], the material contained in the substructure and superstructure can be responsible for over half of these embodied emissions.
With more emphasis on cutting operational energy usage while pushing towards net zero buildings, the embodied energy of future buildings will make up an increasingly larger portion of total energy usage over their lifetimes (Fig. 1) [6]. Consequently, this paper focuses on multi-objective optimization (MOO) with structural efficiency and operational energy efficiency as the two measurable objectives, since a MOO approach
gives the designer flexibility but encompasses the most significant quantitative performance goals of contemporary architecture.
1.2 Multi-objective optimization
Although MOO has demonstrated a greater potential than traditional optimization to assist conceptual designers in generating and deciding between high-performing, early-stage designs, it too has seen only limited use in practice. This lack of application can be attributed to the complicated model translation that must occur between design and analysis software, the often linear process in which members of a design team are only given small latitude to ‘optimize’ for their own performance goals without reference to other disciplines, and the difficulty of using optimization within a process that includes subjective preferences and design goals that are difficult to formulate numerically [7]. Related fields such as aerospace, mechanical, and other pure engineering design disciplines have been more successful than architecture in overcoming some of these obstacles [8]. The differences in scale, production, and customization of buildings when compared with airplanes or cars have contributed to a building industry that is more fragmented and mostly unexposed to optimization workflows. For a conceptual MOO procedure to become popular with building designers looking for original, expressive forms, researchers must overcome difficulties of non-quantitative objectives and disconnected disciplines while showing how an integrated process can lead to a diverse range of design outcomes that meet a variety of aesthetic preferences.
Many academic researchers have addressed the limitations of multi-optimization for use in conceptual design, but few have studied the strong link between architectural
form and different performance metrics simultaneously in a way that demonstrates the significant potential of MOO to influence the leading edge of architectural design. A large number of the major contributions in the field, which are described in detail and cited in the next section, have been restricted to geometries that are primarily made of rectangular boxes, which are easy to model in terms of energy usage. However, even within the typology of the long span roof, there are a wide variety of architectural forms and corresponding building shapes and structural systems that could be optimized for performance. In addition, researchers have been largely unable to define a clear way for architects to interact with MOO data, which can include performance feedback from multiple engineering disciplines in different units and scales, in a way that leads to good design decisions. In order to have greater impact on innovative and creative architectural practices, it is important to develop methodologies that effectively navigate meaningful tradeoffs and produce design examples that are applicable to a wider range of building geometries.
In response, this paper demonstrates how MOO can be used to generate geometrically diverse architectural design solutions in different climate regions through three case studies of buildings with long span roofs. Since selecting the right building shape and form in the early stages has a large effect on the overall success of a building with demanding structural and spatial requirements, the case studies focus on these large-scale conceptual design decisions.
The optimization method in this paper uses simulation to focus simultaneously on both the embodied energy found in structural material and the operational energy of the building. The case study results are presented in terms of overall energy requirements,
but the embodied and operational components are kept independent since the two are not always equal when time, financing, and other practical realities of construction are taken into account. These results demonstrate the utility of separating structural efficiency (primarily upfront emissions and cost) and operational energy efficiency (emissions and cost over time) in optimization for conceptual design, as well as showing the effect of the two separate objectives on architectural form. Overall, this paper illustrates how the application of MOO can yield a wide range of expressive, high-performance designs, provides increased awareness of how architects might respond to particular climates while designing long span buildings, and contextualizes structural efficiency within the broad goals of sustainable design.
2. Literature review
2.1 Optimization for structure or energy
This research builds on a wide body of existing scholarship concerning the integration of visual criteria into optimization algorithms, geometry optimization for building performance, and multi-objective optimization in architectural design. A brief overview of major contributions is given here, beginning with research that focuses exclusively on either structure or energy usage. Mueller and Ochsendorf [9] created structureFIT, which is a browser-based conceptual design tool that allows users to progressively express preference by selecting parent structures for the next iteration of an interactive evolutionary algorithm. Coley and Schukat [10] optimize lighting and space conditioning systems to minimize overall energy usage and set up a system to present optimal designs for aesthetic evaluation. Caldas and Norford [11] find that energy optimization problems can be used to generate designs that minimize capital and
operating costs, emissions, or maximize thermal comfort. Wang et al. [12] apply a multi-objective genetic algorithm while considering lifecycle cost and lifecycle energy usage as different objectives. Asl et al. [13] establish and test an optimization method for whole building energy performance and daylighting. Magnier and Haghighat [14] use surrogate modeling and genetic algorithms to optimize a building design for thermal comfort and operating energy. Karatas and El-Rayes [15] optimize for operational energy performance, social quality of life, and lifecycle cost.
2.2 MOO with global building geometry variables
Other researchers have applied MOO to building design with significant geometric design variables. Marks [16] explores shape optimization for minimizing initial building cost and annual heating cost for a variety of building plans. Khajehpour and Grierson [17] optimize commercial buildings for minimum capital and operating cost and maximum income, as well as for profitability and safety [18]. Suga et al. [19] generate Pareto-optimal solution sets for window design optimization with energy consumption, cost, uniformity, and draft performance as objectives. Tuhus-Dubrow and Krarti [20] use a genetic algorithm to optimize for lifecycle cost in a conceptual building, but they also consider the relationship between operational and embodied energy when compared across climates. Diakaki et al. [21] propose a multi-objective approach to optimizing the window type, wall insulation material, and wall insulation thickness of a building for costs and savings. Fialho et al. [22] investigate the effects of varying building materials and orientations on construction costs and energy efficiency using a multi-objective optimization algorithm. Basbagill et al. [23] extend MDO methods by using probability distribution functions to support sequential conceptual design
decision-making for an H-shaped building. Negendahl and Nielsen [24] explore folded facades while optimizing for energy use, capital cost, daylight distribution and thermal indoor environment.
2.3 MOO for structure and energy
Additional existing research proposes workflows that allow designers to explore different structural shapes while also optimizing for energy or other objectives. Von Buelow [25] aims to combine performance feedback from a variety of simulation programs (structural, lighting, acoustical) with aesthetic preferences in design through the use of interactive evolutionary algorithms. By breeding designs that have different fitness functions and storing multiple alternatives in a searchable, graphical database, von Buelow’s proposed workflow gives designers the opportunity to pursue multiple design objectives and visualize tradeoffs between them. Flager et al. [26] propose a framework for automating the prototyping, simulation, and analysis tools required to run an optimization, and then use this framework to optimize a classroom design for structural cost and lifecycle energy cost. Krem et al. [27] demonstrate how the position of a structural core and the shape of the floor plan in a high rise building affects its energy and structural performance differently depending on the climate and location of the building. Quaglia et al. [28] use parametric modeling and performance simulations to generate an optimal solution set for the design of origami-inspired, rapidly deployable shelters. Mendez Echenagucia [29] presents shape optimizations for a number of competing performance objectives, including acoustics, structural efficiency, and energy efficiency.
2.4 Unmet needs: geometric diversity, knowledge of tradeoffs, and context for structural optimization
This paper adds to the existing knowledge of multi-objective optimization for structure and energy in a number of ways. First, it employs MOO on structural typologies and building shapes that are not primarily rectangular, demonstrating that the technique, which involves both structural finite element and energy surface models, can be used on more expressive architectural designs. While testing generalizable, known architectural problems, this research also generates diverse results that may be structurally, geometrically, and architecturally interesting. In different climates, the optimization results are often surprising or unexpected. Finally, this paper compares structure-energy tradeoffs in absolute energy units, which contextualizes structural efficiency and presents a fuller picture of how structural optimization can influence architectural forms even while emphasizing overall design sustainability.
3. Methodology
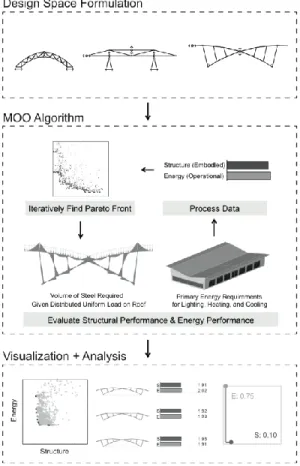
To demonstrate the capabilities of MOO in the conceptual design of long span structures, three case study models were developed and analyzed. The procedure for testing the case studies included the development of a parametric design space, using a MOO algorithm to find the Pareto front of best performing designs, visualizing the results in a way that designers can easily compare between samples, and analyzing the overall data across different forms and contexts (Fig. 2). The design lessons learned from the combination of these three case studies could be applied to a variety of architectural programs that contain large, open, conditioned volumes, such as airports, convention centers, or stadiums.
3.1 Problem selection
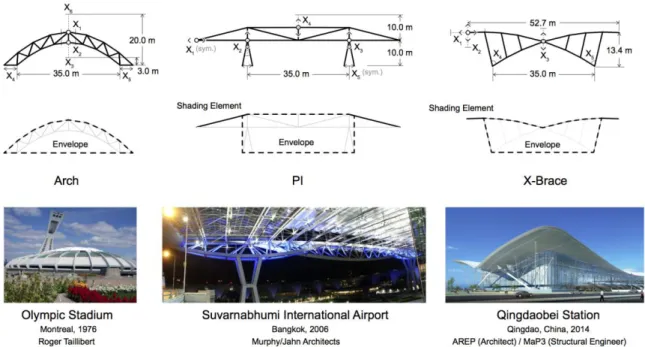
While demonstrating the potential of a multi-objective optimization framework for conceptual design, this paper seeks to explore two generalizable architectural problems that trade off between structure and operational energy. The first problem is the enclosed arch, where a higher arch rise can lead to greater structural efficiency, but also results in greater interior volume and envelope surface area. The significance of this architectural problem is demonstrated by a spirited debate about the Montreal Olympic Stadium (Fig. 3) [30] between the engineer Anton Tedesko and architect-engineer Frank Moffet in a 1976 issue of Civil Engineering, the journal of the American Society of Civil Engineers [31]. Tedesko, with support in later letters from Professor David Billington of Princeton University, argued that the architecturally arbitrary form of subtly sloped cantilevers required massive section sizes and wasted material, while Moffett commented that the lower slope results in operational energy savings [32]. Although the argument was never resolved, modern optimization techniques and performance simulations can address this tradeoff quantitatively.
The second architectural problem is the cantilevered overhang, which can allow for efficient shading strategies in certain climates and orientations, but may require more structural material to build. Roof overhangs are common architectural elements, and have been used as a passive cooling strategy since ancient vernacular dwellings [33]. Overhangs have many different functions, including protecting an open window from wind and rain or providing a covered entrance in the case of a transit terminal, but their influence on building energy usage can be substantial: a case study by Raeissi and Taheri [34] shows that an optimized static overhang design lead to a 12.7% reduction of cooling
loads with only a marginal increase in heating loads. However, when overhangs are formed by a large cantilevered structure, such as in the Suvarnabhumi Airport [35], they can substantially affect the amount of structural material required by a design, creating a tradeoff similar to the enclosed arch. These two architectural problems can also be explored simultaneously, as in the example of the Qingdaobei Station in China, a bus terminal completed in 2014 [36].
3.2 Design space formulation
The performance implications of the enclosed arch and the cantilevered overhang are explored through three different long span building case studies. The first design is an enclosed, trussed arch, which can vary in terms of truss depth, overall height, and two skew parameters. This design has no large windows, as would be the case for a hangar, warehouse, roller skating rink, or possibly the main span of a sports arena. As a result, the optimization isolates the pure arch rise tradeoff between structure and energy without interference from daylighting effects. Although the geometry of the case study is an extruded arch, a revolved arch or dome, such as the Montreal Olympic Stadium, would show the same tradeoff. The second design is a ‘PI’ structure, which contains two columns and a spanning truss that cantilevers past the columns on both sides, resembling the Greek letter. Although the parameterization of this design creates a few opportunities for other small performance tradeoffs, it primarily studies how designers might choose an appropriate overhang configuration for optimal daylighting performance. The last case study is the ‘x-brace’, which consists of a three-hinged arch supporting cantilevering roof beams through a series of vertical struts, inspired by the Qingdaobei Station. The x-brace geometry studies both the arch and overhang tradeoffs simultaneously.
In each of these designs, the main two-dimensional structural system is arrayed longitudinally, with transverse beams spanning in between the arches, PIs, and x-braces to create the enclosed volume. Since all of the case studies have a long main span, there is free interior floor space between the supports, allowing for easy occupant movement and a variety of interior programs. For each of the case studies, the total floor area remains constant at 3,500 m2. The decision to parameterize different structural and envelope geometries while treating floor area as a given parameter realistically represents the typical architectural process, in which the programmatic area requirements would drive the design. This value, rather than conditioned volume or another metric, would be most important to both the client and architect. As such, the energy usage metrics given in the results section are normalized by floor area.
In the PI and x-brace cases, the enclosure consists of a panelized curtain wall system that mixes regularly spaced transparent glazed panels with spandrel glass panels concealing interior insulation. This configuration captures the effects of geometric changes on both natural daylighting and heat transfer through the building’s envelope. The arch enclosure contains no glazing and is entirely insulated. A parametric model of each design was generated in Rhinoceros [37] and Grasshopper [38] based on a number of global geometric parameters, which are given in Table 1. To prepare for evaluation of both structural and energy performance, the model included linear elements representing steel structural members, as well as surfaces representing the exterior envelope of the building. An abstraction of the structural steel geometry is used to represent the overall building shape in the results section. The enclosure boundary for each case study
approximately follows the line of the main structural elements on the outside of each truss, excluding the overhangs.
Arch PI X-Brace
Variable Range Range Variable Range
x1 Top Skew -2.5 m < x < 2.5 m Overhang Length 1 m < x < 15 m Starting Edge Height 12 m < x < 21.3 m x2 Bottom Skew -2.5 m < x < 2.5 m Left Column Height 4 m < x < 10 m Starting Overhang Length 7.6 m < x < 12.2 m x3 Height of Lower Chord 3 m < x < 10 m Right Column Height 4 m < x < 10 m Starting Hinge Height 7.6 m < x < 15.2 m x4 Left Width at Support 0 m < x < 6 m Truss Height 0 m < x < 10 m Angle Arch A -0.150 rad < x < 0.150 rad x5 Right Width at Support 0 m < x < 6 m Column Width 0.25 m < x < 1 m Angle Arch B -0.150 rad < x < 0.150 rad x6 Truss Depth 0 m < x < 10 m N/A N/A N/A N/A
Table 1. Design space variables for each case study
Four different model locations were selected for simulation to test how optimal building forms change for different climates. These four locations represent the main world climate zones as described in Köppen-Geiger classification: cool, temperate, arid, and tropical [39]. The cool location, Boston, has both heating and cooling loads but is heating dominated. The second location, Sydney, is in a temperate climate zone where the required cooling load is slightly higher than Boston’s, but the heating load is very small. The arid location is Abu Dhabi, which has no heating load but is dominated by cooling loads that are roughly five times higher than those required by Boston and Sydney. The selected tropical location is Singapore, which is also dominated by high temperatures year-round. However, the average high temperatures are less extreme than in Abu Dhabi and do not swing as much either monthly or daily. A summary of these climate characteristics is given in Table 2. Each model was simulated with a west-east orientation of the longer axis, allowing for maximum daylighting effects on the north and south sides of the building where the majority of windows are located. When placed in different climates, the structural performance does not change—however, the way in
which structure trades off with operational energy is different, as is the best energy form for each location.
Climate Characteristics
Abu Dhabi Boston Singapore Sydney
Köppen-Geiger BWh DFa Af CFa
IECC Climate Zone 1 5 1 3
Latitude 24.43 N 42.37 N 1.37 N 33.95 S
Longitude 54.65 E 71.03 W 103.98 E 151.18 E
Elevation 7 m 6 m 15 m 6 m
HDD18 54 3,134 0 751
CDD10 6,417 1,609 6,664 2,922
Heating Design Temp (oC) 13 -14 23 6
Cooling Design Temp (oC)
(Dry Bulb) 43 31 32 29
Table 2. Climate characteristics for each case study location. Values from [40]. 3.3 Performance evaluation
The performance of each design was measured using Grasshopper plug-ins that enable simulations using Rhinoceros geometry as an input. The structural optimization objective was to minimize the amount of steel required, and the energy optimization objective was to minimize the annual operational energy of the building, which includes requirements for lighting, heating, and cooling. Formally, the optimization problem is defined as:
min 𝑱(𝒙), where (1)
𝑱(𝒙) = [𝐸𝑒(𝒙) 𝐸𝑜(𝒙)]
Ee(x) = embodied energy of steel structure
Eo(x) = building operational energy
𝒙 = [ 𝑥1
⋮
There are no constraints on the problem except for the variable bounds and the internal code checks of the structural evaluation. To convert the amount of steel into embodied energy, the mass of each design was multiplied by an embodied energy coefficient. Although the model generates idealized operational energy loads already in the correct energy units, these loads were converted to primary energy requirements using assumed equipment and transmission efficiencies. The conversion processes for both embodied and operational energy are explained in greater detail in Section 3.5.
Structural performance was quantified using Karamba [41], a finite element analysis tool embedded in Grasshopper. Dead load, symmetrical live load, and asymmetrical live loads on each side of the structure were all considered as part of combination structural load cases. The values of these loads are given in Table 3, and are broad and appropriately conservative in keeping with assumptions that are made in practice for structural form generation in early stage design. To calculate the overall weight of structural material, Karamba’s sizing optimization feature (OptiCroSec) was used. This feature applies a procedure for steel beams according to Eurocode 1993-1-1 to check if a section is sufficient for the axial, bending, torsion, sheer, and buckling loads imposed on each member. It then searches through a structural section library to determine the smallest member that can adequately handle each load before outputting the total weight of the structural system. This process is done iteratively for statically indeterminate structures, where an initial cross section is first chosen to calculate section forces in each beam. The whole sizing procedure is described in more detail in the Karamba User Manual [42].
A number of simplifying assumptions were made to the structural model to reflect the level of analysis typically used by conceptual designers in practice. Drift limits and lateral loads were not considered for the structural evaluation, since this paper emphasizes the governing gravity load cases and sizing for a low-rise, long span roof. Lateral loads could be taken up by another system determined in a later design phase, such as shear walls or braced frames. The structural evaluation also does not account for global buckling effects, such as lateral torsional buckling, since it is assumed that the main spanning system represented by the model could be braced by out of plane members. Nevertheless, the overall model is a reasonable approximation for structural performance in conceptual design, provided that these additional issues are considered and checked as the design is refined.
Structural Model Assumptions
Steel Beam Elements
X-Brace and PI: Wide Flange Beam Sections Arch: Round Hollow Steel Sections
Dead Load 7.18 kPa
Live Load 3.48 kPa
Load Cases
Dead Load
Dead Load + Full Live Load Dead Load + Live Load applied
asymmetrically to each side
Table 3. Modeling assumptions for the structural models.
The energy evaluation was performed using Archsim [43], a Grasshopper plug-in that connects Rhinoceros geometry with EnergyPlus [44], a widely used energy analysis and thermal load simulation program made available by the U.S. Department of Energy. Archsim assigns material properties to each surface of the model, creates thermal zones, and runs a whole-year simulation, returning the total amount of energy required to keep the building appropriately lit and temperature-controlled for an entire year. This model
accounts for both solar and temperature effects. The envelope assumptions were created based on an International Energy Conservation Code (IECC) compliant building in each of the separate regions [45]. Other model settings were based on ASHRAE standards, including required heat recovery effectiveness, mechanical ventilation rate, and lighting power density (Table 4). Although ASHRAE 62.1 specifies a minimum combined outdoor air rate of 4.1 L/s/person for “transportation waiting”, airports and related buildings could contain spaces with other uses and occupant densities, such as “retail”, which requires a combined 7.8 L/s/person [46]. As such, a conservative assumption of 7 L/s/person was used for the case studies. To allow for direct comparison of architectural form across climates, assumptions about structural loads were held constant.
Energy Model Assumptions
Abu Dhabi Boston Singapore Sydney
Roof R-Value 3.67 K*m2/W 4.52 K*m2/W 3.67 K*m2/W 3.67 K*m2/W Wall R-Value 2.29 K*m2/W 2.75 K*m2/W 2.29 K*m2/W 2.75 K*m2/W Window U-Value 2.84 W/K*m2 2.16 W/K*m2 2.84 W/K*m2 2.61 W/K*m2
Window SHGC 0.25 0.40 0.25 0.25
Window-to-Wall Ratio 0% for Arch / 30% for PI and X-brace
Schedule Equipment, lighting, ventilation all on (Airport Usage)
Heating Set Point 20o C
Cooling Set Point 26o C
Mechanical Ventilation 7 L/s/person
Heat Recovery Sensible, 50% recovery effectiveness
Infiltration 0.1 ACH
Occupancy 0.2 p/m2
Equipment 12 W/m2
Lighting Power Density 12 W/m2
Daylighting Continuous dimming, 500 Lux Target
Table 4. Modeling assumptions for the energy models. Values from [40] , [45], [46].
3.4 Optimization method
selecting the best design based on designer preference. These include using a priori articulation of preferences, where a composite weighted objective function is created at the outset, a posteriori optimization articulation of preferences, where the designer chooses from a number of equivalently optimal designs after an optimization has been run, and interactive articulation of preferences, where a designer gives input while the algorithm is running [47]. This paper contains sets of solutions that would be presented to a designer as part of an a posteriori process.
Specifically, the multi-objective genetic algorithm NSGA-II (Non-Dominated Sorting Genetic Algorithm II) [48] was used to iteratively approach the Pareto front over multiple generations of design alternatives. This algorithm starts with a population of design samples, evaluates their performance, and breeds the next generation through crossover and mutation between the highest performing designs. The NSGA-II also employs a diversity-preservation mechanism to ensure a representative spread along the entire Pareto front, and uses the concept of elitism to speed up computation. Because the algorithm is stochastic, there is no guarantee that the exact Pareto solution will be found, but this method has been demonstrated to perform well on a wide range of engineering problems. The algorithm was implemented within the Grasshopper platform using the open source JMetal library [49]. This implementation was then applied to each of the parametric models to approximate the Pareto front of the objective space. For each case study, the algorithm used a generation size of 50 and was stopped at a maximum of 20 generations due to computational constraints. This generation size led to non-dominated sets of approximately 10-40 designs across the different case studies, which clearly show the transition of building geometries along the Pareto front between the best structural
and energy performers. Since the variables in the design problem are continuous, the automated algorithm for finding the Pareto front is more computationally practical than an exhaustive search and produces a higher resolution on the front per total number of evaluations than a sparse sampling method.
Fig. 4 shows an example of this implementation of the NSGA-II by indicating successive generations of solutions with increasingly darker points. As the algorithm runs, it gradually moves in objective space from a random cloud of performances towards a set of Pareto optimal points. In addition to the NSGA-II optimization, the best structural solution for each case study was computed using the gradient-free, deterministic algorithms available in Goat [50]. The ability of the NSGA-II to locate a near structurally optimal design at one extreme of the Pareto front varied across the case studies, and thus the independently determined structural optimum is also presented in the results.
Although a range of theories exists concerning how to select the best design out of a given Pareto front, this research presents the entire fronts without a single chosen solution. It is assumed that in an architectural application, designers would be tasked with selecting a final design while relying on additional inputs, priorities, and preferences that exist outside of the optimization problem itself. Thus, the entire Pareto set represents a final result of the MOO process.
3.5 Data processing
For direct comparison, the results of each performance simulation are normalized by the constant enclosed floor area, and are thus presented in GJ per m2 for both the embodied energy of the structure and the annual operational energy. To calculate the embodied energy of the structural system, the weight of the sized steel structure was
multiplied by an embodied energy coefficient provided by Hammond and Jones [51]. The operational energy simulation results are given in Joules, but require a conversion from idealized lighting, cooling, and heating loads to primary energy requirements. The efficiencies and coefficients of performance used in this paper match those detailed in Bourgeois et al. [52]. These conversion assumptions are given in Table 5.
Conversion Assumptions
Embodied Energy Coefficient for Steel 24.4 MJ / kg
Heating Assumptions 85% Site Efficient
10% Transmission Losses Cooling Assumptions Coefficient of Performance - 3
33% Conversion Efficiency
Lighting Assumptions 100% Site Efficient
33% Conversion Efficiency
Table 5. Assumptions for conversion to embodied and primary energy. Values from [51]
and [52].
4 Case study results
4.1 Shape and location of Pareto fronts
The performance and optimization results for all three case studies are presented in this section. Fig. 5 gives the Pareto front found by the algorithm between the two objectives for each structural configuration and location. In each of these plots, a single design generated at any point during the algorithm is represented as a grey circle, while the Pareto optimal points are colored black. In a few cases, these plots display one or two additional Pareto points than were not returned in the last generation of the NSGA-II, but were included in the overall dataset and determined to be Pareto optimal during post-simulation analysis. Since results are normalized and given in GJ per m2, all plots have the same aspect ratio and can be compared directly, although the locations of the axes change based on the specific climate and structural system being modeled. For
conciseness, this results section will often refer to embodied energy simply as structure, and operational energy as energy. Thus, structural efficiency refers to performance on the horizontal axis, and energy efficiency refers to performance on the vertical axis. The general directions of left, right, top, and bottom within this established coordinate system will be used to explain performance throughout this section.
In order to provide context, Fig. 6 shows each of these Pareto fronts on the same plot. In this figure, the performance of the structurally optimal solution for each set is represented by an asterisk (*). Since structure is independent of location, the structurally optimal solutions are always stacked vertically. In some cases, the NSGA-II algorithm was able to generate a solution on the approximate Pareto front close to the optimal; in other cases it was not. The distance between the highest performing structural solution in each generated set and the overall structural optimum is signified by a dotted line. For each structural system, Singapore had the highest energy loads, followed by Boston, Abu Dhabi, and Sydney. The lowest required structural material was found in the arch, and the highest amount of structure was required by the x-brace. This trend generally indicates that the arch, PI, and x-brace are ranked in order from most to least structurally efficient.
Although each case study demonstrates a tradeoff between structure and energy when a minimum is desired for both, the shape of this tradeoff changes substantially in different contexts. In a few of the plots, there is a gradually sloping curve indicating that the building geometry is transitioning between equally affected performance objectives. In other cases, the Pareto front appears to be nearly horizontal, indicating that the embodied energy of the structure changes more significantly than the operational energy
of the building within the optimal set. This is especially true for the PI structure, although a horizontal front occurs in the other systems as well.
In horizontal Pareto front cases, a designer aiming for the best performing geometry would likely select from the solutions farthest to the far left of the front. In the different PI locations, this far left point trends near the structural optimum. However a near horizontally Pareto front could also simply indicate a weakness of the evolutionary approach and its ability to find optima at an extreme edge of performance space. In the cases where there is a flat Pareto front approximation and a structural optimum that performs much worse in terms of energy than the entire approximation set, the actual Pareto front is not flat. Rather, the structural optimum is far away enough in the design space from the rest of the high-performing designs that an evolutionary process is unlikely to find it.
On the other extreme, the Singapore x-brace Pareto front is sharply vertical, with only a small ‘hook’ towards a few solutions that are slightly better in terms of energy but much worse in terms of structure. This shape indicates that geometric differences have a larger effect on the energy performance than on the structure. Intuitively, this Pareto front shape is more likely to occur in a climate dominated by large energy loads rather than in more temperate locations.
When the Pareto front is sloped sharply in both axes, there is an easily identified ‘knee point’. A wide variety of definitions exist for this term, but broadly speaking, a knee point requires an unfavorably large sacrifice in one objective to gain a slightly better performance in the other objective [53]. As such, it is almost always a preferred solution if it exists in a bi-criteria optimization problem, although this is not necessarily the case
when taking aesthetic and other architectural conditions into account. Due to their prominence as preferred solutions in pure optimization problems, the geometries of various knee points will be discussed in the next section. Often in this paper, the clear knee point performs almost as well structurally as the optimum, but the energy performance of the actual structural optimum is sharply worse than the designs nearest to it on the generated Pareto front.
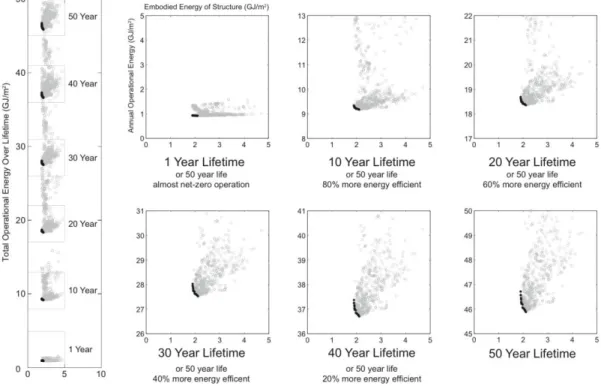
It is important to consider that the shape of the Pareto front of these conceptual designs can be stretched or compressed depending on design assumptions. For example, Fig. 7 shows structure plotted against simple, entire lifetime energy requirements for different building lifetime assumptions in a typical structure-energy optimization. These Pareto front shapes, which appear nearly flat when only one year is considered but spread out for longer lifespans, stand in contrast with those presented for annual energy requirements in the rest of the paper. For buildings with longer lifetimes, the Pareto front stretches vertically, illustrating the increased significance of operational energy in total lifecycle usage. Similarly, these same plots could each show a 50-year lifetime building, but with different assumptions about the efficiency characteristics of the envelope and mechanical systems. As building specifications and codes move towards net-zero operating design goals, future conceptual design tradeoffs may become flatter in the energy axis even when the entire lifecycle is considered, increasing the importance of embodied energy in the overall sustainability of a structure.
4.2 Geometric implications
Although objective space plots provide valuable insight into the behavior of parametric models, it may be more useful to a visually conscious designer to view the
geometric configurations of high-performing designs. Fig. 8 provides samples of changing geometry along the Pareto front for each case study and location. Although the number of designs in each Pareto optimal set varies, five representative samples from each set are displayed using a 2D visualization of the structural geometry. The visualizations are arranged from the most structurally efficient design at the top to the most energy efficient design at the bottom. For reference, each design’s performance is plotted in black and illustrated by the gray bar graphs located to the right of each glyph.
In the arch case study, there are clear tradeoffs in both the depth of the truss and the overall height of the structure. Each of the locations produces a solution on the far left of the Pareto front that looks visually comparable to the structurally optimal solution. However, the most energy efficient solutions vary widely. In Abu Dhabi, Boston, and Singapore, the arch truss depth and height decrease when moving towards more energy efficient solutions. This minimizes interior conditioned volume and envelope surface area at the expense of a deeper, higher sloped, more structurally efficient design. On the other hand, the Sydney arch becomes larger towards the energy efficient side of its Pareto front, which maximizes its surface area. Sydney’s climate is mild enough that although the cooling loads are more substantial than the heating loads, the cooling set point in the model (26 degreesCelsius) is above the outside air temperature most of the time during the year. However, a building’s cooling system in Sydney must still offset the heat loads due to people, equipment, and other interior elements that produce heat. In this context, a greater surface area allows for more exchange with the cooler outside air, which ultimately lowers annual cooling loads.
It is possible that certain climates have a tall arch as the most energy efficient Pareto solution and others have a shallow arch because the structurally optimal configuration is generated by truss depths and heights located in the middle of their variable ranges. Thus, it is possible to get structurally worse performance on both sides of the optimum, either by making the arch too tall or too shallow. In Abu Dhabi, Boston, and Singapore, the structural performance gets significantly worse as the truss depth and arch rise go to minimum values. However, there is a sharp knee point in the Pareto front for the hot climates, which Fig. 8 shows to occur at a design that is visually near the structural optimal, but also slightly smaller in terms of surface area and volume.
In the PI configuration case study, the NSGA-II is also able to find near structurally optimal solutions, but the overall nature of the transition to most energy efficient design changes for different climates. The parameterization of the PI model allows for similar tradeoffs in truss depth compared to the arch, but because the surface area of the envelope changes only slightly with a deeper truss, this single variable has much less ability to influence the overall magnitude of operational energy requirements. Especially in Abu Dhabi, Boston, and Sydney, the Pareto fronts are nearly horizontal, suggesting to a designer that there is little energy penalty for finding a more structurally efficient solution. Although Abu Dhabi, Boston, and Singapore all trend towards a shallower truss while moving right along the Pareto front, there is a notable difference in the overhang dimensions between the hot and cold climates.
In Boston, the overhangs remain fairly close to the building envelope, indicating that structural efficiency, daylighting potential, and helpful solar gains outweigh the benefits of static shading. In terms of architectural program, a large overhang over an
entrance or airport drop-off lane may actually decrease the energy efficiency of the design in these climates. The situation in Abu Dhabi and Singapore is the opposite—a large overhang cuts out solar gains and leads to lower cooling loads and greater overall efficiency. Sydney’s more energy efficient solutions share this characteristic of larger overhangs, but the effect is visually insignificant compared to the increased height and surface area of the best energy performers. Overall, Sydney’s best PI energy solutions rely on taller columns to increase surface area, rather than greater truss depth.
The PI case study also shows the positive performance effects of asymmetry and lean. Due to the combination of dead and live structural loading being modeled, a structurally optimal solution is always symmetrical, and there is a potentially significant structural penalty to be paid for introducing asymmetry into the system. However, the energy implications of shading, solar gain, and daylighting may push the Pareto optimal solutions towards asymmetry in a bi-objective optimization. In each modeled case study, the left side of the structure (when looking at the 2D visualization) faces south, and the right side faces north. In Abu Dhabi and to a lesser extent Singapore, the most energy efficient solutions lean noticeably to the south, which leads to smaller wall and glazing areas and more effective shading on the south side of the building that sees the most sun. This result stands in contrast to the arch case study, where there are no windows and consequently no substantial solar gains or daylighting opportunities, leading to symmetrical solutions.
The x-brace model allows for a combination of arch and overhang effects to influence its form. In each climate, the combination of these effects leads to a gradual transition between best structure and energy performers. The structurally optimal solution
is a symmetrical, tall x-brace with highly curved spanning structural members. Although the best x-brace structural Pareto solutions are a significant distance away from optimal in a few of the climates, each generated front curved towards the structural optimum, rather than having a sharp hook like in other examples. In Abu Dhabi, the geometric transition is subtle and difficult to visualize, as all of the solutions are relatively shallow, will small surface areas and shading edges that curve down towards the windows they protect. Singapore, which is also in a hot climate, shows a similar response. However, the transition in Boston is much more noticeable, as the main arch members become less curved while moving down the front. The flatter shading elements allow more sunlight to enter, which can help offset the dominant heating loads in Boston. In Sydney, the main structural members also become flat but at a higher angle, which generates much taller walls and windows. Again, this leads the Sydney best energy performers to have a higher overall surface area and volume than in other climates.
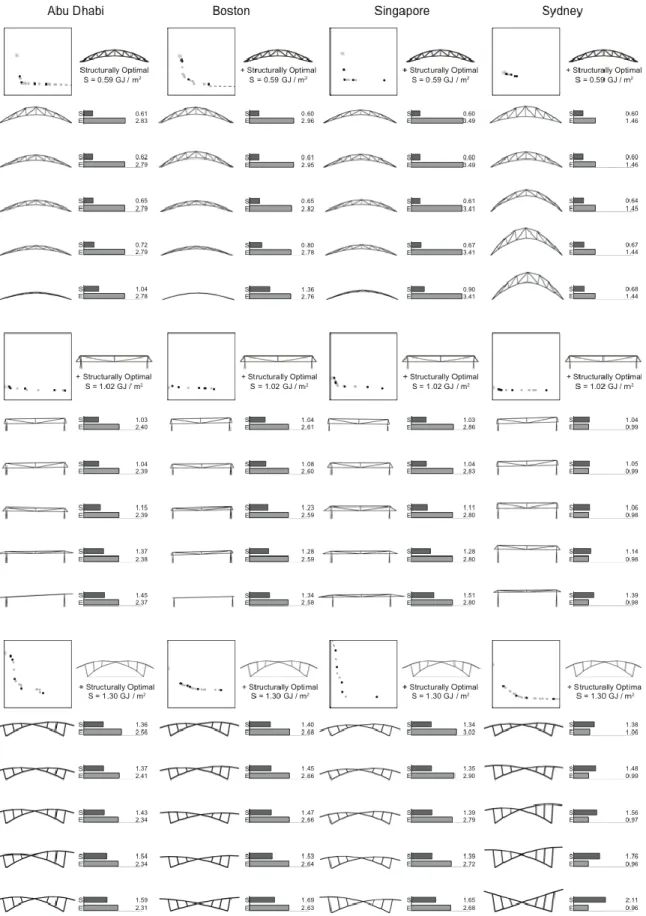
Although these geometric transitions happen gradually along the Pareto front, even at a resolution approximated by a population size of 50 designs, the contrast between structural and energy high performers is more noticeable when considering only the edges of the Pareto front. Fig. 9 shows the best structure and energy performers generated for each case study, while also giving an indication of the performance range of the front in absolute units. From these images, it is clear that the first three climates prefer energy solutions with smaller envelope surface areas, while Sydney prefers the opposite. Large overhangs have the most substantial effect on Abu Dhabi and Singapore, but are not found in the Pareto optimal set for Boston. Asymmetry is also most prominent in Abu Dhabi, which is consistent with its increased sensitivity to solar effects.
The Pareto sets for the PI structure have large ranges of structural performance with only minimal changes in energy. There is no similar trend for the other two systems, as the relationship between the structure range and energy range changes for different climates. When considering the entire modeling results, there is a substantial amount of geometric diversity among the optimal solution sets, as well as a significant difference in the design responses to varying climates.
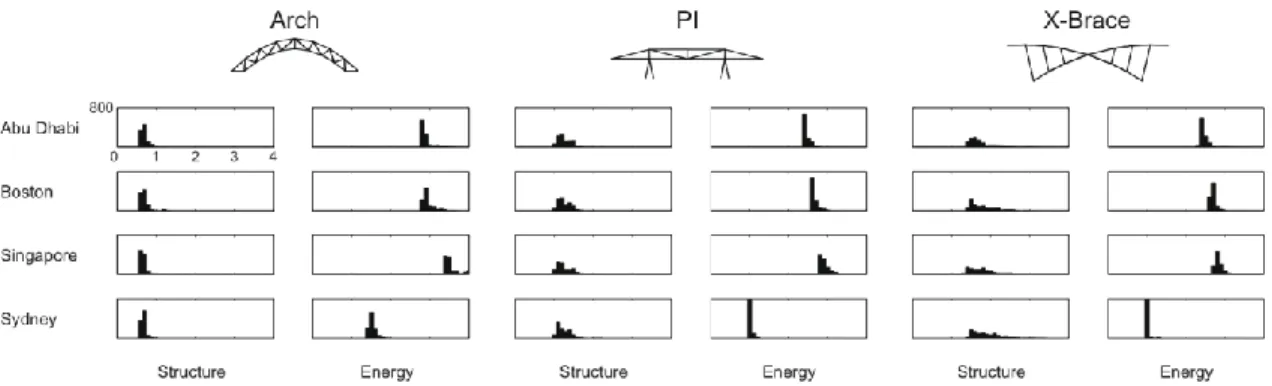
4.3 Frequency of solutions
The methodological choices of the research presented in this paper have some influence on the design results, and a brief discussion of the optimization method is given here. In the performance evaluations for each model, the structural calculation was a finite element analysis of linear elements and occurred almost instantaneously. The annual energy simulation required substantially more time—although actual computational time depends on hardware, on a standard desktop computer each design simulation took around 15-20 seconds. Including some computational time for the implementation of the NSGA-II, this resulted in overall runtimes of around 12 hours for each case study in each context. As such, the case studies were generated for a finite number of 20 generations rather than until a certain threshold for change in performance was reached.
Fig. 10 shows a histogram of the performance results for every solution generated through the course of the case studies. In some of the structural configurations, the NSGA-II was able to find the zone of high performance solutions within a few generations. The ease with which certain problems could be mapped is indicated by the large spike in frequency of solutions near the edge of optimality; after an initial random
seed of the entire design space, sometimes as many as 800 of the 1,000 solutions considered throughout the entire process fell within the best interval of the histogram. In other cases, the more gradual trend towards optimality indicates a higher degree of computational difficulty in surveying the objective space for a given architectural problem. This observation is important to keep in mind when considering which tradeoffs can be most effectively navigated through the use of multi-objective optimization techniques.
5. Discussion and summary of contributions
This paper makes three key contributions to the broad goal of encouraging optimization in integrated conceptual design for high-performance buildings.
First is the demonstration of how a multi-objective optimization methodology for structural efficiency and operating energy efficiency can be used to generate a geometrically diverse range of high-performing designs. The results of the various case studies presented in this paper show that although finding expressive architectural forms and setting up an intelligent design space requires designer intuition on the front end, a MOO approach can push high-performing solutions in interesting, unexpected ways. With contemporary computational tools that generate rapid performance feedback in conceptual design, this process can already be integrated into a typical design workflow. As future theoretical advances are made and software develops, the ease of using MOO interactively will only increase. At the same time, the complexity of these results also highlights the role a designer plays throughout the process, as a human must prioritize design goals and consider visual impact. In this way, optimization in design does not
have to be reductive or overly constraining to a creative architect—it can be used as a sophisticated tool to support decisions rather than make them.
Second, there is value in the broad lessons of the case studies concerning the relationship between geometry and performance. As can be seen by the wide variety of Pareto optimal results, the precise nature of tradeoffs between structure and energy are not always intuitive, and they are extremely sensitive to context. However, by restricting this research to the architectural typology of a long span building and selecting problems that are common to this typology, many of the geometric lessons learned through this study could be applied to future designs.
Third, this paper presents new data showing how considerations of structural material efficiency and embodied energy compare in magnitude to total building energy usage, and how this knowledge affects sustainable design strategies. The case studies in this paper show that structural embodied energy and annual operating energy requirements are on the same order of magnitude, with slight variations due to structural system and location. This is a simplified comparison that does not include all other embodied energy in the building, allowances for renovations, changing equipment efficiencies, or many other details that would be included in a full lifecycle energy analysis. Nevertheless, the absolute energy comparison shows that at current building code levels and reasonably long building lifetimes, structure is entirely overshadowed by energy. Yet as future buildings reach increasingly stringent energy efficiency standards, structure may become the dominant objective in MOO methodologies for particular building types.
5 Future work and concluding remarks
This research could be extended in a number of ways. One next clear step is to look at tradeoffs in terms of monetary cost in addition to energy usage. Although cost and energy are largely correlated, the nature of specific tradeoffs could fundamentally change with this different perspective. Analyzing cost in addition to energy could also allow for more specific study of the effects of upfront costs and price changes over time on optimized architectural form. In addition, there are many aspects of the energy model that could be added into the parameterization. Although this study focused on changing geometry, the effect of envelope attributes, mechanical system efficiency, and even energy modeling assumptions could be explored in an MOO workflow. Similarly, efforts could be made to use more area-specific coefficients for material and energy production, as opposed to the broad, standardized assumptions used in this paper. Additional design objectives such as constructability could be added to the MOO process, either quantitatively if possible or at least articulated in the discussion of user-evaluated design criteria. Any of this future work could use similar case studies to build on the results of this paper, or focus on new problems that are relevant to architectural design.
In conclusion, this paper is an initial step in demonstrating how MOO can be applied to geometrically, architecturally interesting conceptual design problems, leading to diverse, high-performing results that are difficult to generate through other means. This contribution has the potential to encourage more widespread and effective use of optimization in sustainable conceptual design, which can yield significant improvements in the overall performance of future buildings.
Acknowledgements
The authors are grateful to Professor John Ochsendorf for his assistance in selecting and formulating the case studies. The authors would also like to thank Jonathas Felipe for his contributions related to the development of a multi-objective optimization tool for Grasshopper.
References:
[1] C. Bayer, M. Gamble, R. Gentry, and S. Joshi, AIA Guide to Building Life Cycle
Assessment in Practice. Washington, D.C.: The American Institute of Architects,
2010.
[2] “Transition to Sustainable Buildings,” International Energy Agency, Paris, France, 2013.
[3] ACADIA, “Call for Submissions,” in Computational Ecologies: Design in the
Anthropocene, 2015.
[4] C. De Wolf, “Material quantities in building structures and their environmental impact,” S.M. Thesis, Massachusetts Institute of Technology, 2014.
[5] S. Kaethner and J. Burridge, “Embodied CO2 of structural frames,” The Structural
Engineer, pp. 33–40, 2012.
[6] I. Sartori and A. G. Hestnes, “Energy use in the life cycle of conventional and low-energy buildings: A review article,” Energy Build., vol. 39, no. 3, pp. 249–257, 2007.
[7] F. Flager, A. Adya, and J. Haymaker, “AEC Multidisciplinary Design
Optimization: impact of high performance computing,” CIFE Tech. Rep. #TR175, no. December, 2009.
[8] J. Agte, O. De Weck, P. Arendsen, A. Morris, and M. Spieck, “MDO : assessment and direction for advancement — an opinion of one international group,” Struct.
Multidiscip. Optim., no. 40, pp. 17–33, 2010.
[9] C. T. Mueller and J. A. Ochsendorf, “Combining structural performance and designer preferences in evolutionary design space exploration,” Autom. Constr., vol. 52, pp. 70–82, 2015.
[10] D. A. Coley and S. Schukat, “Low-energy design: combining computer-based optimisation and human judgement,” Build. Environ., vol. 37, no. 12, pp. 1241– 1247, Dec. 2002.
[11] L. G. Caldas and L. K. Norford, “Genetic algorithms for optimization of building envelopes and the design and control of HVAC systems,” J. Sol. Energy Eng., vol. 125, no. 3, pp. 343–351, 2003.
[12] W. Wang, R. Zmeureanu, and H. Rivard, “Applying multi-objective genetic algorithms in green building design optimization,” Build. Environ., vol. 40, no. 11, pp. 1512–1525, 2005.
[13] M. R. Asl, M. Bergin, A. Menter, and W. Yan, “BIM-based parametric building energy performance multi-objective optimization,” Educ. Res. Comput. Aided
Archit. Des. Eur. 32, vol. 224, pp. 1–10, 2014.
[14] L. Magnier and F. Haghighat, “Multiobjective optimization of building design using TRNSYS simulations, genetic algorithm, and Artificial Neural Network,”
Build. Environ., vol. 45, no. 3, pp. 739–746, 2010.
[15] A. Karatas and K. El-Rayes, “Optimizing tradeoffs among housing sustainability objectives,” Autom. Constr., vol. 53, pp. 83–94, 2015.
[16] W. Marks, “Multicriteria Optimisation Energy-Saving Buildings,” Build. Environ., vol. 32, no. 4, pp. 331–339, 1997.
[17] G. Khajehpour and D. E. Grierson, “Method for conceptual design applied to office buildings,” J. Comput. Civ. Eng., vol. 6, no. 2, pp. 83–103, 2002.
[18] S. Khajehpour and D. E. Grierson, “Profitability versus safety of high-rise office buildings,” Struct. Multidiscip. Optim., vol. 25, no. 4, pp. 279–293, 2003.
[19] K. Suga, S. Kato, and K. Hiyama, “Structural analysis of Pareto-optimal solution sets for multi-objective optimization: An application to outer window design problems using Multiple Objective Genetic Algorithms,” Build. Environ., vol. 45, no. 5, pp. 1144–1152, 2010.
[20] D. Tuhus-Dubrow and M. Krarti, “Genetic-algorithm based approach to optimize building envelope design for residential buildings,” Build. Environ., vol. 45, no. 7, pp. 1574–1581, 2010.
[21] C. Diakaki, E. Grigoroudis, and D. Kolokotsa, “Towards a multi-objective optimization approach for improving energy efficiency in buildings,” Energy
Build., vol. 40, pp. 1747–1754, 2008.
[22] A. Fialho, Y. Hamadi, and M. Schoenauer, “Optimizing architectural and
structural aspects of buildings towards higher energy efficiency,” in Proceedings
of the 13th annual conference companion on Genetic and evolutionary computation, 2011, pp. 727–732.
[23] J. P. Basbagill, F. L. Flager, and M. Lepech, “A multi-objective feedback approach for evaluating sequential conceptual building design decisions,” Autom. Constr., vol. 45, pp. 136–150, 2014.
[24] K. Negendahl and T. R. Nielsen, “Building energy optimization in the early design stages : A simplified method,” Energy Build., vol. 105, pp. 88–99, 2015.
[25] P. von Buelow, “Paragen: performative exploration of generative systems,” J. Int.
Assoc. Shell Spat. Struct., vol. 53, no. 4, pp. 271–284, 2012.
[26] F. Flager, B. Welle, P. Bansal, G. Soremekun, and J. Haymaker,
“Multidisciplinary process integration and design optimization of a classroom building,” Electron. J. Inf. Technol. Constr., vol. 14, pp. 595–612, 2009. [27] M. Krem, S. T. Hoque, S. R. Arwade, S. F. Breña, and M. Asce, “Structural
configuration and building energy performance,” J. Archit. Eng., vol. 19, no. 1, pp. 29–40, 2013.
[28] C. P. Quaglia, N. Yu, A. P. Thrall, and S. Paolucci, “Balancing energy efficiency and structural performance through multi-objective shape optimization : Case study of a rapidly deployable origami-inspired shelter,” Energy Build., vol. 82, pp. 733–745, 2014.
[29] T. Méndez Echenagucia, “Computational Search in Architectural Design,” Ph.D. Thesis, Politecnico di Torino, 2013.
[30] Wikipedia_User:Tolivero, “Olympic Stadium (Montreal),” Wikipedia, 2006. [Online]. Available:
https://en.wikipedia.org/wiki/Olympic_Stadium_(Montreal)#/media/File:Le_Stade _Olympique_3.jpg.
[31] A. Tedesko, “Experts Slam the Olympic Structures of Montreal,” Civ. Eng. -
ASCE, vol. 46, no. 12, pp. 50–54, 1976.
[32] H. F. Sommerschield, J. A. Bacci, H. Rusch, H. M. Stoll, F. C. Moffet, D. P. Billington, and A. Tedesko, “Letters: Montreal olympic structures,” Civ. Eng. -
ASCE, vol. 47, no. 4, pp. 5–36, 1977.
[33] Z. Zhai and J. M. Previtali, “Ancient vernacular architecture: characteristics categorization and energy performance evaluation,” Energy Build., vol. 42, pp. 357–365, 2010.
[34] S. Raeissi and M. Taheri, “Optimum Overhang Dimensions for Energy Saving,”
Build. Environ., vol. 33, no. 5, pp. 293–302, 1998.
[35] Wikipedia User: Wikigod, “Suvarnabhumi Airport: Inner courtyard and terminal structure by night,” Wikipedia, 2009. [Online]. Available:
https://en.wikipedia.org/wiki/Suvarnabhumi_Airport#/media/File:Suvarnabhumi_ Airport_Bangkok_by_Night.jpg.
[36] MaP3, “In Progress: The Qingdaobei Station / AREP Architect + MaP3 Structural Engineering,” arch daily, 2014. [Online]. Available:
http://www.archdaily.com/439741/work-in-progress-the-qingdaobei-station-arep-architect-map3-structural-engineering.
[37] Robert McNeel & Associates, “Rhinoceros.” www.rhino3d.com.
[38] Robert McNeel & Associates, “Grasshopper.” www.grasshopper3d.com.
[39] M. Kottek, C. Beck, B. Rudolf, and F. Rubel, “World Map of the Köppen-Geiger climate classification updated,” Precip. Climatol. Wetterdienst, Dtsch., vol. 15, no. 3, pp. 259–263, 2006.
[40] ASHRAE, ANSI/ASHRAE/IESNA Standard 90.1-2004. Energy Standard for
Buildings Except Low-Rise Residential Buildings. Atlanta, GA, 2004.
[41] C. Preisinger and Bollinger-Grohmann-Schneider ZT GmbH, “Karamba.” Bollinger-Grohmann-Schneider ZT GmbH, Vienna.
[42] C. Preisinger, “Karamba User Manual for Version 1.1.0.” pp. 1–127, 2015. [43] T. Dogan, “ArchSim.” .
[44] D. B. Crawley, L. K. Lawrie, F. C. Winkelmann, W. F. Buhl, Y. J. Huang, C. O. Pedersen, R. K. Strand, R. J. Liesen, D. E. Fisher, M. J. Witte, and J. Glazer, “EnergyPlus: Creating a new-generation building energy simulation program,”
Energy Build., vol. 33, pp. 319–331, 2001.
[45] International Code Council, International Energy Conservation Code. Section C402 Building Envelope Requirements, 2012.
[46] ASHRAE, ANSI/ASHRAE STANDARD 62.1-2013. Ventilation for acceptable
indoor air quality. Atlanta, GA, 2013.
engineering,” Struct. Multidiscip. Optim., vol. 26, no. 6, pp. 369–395, Apr. 2004. [48] K. Deb, A. Pratap, S. Agarwal, and T. Meyarivan, “A fast and elitist
multiobjective genetic algorithm: NSGA-II,” IEEE Trans. Evol. Comput., vol. 6, no. 2, pp. 182–197, 2002.
[49] J. J. Durillo and A. J. Nebro, “jMetal: a Java framework for multi-objective optimization,” Adv. Eng. Softw., vol. 42, pp. 760–771, 2011.
[50] S. Flöry, “Goat.” Rechenraum e.U., Vienna. www.rechenraum.com/goat/download.html.
[51] G. Hammond and C. Jones, “Inventory of Carbon & Energy (ICE), Version 1.6a.,” University of Bath, 2010.
[52] D. Bourgeois, C. Reinhart, and I. Macdonald, “Adding advanced behavioural models in whole building energy simulation: A study on the total energy impact of manual and automated lighting control,” Energy Build., vol. 38, no. 7, pp. 814– 823, 2006.
[53] K. Deb and S. Gupta, “Understanding knee points in bicriteria problems and their implications as preferred solution principles,” Eng. Optim., vol. 43, no. 11, 2011.
Figures
Note: These are low-resolution preview images only.
Fig. 1. The contributions of embodied and operational energy to the cumulative total
energy usage of a typical building. Values from [6].
Fig. 2. Flowchart describing the computational methodology for generating Pareto
Fig. 3. Geometric diagrams of the design space and constructed buildings that correspond
to each architectural problem. Images courtesy of [26], [31], [32].
Fig. 4. Demonstration of the NSGA-II multi-objective optimization algorithm
progressively finding solutions closer to the actual Pareto front using crossover and mutation of high-performing designs in the previous generation.
Fig. 5. Approximations of the Pareto front between the embodied energy of the structure
and the annual operational energy of each building design.
Fig. 6. A plot showing the absolute location of each Pareto front along with the
Fig. 7. A comparison of the shape and location of the structure-energy Pareto front for
different design assumptions concerning the lifetime and operating efficiency of a typical building.

![Table 2. Climate characteristics for each case study location. Values from [40].](https://thumb-eu.123doks.com/thumbv2/123doknet/14682829.559636/15.918.93.823.199.476/table-climate-characteristics-case-study-location-values.webp)
![Table 4. Modeling assumptions for the energy models. Values from [40] , [45], [46].](https://thumb-eu.123doks.com/thumbv2/123doknet/14682829.559636/18.918.124.816.519.918/table-modeling-assumptions-energy-models-values.webp)
![Table 5. Assumptions for conversion to embodied and primary energy. Values from [51]](https://thumb-eu.123doks.com/thumbv2/123doknet/14682829.559636/21.918.137.785.337.511/table-assumptions-conversion-embodied-primary-energy-values.webp)