Women and Children Due to FO Differences?
DIETER MAURER, NORMAN COOK, THEODOR LANDIS, CHRISTIAN D'HEUREUSE
Neuropsychologische Abteitung, Neurologische Klinik, Universitdlsspital Zurich, Haldenbach D, CH-8091 Zurich. Switzerland
Introduction
Formant measurements show sex and age differences in the formant patterns of a single vowel category. Comparisons of the formant frequency values of men, women and children indicate low, middle and high values, respectively (Chiba & Kajiyama 1941, Potter & Steinberg 1950, Peterson & Barney 1952). The differences are found for all vowel categories, and they have generally been interpreted as a consequence of different vocal tract size.
Early studies on vowel synthesis (Potter & Steinberg 1950, Miller 1953) indicated, and recent investigations on synthetic vowels (Traunmiiller 1981, 1985), vowel synthesizers (Bennett & Rodet 1989) and analysis of real vocalizations (Maurer et al. 1991) have suggested a direct relationship of the formant pattern with FO. Because of this, the differences in the patterns for men, women and children could stem at least in part from the different FO of their speech. And if so, the differences should partly disappear when FO values of the different speaker groups are identical.
This article gives the results of a study which investigated the formant patterns of five German vowels of men, women and children both at the FO of their normal speech and at the same FO among the speaker groups.
M e t h o d s
In acoustic theory, formants are regarded as resonances of the vocal tract (Fant 1960), or as energy concentration positions in the speech waves, i.e., energy peaks in the spectral envelope (Joos 1948, Potter & Steinberg 1950). Because the principal idea of our study was to reexamine the formant patterns in a manner comparable to those of Potter & Steinberg (1950) and Peterson & Barney (1952), we looked at the formants as energy concentration positions in the speech waves, and investigated the frequency values of the formants with LPC analysis. It is of importance to note that this investigation is made solely from the perspective of the physical properties of the vowel sound wave, and not from the perspective of speech production. The difference between these views is that a formant regarded as a maximum of the vocal tract transfer function may sometimes not be represented as an energy peak in the spectral envelope, particularly in high pitched vowels. In addition, from the viewpoints of speech production and of acoustic phonetics, there is no dependence of the formant pattern on F0, whereas in the analysis of real vocalizations and in vowel synthesis, such a dependency is indicated.
Our reexamination of the sex and age differences in vowel formant patterns was confined to the investigation of the means and standard deviations of the formant frequency values. Formant amplitudes and bandwidths are known to be largely irrelevant to vowel
quality (Klatt 1982).
Two methodological problems had to be solved: The determination of formant frequencies is ambiguous for higher FO (Peterson & Barney 1952). LPC analysis does not always reveal the same number of formants within one vowel category, given one parameter setting for all the analyzed vowel sounds (Maurer et al. 1991). In consequence, not all vowel sounds of one category will show the formant pattern given in the literature, nor the expected formant frequency values, nor the expected number of formants. In a preliminary stage, therefore, rules for the selection of the vowel sounds to be subjected to statistical analysis were determined. Subsequently, the means and standard deviations of the formant frequencies of all the selected vowels were calculated.
Data collection and selection
Five German vowels spoken by seven men, seven women and seven children were recorded at different FO to create a collection of 280 vowels with both different and equal FO's for the different speaker groups. Subsequently, the vocalizations were presented to 4 members of the Neuropsychology Unit (Zurich University Hospital) for identification. Thirdly, the formant patterns of the identified vocalizations were studied to obtain the rules of selection for statistical calculation.
Subjects: The age ranges of the men and women were from 20-40 years. The children
were 9 years old. Only those men who could vocalize clearly one octave above their ordinary speech level were chosen.
Vowels and FO: We studied the German vowels [u:], [o:], [a:], [e:], and [i:]
pronounced with FO of approximately 110, 170, 220, and 270Hz for men, 170, 220, and 270Hz for women, and 270Hz for children.
Recording Procedure: For each vocalization the subject heard a standard vowel target.
He or she then had to produce the same vowel on the same level of F0 and had to sustain it for at least 2 sec. The vocalization was recorded by digitizing 2 sec. of the sound at a sampling frequency of 10417Hz. The standard and recorded vowels were then compared, and the recording was retained if the recorded vowels were the same as the standard in terms of category and F0.
Identification Test: The recorded vocalizations were presented to four members of the
Neuropsychology Unit, who gave the vowel identity in API/IPA. If the identification of at least three of them was in accordance with the recording procedure, the vowel was taken as correctly identified and was selected for statistical analysis. If not, it was excluded from further study. Eleven of the 280 vocalizations were not recognized clearly in the identification test and were excluded.
Formant Determination: In order to calculate the formant frequency values, we applied
LPC analysis with the following parameter settings: Hamming window of 1048 sampling points; analyzed time frame = 0.1 sec (1.0 - 1.1 sec of recording); filter order = 12; analyzed frequency range = 5kHz; pre-emphasis = 98%; formant bandwidth < 500Hz.
Formant Pattern Determination: The study of the formant frequency values of the
vowels confirmed the methodological problems noted above. Most importantly, LPC analysis did not reveal a constant number of formants within one vowel category. For [u:] and [o:] there were vocalizations found with only one formant frequency below 1.5kHz. For [a:] there were vocalizations found with three formant frequencies below 1.5kHz. On the other hand, for the vocalizations of [u:], [o:] and [a:] which showed two formant frequencies below 1.5kHz, the third formant frequency was not found to behave as might be expected from the literature. That is, within a given speaker group, either the fourth formant frequency of a vocalization had a value equal to or below the third formant frequency of another vocalization of the same vowel category, or there was no third formant frequency found (see Jorgensen 1969, for similar results).
We therefore formulated rules for the selection of the vowels to be included in the statistical analysis: The formant pattern of a vowel had to show two formant frequencies for [u:], [o:] and [a:], and three formant frequencies for [e:] and [i:] within certain frequency regions corresponding to the formant frequencies given in the literature for German vowels (Jorgensen 1969, Wangler 1981). Table 1 shows these formant regions. For [e:] and [i:], we did not exclude F3 because of a possible interaction of F2 with F3 and because of the possible importance of this interaction for the vowel identity. Determination of F3 for these two vowels is less ambiguous than for the other vowels, but still vague for some vocalizations.
Table 1: Expected formant frequency regions in Hz for the five German vowels. (Values are not given separately for the different speaker groups, hence regions overlap for formant frequencies above 2kHz.)
owel [u:] [o:] ta:] [e:] [i:] Fl min/max 200-400 300-600 550-850 300-600 200-400 F2 min/max 600-1000 650-1200 900-1600 1800-2800 1900-3200 F3 min/max — --— 2400-3700 2500-4200
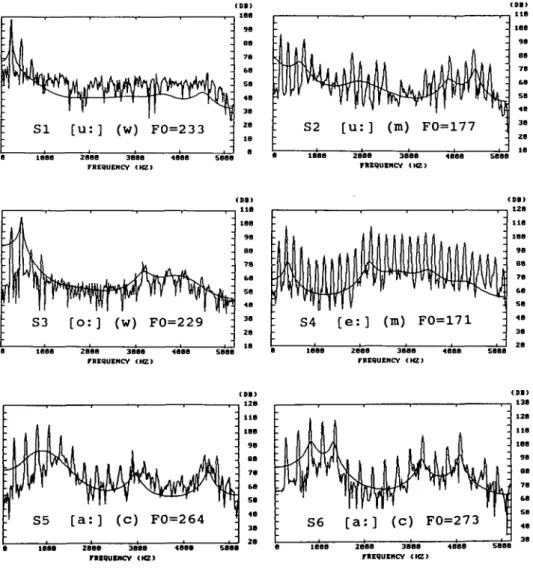
Fourteen of the remaining 269 vocalizations showed LPC resonance patterns which did not coincide with the expected number and frequency regions of the formants as given in Table 1, and were also excluded from the analysis (Table 3, column 6 on the right). Figure 1 illustrates various cases in which LPC analysis failed to reveal the expected number of formants. Moreover, within the expected range of formant values the variations were extreme in some cases. Figure 2 shows three such examples. There were formant patterns for one vowel category for which F2 of one pattern is near to F3 of the other one, accompanied by a difference for F3 of the two patterns of 800Hz (see Figure 2, S7-S10)! There were also patterns for which a relatively low F2 and high F3 of one vocalization represent the same vowel identity as a relatively high F2 and low F3 (see Figure 2, SI 1 and S12). In general, we found tha"t particularly the formant frequencies above 2kHz varied strongly in a non-systematic way.
S I [ u : ] (w) F0=233 2888 3888 FREQUENCY <HZI 2BBS 3BBB 4888 FREQUENCY (IC) S3 [o:] (w) F0=229 2888 3888 FREQUENCY CHZ> 2B68 3888 FREQUENCY <HZ> S5 [a:] (c) F0=264 S6 [a:] (C) F0=273 2888 FREQUENCY <KZ>
FIGURE 1: Spectra of vocalizations excluded for not coinciding with expected formant patterns in Table 1. S(i) = Spectrum number; m = man, w = woman, c = child. For corresponding LPC resonance frequencies, see Table 2. S1-S3 show only one relevant formant frequency for [u:] and [o:] (S2 is a little nasal, but clearly identified). S4 represents a man's [e:] for which the determination of F3 is unclear. The LPC resonance frequency for F3 lies within the expected area of Table 1, but far exceeds the values of the other men's. For S5 there is no pattern of Fl and F2 for [a:], as found for the parallel vocalization with "normal" values in S6 (there was almost no difference in vowel color for these two [a:]; compare also Figure 4).
2aaa sees FREQUENCY ( H Z ) zeoe 3868 FREQUENCY CKZ) S10 [1:] (c) F0=276 2«ee 3eee FREQUENCY (KZ> zaae 3eee FREQUENCY (HZ) S12 [ e : ] (c) FO=278 S l l [ e : ] (c) F0=285 zaaa 3aaa FREQUENCY ( H Z ) 2eea 3eee FREQUENCY (HZ)
FIGURE 2: Variations of F2 and F3 for [e:] and [i:]. S7 and S8 are [e:]'s from two women. For corresponding LPC resonance frequencies, see Table 2. F3 of S7 is near to F2 of S8. The variation of F3 for the two vocalizations is ca. 800Hz! S9 and S10 show the same for [i:]'s of two children. Sll and S12 show another type of variation: High F2 and low F3 for SI 1 in comparison with low F2 and high F3 of SI2.
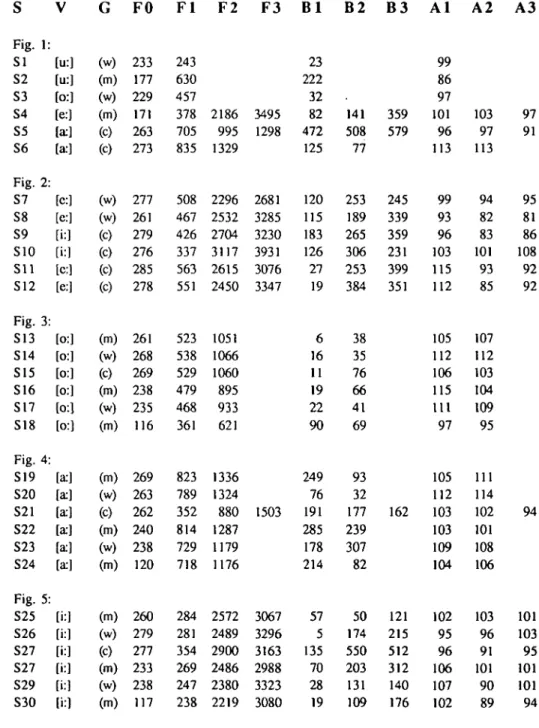
Table 2: LPC resonance frequencies, bandwidths (in Hz), and amplitudes (in dB)of the single vocalizations in Figures 1-5. S(i) = spectrum number, V = vowel; G = group (m = man, w = woman, c = child); F(i) = formant frequency; B(i) = formant bandwidth; A(i) = formant amplitude.
G FO F l F2 F 3 B l B2 B 3 A l A2 A3 Fig. SI S2 S3 S4 S5 S6 Fig. S7 S8 S9 S10 Sll S12 Fig. S13 S14 S15 S16 S17 S18 Fig. S19 S20 S21 S22 S23 S24 Fig. S25 S26 S27 S27 S29 S30 1: 2: 3: 4: 5: [u:] [u:] [o:] [e:] [a:] [a-] [c:] [e:] [i:] [i:] [c:] [e:] [o:] [o:] [o:] [o:] [o:] [o:] [a:] [a:] [a] [a] [a] [a] [i:l [i:l [i:l (i:l [i:l [i:J (w) (m) (w) (m) (c) (c) (w) (w) (c) (c) (c) (c) (m) (w) (c) (m) (w) (m) (m) (w) (c) (m) (w) (m) (m) (w) (c) (m) (w) (m) 233 177 229 171 263 273 277 261 279 276 285 278 261 268 269 238 235 116 269 263 262 240 238 120 260 279 277 233 238 117 243 630 457 378 705 835 508 467 426 337 563 551 523 538 529 479 468 361 823 789 352 814 729 718 284 281 354 269 247 238 2186 995 1329 2296 2532 2704 3117 2615 2450 1051 1066 1060 895 933 621 1336 1324 880 1287 1179 1176 2572 2489 2900 2486 2380 2219 3495 1298 2681 3285 3230 3931 3076 3347 1503 3067 3296 3163 2988 3323 3080 23 222 32 82 472 125 120 115 183 126 27 19 6 16 11 19 22 90 249 76 191 285 178 214 57 5 135 70 28 19 141 508 77 253 189 265 306 253 384 38 35 76 66 41 69 93 32 177 239 307 82 50 174 550 203 131 109 359 579 245 339 359 231 399 351 162 121 215 512 312 140 176 99 86 97 101 96 113 99 93 96 103 115 112 105 112 106 115 111 97 105 112 103 103 109 104 102 95 96 106 107 102 103 97 113 94 82 83 101 93 85 107 112 103 104 109 95 111 114 102 101 108 106 103 96 91 101 90 89 97 91 95 81 86 108 92 92 94 101 103 95 101 101 94
Results
The vocalizations which remained after the preliminary study were used to obtain formant statistics, and the mean and the standard deviation values of FO and the formants were calculated (see Table 3).
The means and standard deviations of the formant frequencies of the analyzed vowels are shown in Table 3. These indicate four major results.
1) The formant frequencies generally rise with FO, i.e., within one speaker group the formant frequencies differ depending on the FO of the vocalizations.
2) When FO is the same there is no sex difference for Fl and F2 for [u:], [o:] and [a:], nor for Fl of [e:] and [i:].
3) The comparison of adults and children shows no or only a marginal difference for Fl and F2 for [u:], and for Fl of [o:], [a:], [e:] and [i:].
4) Above 2kHz, all the formant frequencies of the women show higher means than the men's, and the children show the highest values.
To interpret these results, the overlapping of the formant frequency regions indicated by the standard deviations must be taken into account. To give an example of the consequence of such an overlapping, Figures 3 - 5 show comparisons of [o:], [a:] and [i:] of a man, a woman and a child. For [o:] and [a:] there is no formant pattern differences indicated below 2kHz.
Table 3: Formant table. Means (x) and standard deviations (SD) of the formant frequencies in Hz (m = men, w = women, c = children) grouped by FO range. The numbers of excluded vocalizations based on identification (I) or spectral shape (S) are given in the last two columns.
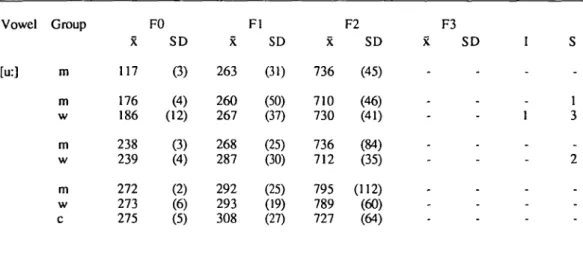
Vowel Group [u:] m m w m w m w c X 117 176 186 238 239 272 273 275 FO SD (3) (4) (12) (3) (4) (2) (6) (5) X 263 260 267 268 287 292 293 308 Fl SD (31) (50) (37) (25) (30) (25) (19) (27) X 736 710 730 736 712 795 789 727 F2 SD (45) (46) (41) (84) (35) (112) (60) (64) F3 x SD
-Vowel Group FO Fl F2 F3 x SD x SD x SD x SD I S [o:] m 117 (2) 346 (6) 700 (70) m 175 (2) 358 (39) 743 (48) w 175 (2) 371 (33) 714 (61) -m 235 (6) 468 (24) 840 (85) . . . . w 235 (2) 464 (7) 887 (77) - - - 2 m 267 (5) 506 (38) 881 (105) -w 268 (2) 533 (19) 873 (84) - - 1 c 274 (7) 547 (11) 1098 (49) [a:] m 116 (3) 691 (67) 1099 (82) -m 173 (2) 661 (41) 1094 (66) w 172 (2) 691 (61) 1149 (75) m 234 (5) 739 (70) 1160 (138) w 236 (2) 738 (45) 1217 (80) m 264 (7) 746 (65) 1184 (127) -w 263 (2) 757 (85) 1214 (112) c 268 (5) 797 (35) 1366 (155) . . . 3 [e:] m 119 (3) 335 (17) 2050 (167) 2633 (132) m 174 (2) 365 (17) 2098 (181) 2669 (102) - 1 w 177 (4) 373 (24) 2315 (79) 2992 (152) - 1 m 232 (5) 444 (23) 2090 (240) 2752 (133) 1 w 236 (3) 457 (14) 2310 (57) 2964 (181) 1 m 271 (2) 468 (85) 2120 (138) 2797 (158) 3 w 271 (6) 504 (33) 2327 (116) 2889 (251) 1 c 277 (4) 551 (8) 2569 (100) 3431 (202) 1 [i:] m 120 (3) 247 (18) 2165 (126) 2953 (170) m 177 (2) 285 (39) 2275 (188) 2959 (157) w 178 (2) 297 (51) 2327 (125) 3292 (200) m 235 (4) 268 (23) 2292 (247) 2906 (196) w 237 (3) 258 (17) 2435 (113) 3507 (298) m 274 (8) 288 (10) 2404 (234) 2941 (136) 1 w 277 (2) 287 (9) 2490 (183) 3355 (172) - 1 c 277 (4) 325 (35) 2868 (160) 3497 (203) 1
III! 121 S13 [ o : ] (m) F0=261 tin 121 S14 [ o : ] (w) F0=268 S17 [ o : ] (w) F0=235 Illl 121 S15 [ o : ] (c) F0=269 2111 3161 rinuiKv iiei Figure 3
FIGURE 3: Vocalizations of [o:] of a man, a woman and a child. For corresponding LPC resonance frequencies, see Table 2. No formant pattern differences were found for the same FO, but formant pattern differences within a speaker group were found for different FO.
S19 [ a : ] (m) F0=269 S21 [ a : ] (c) F0=262 S22 [ a : ] (m) F0=240 S24 [ a : ] (m) F0=120 an an ritwnor iiei Figure 4
FIGURE 4: Vocalizations of [a:] of the same speakers as in Figure 3. For corresponding LPC resonance frequencies, see Table 2. There were no formant pattern differences for the man and woman. The formant determination of the child's vowel is unclear, but there is no indication of higher values for Fl and F2 in comparison with the man and the woman.
m i 131 S25 [ i : ] (m) F0=260 S2fa [ i : ] (w)F0=279 in) in (III S27 [ i : ] (c) F0=277 mi ia S29 [ i : ] (w)' F0=238 S30 [ i : ] (m) F0=117 i ina 2JM w e rmiciicy (IE) Figure 5
FIGURE 5: Vocalizations of [i:] of the same speakers as in Figure 3. For corresponding LPC resonance frequencies, see Table 2. No formant pattern differences were found for Fl and F2 comparing the man and woman, but different F3 were found. The child shows a higher formant pattern than the adults.
The main purpose of this investigation was to reexamine the sex and age differences in formant patterns in order to determine whether they are due to different sex or age, or whether they are due to differences in FO. When men, women and children vocalize at the FO of their ordinary speech, the formant patterns differ for the different speaker groups. This result corresponds to the formant statistics given in the literature, notably to the formant frequency values given by Potter & Steinberg (1950) and Peterson & Barney (1952). When the FO of the different speaker groups was the same, for Fl in all vowels and for Fl and F2 in back vowels, the differences between men and women, and most of those between adults and children disappeared. That is, the lower formants shift with FO. This result confirms a dependence of the formant patterns on FO as previously shown in studies on vowel synthesis and the analysis of real vocalizations.
In contrast to the results for the lower frequency formants, the results for those above 2kHz are somewhat difficult to interpret. The standard deviations of these formant frequencies are large, and an overall pattern of changes is not found. For example, some values indicate a shift of the formants with FO (e.g., F2 of the men for [i:]) and some do not (e.g., F2 of the women for [e:]). In general, children show higher frequency values for [e:] and [i:] than women, and these two groups show higher values than men even when FO is the same. Figure 6 illustrates these findings for the two vowels [o:] and [e:].
3000
FIGURE 6: Mean formant frequencies Fl and F2 of [e:] and [o:] spoken by men (m), women (w), and children (c) at various FO's (for the corresponding frequency values see Table 3).
F2 [e]
F2 [o]
F1
[e],[
FO and for all the formant and for all the vowel categories, but were not found. Sex and age differences seem to be related only to higher formant frequencies.
It should be emphasized that such an interpretation is consistent with what is known from vowel synthesis. For example, if in synthesis a vowel sound is produced with a constant formant pattern, but FO is altered, the vowel identity often changes. Conversely, if one tries to hold the identity of the synthesized vowel sound constant, the formant pattern must be changed with altering FO. What is true for synthesis is also indicated for real vocalizations. Similar phenomena should therefore be found in the analysis of real vocalizations as are found in synthesis because both are related to the perceptual identification of the sound.
The high vocalizations of the men can be considered as shouted or sung. Traunmiiller (1988) showed that variations in vocal effort affect FO and the formant frequencies in the sense of a linear compression/expansion of the distances between them, if scaled logarithmically or in Bark. Given such a scaling, a linear compression is found in our results for men. This indicates that the effects reported by Traunmiiller (1988) are not limited to variations in vocal effort, but can also be observed when FO is altered for some other reason. On the other hand, studies of sung vowels show a shift of the formant frequencies with FO without invoking the concept of vocal effort: The differences of the formant frequencies for men and women disappear for equal FO, while they appear within one singer group for different FO (Bloothooft & Plomp 1985). Our results are congruent with this finding.
There is an interesting difference between the productional perspective on the one hand, and the perspectives of perception and of the physical description of the vowel sound wave on the other. In production theory the formants as resonances of the vocal tract are independent of FO. Conversely, in the perspectives of perception and of the physical description of the sound wave, there is a clear indication of a direct relationship between the formant frequencies and FO. Our results confirm such a relationship. In consequence, and given a perceptual or a descriptional perspective (including vowel synthesis), it can be said that a formant pattern does not determine a vowel identity entirely because of its dependence on FO. Different formant patterns can represent one vowel category for one speaker group. (It must be emphasized that such differences in the formant patterns do not affect the vowel identity itself.) Conversely, there are examples of vocalizations within one speaker group for which a given formant pattern represents different vowel categories with different FO (Maurer et al. 1991). Therefore, and in the light of the results of the present reexamination, we conclude that the sex and age differences of the formant frequencies below 2kHz found in vocalizations at the ordinary FO of speech of the different speaker groups must be explained primarily by the difference of FO of the vocalizations. We suggest that the articulatory process relates principally to the FO of the vocalization.
Acknowledgement
This study was supported by the Janggen-Pohn Stiftung (St. Gallen), and the EMDO-Stiftung (Zurich).
References
BENNETT, G. AND RODET, X. (1989). Synthesis of the singing voice. In Matthews, M.V. and Pierce, R. (editors), Current Directions in Computer Music Research. Cambridge, Mass.: M.I.T. Press, 19-44.
BLADON, A. (1982). Arguments against formants in the auditory representation of speech. In Carlson, R. and Granstrom, B. (editors), The Representation of Speech in the
Peripheral Auditory System : New York: Elsevier Biomedical Press, 95-102.
BLOOTHOOFT, G. AND PLOMP, R. (1985). Spectral analysis of sung vowels II: The effect of fundamental frequency on vowel spectra. Journal of the Acoustical Society of
American, 1580-8.
CHIBA, T. AND KAJIYAMA, M. (1941). The Vowel: its Nature and Structure. Tokyo: Tokyo-Kaiseikan.
JORGENSEN, H.P. (1969). Die gespannten und ungespannten Vokale in der nord-deutschen Hochsprache mit einer spezifischen Untersuchung der Struktur der Formant-frequenzen. Phonetica 19, 217-45.
JOOS, M. (1948). Acoustic Phonetics (Language Monograph 23). Baltimore: Linguistic Society of America.
KLATT, D.H. (1982). Prediction of perceived phonetic distance from critical-band spectra: A first step. Proceedings of the International Conference on Acoustics, Speech and
Signal Processing (ICASSP) 1982, 1278-81.
MAURER, D., LANDIS, T. AND D'HEUREUSE, C. (1991). Formant movement and formant number alternation with rising FO in real vocalizations of the German vowels [u:], [o:] and [a:]. International Journal of Neuroscience 57, 25-38.
MILLER, R.L. (1953). Auditory tests with synthetic vowels. Journal of the Acoustical
Society of America 25, 114-21.
PETERSON, G.E. AND BARNEY, H.L. (1952). Control methods used in a study of the vowels. Journal of the Acoustical Society of America 24, 175-84.
POTTER, R.K. AND STEINBERG, J.C. (1950). Toward the specification of speech. Journal
of the Acoustical Society of America 22, 807-20.
TRAUNMULLER, H. (1981). Perceptual dimension of openness in vowels. Journal of the
Acoustical Society of America 69, 1465-1475.
TRAUNMULLER, H. (1985). The role of the fundamental and the higher formants in the perception of speaker size, vocal effort and vowel openness. PERILUS 4, (Institute of Linguistics, University of Stockholm) 92-102.
TRAUNMULLER, H. (1988). Paralinguistic variation and invariance in the characteristic frequencies of vowels. Phonetica 45, 1-29.
W ANGLER, H.H. (1981). Atlas der Deutschen Sprachlaute. Berlin: Akademie Verlag, 20-22.
![FIGURE 2: Variations of F2 and F3 for [e:] and [i:]. S7 and S8 are [e:]'s from two women](https://thumb-eu.123doks.com/thumbv2/123doknet/14890879.649171/5.733.112.654.214.782/figure-variations-f-f-e-s-s-women.webp)
![FIGURE 3: Vocalizations of [o:] of a man, a woman and a child. For corresponding LPC resonance frequencies, see Table 2](https://thumb-eu.123doks.com/thumbv2/123doknet/14890879.649171/9.733.135.668.168.846/figure-vocalizations-woman-child-corresponding-resonance-frequencies-table.webp)
![FIGURE 4: Vocalizations of [a:] of the same speakers as in Figure 3. For corresponding LPC resonance frequencies, see Table 2](https://thumb-eu.123doks.com/thumbv2/123doknet/14890879.649171/10.733.106.636.138.811/figure-vocalizations-speakers-figure-corresponding-resonance-frequencies-table.webp)
![FIGURE 5: Vocalizations of [i:] of the same speakers as in Figure 3. For corresponding LPC resonance frequencies, see Table 2](https://thumb-eu.123doks.com/thumbv2/123doknet/14890879.649171/11.733.135.634.146.814/figure-vocalizations-speakers-figure-corresponding-resonance-frequencies-table.webp)
![FIGURE 6: Mean formant frequencies Fl and F2 of [e:] and [o:]](https://thumb-eu.123doks.com/thumbv2/123doknet/14890879.649171/12.733.351.699.493.990/figure-mean-formant-frequencies-fl-f-e-o.webp)